


1. Introduction
With the recent notable advancements in computer technologies and, by extension, in the computational mechanics, there is a rapidly growing interest toward using large eddy simulations (LES) in a wide range of applications (Piomelli Reference Piomelli2014; Bouffanais Reference Bouffanais2010). In LES, one resolves the large energy-containing eddies by modelling the interplay between large- and subgrid-scale motions. Due to the tendency of small scales to homogeneous and universal dynamics, LES offers more accurate predictions comparing with the results of resolving the Reynolds-averaged Navier–Stokes (RANS) equations (Zhiyin Reference Zhiyin2015; Holgate et al. Reference Holgate, Skillen, Craft and Revell2019). Furthermore, it lightens the burden of computational costs imposed by accurately capturing the dissipative scales in direct numerical simulations (DNS).
Concurrent with the recent computational advancements, a marked shift occurred toward using artificial intelligence (AI) as an effective and tractable tool in turbulence modellings due to their significant capabilities in reproducing statistical properties (Beck & Kurz Reference Beck and Kurz2020). Several assorted machine learning (ML) algorithms were proposed for turbulence closure problems including kernel regression and a deep neural network (Pawar et al. Reference Pawar, San, Rasheed and Vedula2020; Sirignano, MacArt & Freund Reference Sirignano, MacArt and Freund2020; Portwood et al. Reference Portwood, Nadiga, Saenz and Livescu2021). Essentially, pure ML based approaches are limited by the representative training dataset though they appear to be simpler for implementation. Moreover, to pinpoint complex patterns, large volumes of data are required for the algorithms to learn physical constraints (e.g. frame invariance) and statistical properties, which secondarily makes further complications like optimizing of data compression (Chao et al. Reference Chao, Kulkarni, Goebel and Fink2020). This reveals the significance of physics-based models in mentoring the AI approaches and pushing hybrid models as a new direction (Patra, Bevilacqua & Safaei Reference Patra, Bevilacqua and Safaei2018; Jouybari et al. Reference Jouybari, Yuan, Brereton and Murillo2020; Taghizadeh, Witherden & Girimaji Reference Taghizadeh, Witherden and Girimaji2020; Willard et al. Reference Willard, Jia, Xu, Steinbach and Kumar2020).
Physics-based approaches introduce a mathematical representation of physical structures through a number of parameters with a sufficient amount of information. Contrary to ML based approaches, physics-based models do not involve large volumes of data although they are inherently limited by the model incompleteness or the complexity of parameterizing physical structures (Chao et al. Reference Chao, Kulkarni, Goebel and Fink2020). Accordingly, it is markedly essential to entail the underlying statistical properties in formulating and inferring an optimum model in a numerically rigorous framework. Employing principles of physics and borrowing insights from the statistical analysis, this approach forms a model for real phenomena, which can also be used to guide the ML algorithms properly (see, e.g. Kurz & Beck Reference Kurz and Beck2020; Akhavan-Safaei, Samiee & Zayernouri Reference Akhavan-Safaei, Samiee and Zayernouri2021; You et al. Reference You, Yu, Trask, Gulian and D'Elia2021).
Establishment of such a physically consistent LES model ties strongly with characterization of non-local turbulence mechanisms and a better understanding of anomalous structures. As a puzzling feature, the non-Gaussian behaviour of turbulent dynamics is linked to the spatial intermittency of small-scale motions, which is embodied in the form of very thin and elongated vortices (Vincent & Meneguzzi Reference Vincent and Meneguzzi1991; Laval, Dubrulle & Nazarenko Reference Laval, Dubrulle and Nazarenko2001). Technically, the non-local closure of Navier–Stokes (NS) equations, originated from the Green's function of the Laplacian operator for solving the Poisson pressure equation, induces long-range interactions (non-local triadic structures) in spectral space of homogeneous turbulence (Sagaut & Cambon Reference Sagaut and Cambon2008). In a preliminary investigation of isotropic turbulence (She, Jackson & Orszag Reference She, Jackson and Orszag1990), the significant role of highly vortical structures, typically tube-like, was disclosed on generating non-local dynamics and coherence of turbulence. Supported by Laval et al. (Reference Laval, Dubrulle and Nazarenko2001), non-locality as a crucial element in generating intermittent structures has a tendency to prevail the local interactions by orders of magnitude. Recently, Mishra & Girimaji (Reference Mishra and Girimaji2019) studied the role of pressure on non-local mechanisms in incompressible turbulent flows and identified the intercomponent of energy transfer by the rapid pressure–strain correlation. For more information, the reader is referred to Buaria, Pumir & Bodenschatz (Reference Buaria, Pumir and Bodenschatz2020), Pang et al. (Reference Pang, D'Elia, Parks and Karniadakis2020), Akhavan-Safaei, Seyedi & Zayernouri (Reference Akhavan-Safaei, Seyedi and Zayernouri2020) and Hamlington & Dahm (Reference Hamlington and Dahm2008).
From this perspective, an ideal subgrid-scale (SGS) model represents the correct statistics of the filtered real turbulence at the resolved levels. Given the dependence of an ideal model on an infinite-dimensional set of multi-point statistics, it would be more practical to define a weaker set of conditions in a study of SGS parameterizations (Sagaut & Cambon Reference Sagaut and Cambon2008). As one of the earliest studies on statistical analysis of LES, Meneveau (Reference Meneveau1994) derived a closed set of necessary, yet mild, conditions to fulfil a priori consistency in SGS quantities. In the case of homogeneous anisotropic turbulent flows, the Kármán-Howarth (KH) theorem were studied in Hill (Reference Hill2002) by eliminating pressure velocity correlations to determine the two-point structure function equations. By proposing a hyper eddy-viscosity term in Cerutti, Meneveau & Knio (Reference Cerutti, Meneveau and Knio2000), SGS dissipation spectra were measured in a locally isotropic turbulence to assess the ability of classical two-point closures in predicting the mean energy transfer. More generally, Cambon & Scott (Reference Cambon and Scott1999) discussed the importance of non-local structures in capturing the wide continuum of turbulent scales in RANS modellings. Focusing on anisotropic dynamics, Cambon & Scott (Reference Cambon and Scott1999) and Kassinos, Reynolds & Rogers (Reference Kassinos, Reynolds and Rogers2001) reviewed a range of non-local RANS models and described the improvements in understanding the internal dynamics of turbulent structures. Furthermore, Mishra & Girimaji (Reference Mishra and Girimaji2017) outlined a framework to formulate a pressure–strain correlation model by augmenting the degree of non-locality over a range of homogeneous turbulent flows. Recently, some of the prevailed challenges in developing an optimal LES model were reviewed succinctly by Moser, Haering & Yalla (Reference Moser, Haering and Yalla2021).
Statistical descriptions of an ideal closure model motivated us toward developing non-local approaches in terms of two-point high-order structure functions. The eddy damped quasi-normal Markovian approach, described in Briard, Gomez & Cambon (Reference Briard, Gomez and Cambon2016), undertakes closing of SGS motions in a spectral space by involving high-order statistical moments. As a functional approach, direct interaction approximation pushes the non-Markovanized stochastic models to the direction of turbulence closure problems, whose solutions are constructed in a fraction form (Shivamoggi & Tuovila Reference Shivamoggi and Tuovila2019). Furthermore, multifractal models (Yang & Lozano-Durán Reference Yang and Lozano-Durán2017; Burton & Dahm Reference Burton and Dahm2005) suggest a potential realizable strategy to accurately capture anomalous scaling exponents, observed in turbulent velocity increments. In addressing statistical local and non-local interactions, this progress proceeds with modelling turbulent effects at the kinetic level. Premnath, Pattison & Banerjee (Reference Premnath, Pattison and Banerjee2009) developed a framework for applying a dynamic procedure into the lattice-Boltzmann method for LES of inhomogeneous and anisotropic turbulent flows. A new collision approach was proposed by Jacob, Malaspinas & Sagaut (Reference Jacob, Malaspinas and Sagaut2018) for LES of weakly compressible flows using two forms of the modified Bhatnagar–Gross–Krook (BGK) collision operators. For a more comprehensive review of the literature, we refer the reader to Jin et al. (Reference Jin, Wang, Wang and He2018) and Sagaut (Reference Sagaut2010).
Focusing on the key ideas of (i) describing of anomalous structures in turbulence and (ii) non-local closure modelling, fractional calculus appears to be a tractable mathematical tool due to their power-law or logarithmic types of kernel. Egolf & Hutter (Reference Egolf and Hutter2017) generalized Reynolds shear stresses in a local zero-equation to the fractional counterparts. Furthermore, Epps and Cushmann-Roisin derived fractional NS equations from the Boltzmann transport equation in Epps & Cushman-Roisin (Reference Epps and Cushman-Roisin2018), which supply profound understandings of turbulent non-local effects at the kinetic level. For more information, Egolf & Hutter (Reference Egolf and Hutter2020) provide a comprehensive overview of fractional and non-local turbulence, spanning from coherent structures to state-of-the-art ideas on closure modelling of canonical flows. Recently, Di Leoni et al. (Reference Di Leoni, Zaki, Karniadakis and Meneveau2020) contributed in fractional LES modelling by developing a two-point correlation based model in a robust physically meaning framework.
In the class of non-local models, Samiee, Akhavan-Safaei & Zayernouri (Reference Samiee, Akhavan-Safaei and Zayernouri2020a) laid out a mathematical framework for developing fractional models, which starts treating turbulence effects at the kinetic level. In a precise derivation, the proposed distribution function in the closed form of filtered collision operator turns into a fractional model in the LES equations. Throughout a data-driven approach, Akhavan-Safaei et al. (Reference Akhavan-Safaei, Samiee and Zayernouri2021) extended the fractional modelling to the LES of scalar turbulence using two-point correlation functions between the SGS scalar flux and filtered scalar gradient. Inspired by the self-similar behaviour of cascading of energy in the inertial range and the exponential decay in the dissipation range, we focus on developing a tempered non-local model within the proposed fractional framework. Here, we briefly highlight the main contributions of this work as follows.
(i) We develop a tempered fractional SGS (TFSGS) model by employing a tempered heavy-tailed distribution starting from the kinetic level. Such a tractable fractional operator offers a great flexibility in characterizing non-local structures in the turbulent inertial and dissipation ranges through fractional and tempering parameters.
(ii) To achieve the enhanced performance of the proposed model, we also present an optimization algorithm, involving two-point structure functions. Regarding the best approximation of an ideal physics-based model, the optimized TFSGS model restores many essential statistical properties of SGS stresses and presents an a priori consistency in the dissipation spectrum.
(iii) We carry out an a posterioi analysis to investigate the numerical stability and performance of the TFSGS model.
The paper is organized as follows. In § 2 we introduce some preliminaries of tempered fractional calculus. We outline a mathematical framework in § 3 to develop the tempered fractional model from the Boltzmann transport equation and derive the corresponding form for SGS quantities. Within a statistical framework, we present a two-point structure based algorithm to infer the optimal behaviour of the tempered fractional model in § 4. Using the DNS database of a stationary isotropic turbulent flow, we evaluate the statistical a priori analysis and perform a comparative study on the two-point structure functions in § 5. Moreover, we study numerical stability of the LES solutions through an a posteriori investigation in § 5. Lastly, § 6 summarize the findings with a conclusion.
2. Preliminaries on tempered fractional calculus
Fractional calculus introduces well-established mathematical tools for an accurate description of anomalous phenomena, ubiquitous in a wide range of applications from bio-tissues (Ionescu et al. Reference Ionescu, Lopes, Copot, Machado and Bates2017; Naghibolhosseini & Long Reference Naghibolhosseini and Long2018) and material science (Meral, Royston & Magin Reference Meral, Royston and Magin2010; Suzuki & Zayernouri Reference Suzuki and Zayernouri2021; Suzuki et al. Reference Suzuki, Zhou, D'Elia and Zayernouri2021a) to vibration (Suzuki et al. Reference Suzuki, Kharazmi, Varghaei, Naghibolhosseini and Zayernouri2021b), porous media (Xie & Fang Reference Xie and Fang2019; Zaky, Hendy & Macías-Díaz Reference Zaky, Hendy and Macías-Díaz2020; Samiee et al. Reference Samiee, Kharazmi, Meerschaert and Zayernouri2020b). As an alternative approach to standard methods, they leverage their inherent potentials in representing long-range interactions, self-similar structures, sharp peaks and memory effects in a variety of applications (see Kharazmi & Zayernouri Reference Kharazmi and Zayernouri2019; Burkovska, Glusa & D'Elia Reference Burkovska, Glusa and D'Elia2020). This potential is substantially indicated by power-law or logarithmic kernels of convolution type in the corresponding fractional operators. From the stochastic point of view, fractional transport models arise from the heavy-tailed distribution functions in modelling the underlying super- or sub-diffusive motions of particles in complex heterogeneous systems at the microscopic level (Samiee, Zayernouri & Meerschaert Reference Samiee, Zayernouri and Meerschaert2019). Nevertheless, common patterns in nature follow finite-variance dynamics, which urges the role of tempered fractional calculus in representing natural cut-offs in real applications and retaining their finite statistical properties.
Recalling from Sabzikar, Meerschaert & Chen (Reference Sabzikar, Meerschaert and Chen2015) and Zayernouri, Ainsworth & Karniadakis (Reference Zayernouri, Ainsworth and Karniadakis2015), we begin with the definitions of the left- and right-sided tempered fractional derivatives respectively as
 \begin{equation} {\mathcal{D}}_{{\pm} x}^{\alpha, \lambda} u(x) = \frac{\alpha}{\varGamma(1-\alpha)} \int_{0}^{\infty} \frac{u(x)-u(x\mp s)}{s^{\alpha+1} \textrm{e}^{\lambda s} }\,\textrm{d}s, \end{equation}
where the fractional derivative order,  $\alpha \in (0,1)$, and the tempering parameter,
 $\lambda >0$. Also,
 $\varGamma (\cdot )$ represents a Gamma function. For
 $\alpha \in (1,2)$, the corresponding fractional derivatives are given by
 \begin{equation} {\mathcal{D}}_{{\pm} x}^{\alpha, \lambda} u(x) = \frac{\alpha(\alpha-1)}{\varGamma(2-\alpha)} \int_{0}^{\infty} \frac{u(x \mp s)-u(x) \pm s \dfrac{\textrm{d}u(x)}{\textrm{d}\kern0.06em x} }{s^{\alpha+1} \textrm{e}^{\lambda s} }\,\textrm{d}s. \end{equation}
The link between the derivatives in (2.2) and (2.3) and their counterparts in the Riemann–Liouville sense are described by
 \begin{gather} {}^{RL}{\mathcal{D}}_{{\pm} x}^{\alpha, \lambda} u(x) = {\mathcal{D}}_{{\pm} x}^{\alpha, \lambda} u(x) + \lambda^{\alpha}u(x), \end{gather}
 \begin{gather}{}^{RL}{\mathcal{D}}_{{\pm} x}^{\alpha, \lambda} u(x) = {\mathcal{D}}_{{\pm} x}^{\alpha, \lambda} u(x) + \lambda^{\alpha}u(x) \pm \alpha \lambda^{\alpha-1} \frac{\textrm{d}u(x)}{\textrm{d}\kern0.06em x}. \end{gather}
In particular, for  $n \geqslant 0$, the tempered integer-order derivatives are reduced as
 \begin{equation} {}^{RL}{}{\mathcal{D}}_{{+}x}^{n, \lambda} u(x) = \textrm{e}^{-\lambda x} \frac{\textrm{d}^n \left( \textrm{e}^{\lambda x} u(x) \right)}{{\textrm{d}\kern0.06em x}^n}, \end{equation}
which recover the classic integer-order derivatives as  $\lambda \rightarrow$ 0.
Let  $\mathcal {F} [ u ] (\xi )$ denote the Fourier transform of
 $u$, where
 $\xi$ is the Fourier numbers. Then, we obtain
 \begin{equation} \mathcal{F} \left[ {}^{RL}{\mathcal{D}}_{{\pm} x}^{\alpha, \lambda} u(x) \right] = (\lambda\pm \mathfrak{i} \, \xi)^{\alpha} \, \mathcal{F} \left[ u \right] (\xi). \end{equation}
In this context, the corresponding Fourier transform of the left- and right-sided tempered fractional integrals are given by
 \begin{equation} \mathcal{F} \left[ {}^{RL}{}{\mathcal{I}}_{{\pm} x}^{\alpha, \lambda} u(x) \right] (\xi) = (\lambda\pm \mathfrak{i} \, \xi)^{-\alpha} \, \mathcal{F} \left[ u\right] (\xi). \end{equation}
Evidently, tempered integrals and derivatives act as an inverse operator when  $u$ possesses sufficient regularity (see Sabzikar et al. Reference Sabzikar, Meerschaert and Chen2015; Zhang, Deng & Karniadakis Reference Zhang, Deng and Karniadakis2018). Moreover, tempered fractional operators preserve semi-group property, which prepares a useful and rigorous framework for further numerical considerations.
2.1. Tempered fractional Laplacian
Denoted by  $(\varDelta +\lambda )^{\alpha } (\cdot )$, we define the tempered fractional Laplacian of the integral form as
 \begin{equation} (\varDelta+\lambda)^{\alpha} u(\boldsymbol{x}) = C_{d,\alpha} \, \mathrm{P.V.} \int_{\mathbb{R}^d }\frac{u(\boldsymbol{x})-u(\boldsymbol{s})}{\textrm{e}^{ \lambda\vert\boldsymbol{x}-\boldsymbol{s}\vert}\vert \boldsymbol{x}-\boldsymbol{s}\vert^{2\alpha+d}} \,\textrm{d}\boldsymbol{s}, \end{equation}
where  $C_{d,\alpha } = ({-\varGamma ({d}/{2})}/{2 {\rm \pi}^{{d}/{2}}\varGamma (-2\alpha )}) ({1}/{{}_{2}{F}^{}_{1}(-\alpha, {(d+2\alpha -1)}/{2};{d}/{2};1)})$ for
 $\alpha \in (0,1)$ and
 $\alpha \neq \frac {1}{2}$. In particular,
 $d=1$
 $(\varDelta +\lambda )^{\alpha }$ is reduced to the so-called Riesz fractional form, described by
 \begin{align} (\varDelta+\lambda)^{\alpha} u(x) &= ({-}1)^{\lfloor 2\alpha \rfloor +1}\frac{{}^{RL}{\mathcal{D}}_{{+}x}^{\alpha, \lambda} u(x) + {}^{RL}{\mathcal{D}}_{- x}^{\alpha, \lambda} u(x)}{2} \nonumber\\ &= C_{\alpha} \,\mathrm{P.V.} \int_{\mathbb{R} }\frac{u(x)-u(s)}{\textrm{e}^{\lambda\vert x-s\vert}\vert x-s\vert^{2\alpha+1}} \textrm{d}s, \end{align}
where  $C_{\alpha } = ({-\varGamma ({1}/{2})}/{2 {\rm \pi}^{{1}/{2}}\varGamma (-2\alpha )}) ({1}/{\cos ({\rm \pi} \alpha )})$ (see Zhang et al. Reference Zhang, Deng and Karniadakis2018). In Appendix A, we detail the derivation of the Fourier transform of
 $(\varDelta +\lambda )^{\alpha } u(\boldsymbol {x})$, formulated as
 \begin{align} &\mathcal{F} \left[(\varDelta+\lambda)^{\alpha} u(\boldsymbol{x}) \right] (\boldsymbol{\xi}) \nonumber\\ &\quad = \mathfrak{C}_{d,\alpha} \times \left( \lambda^{2\alpha} - (\lambda^2+\xi^2)^{\alpha} {}_{2}{F}_{1}(-\alpha, \frac{d+2\alpha-1}{2};\frac{d}{2};\frac{\xi^2}{\xi^2+\lambda^2}) \right)\mathcal{F} \left[ u \right] (\boldsymbol{\xi}), \end{align}
in which  $\mathfrak {C}_{d,\alpha } = {1}/{_{2}{F}^{}_{1}(-\alpha, ({d+2\alpha -1})/{2};{d}/{2};1)}$ and
 $\xi = \vert \boldsymbol {\xi } \vert$. For
 $d=3$, we define
 $\mathfrak {C}_{\alpha } = {1}/{{}_{2}{F}^{}_{1}(-\alpha, ({2+2\alpha })/{2};{3}/{2};1)}$. It is worth noting that when
 $\lambda$ approaches
 $0$, we recover the usual fractional Laplacian in both integral or Fourier forms.
3. Boltzmannian framework
The kinetic Boltzmann transport (BT) is a formal framework for describing fluid particle motions over a wide range of flow physics (e.g. rarefied gas flows and turbulence). This framework offers great potential for the statistical description of turbulent small scales towards a better understanding of coherent structures in turbulence yet at the kinetic level. As an alternative approach in turbulent closure modelling, reconciling SGS terms in the BT and the NS equations can conceivably give rise to a rigorous physics-based model at the continuum level.
Within the BT framework proposed in Samiee et al. (Reference Samiee, Akhavan-Safaei and Zayernouri2020a), we develop an SGS model, respecting the statistical and physical properties of turbulent unresolved-scale motions.
3.1. Subgrid-scale modelling
In the description of incompressible turbulent flows, we consider LES equations (Pope Reference Pope2000), governing the dynamics of the resolved-scale flow variables,
 \begin{equation} \frac{\partial \bar{\boldsymbol{V}}}{\partial t}+ \bar{\boldsymbol{V}}\boldsymbol{\cdot} \boldsymbol{\nabla} \bar{\boldsymbol{V}}={-}\frac{1}{\rho} \, \boldsymbol{\nabla} \bar{p}+ \nu \, \boldsymbol{\nabla} \boldsymbol{\cdot} \bar{\boldsymbol{\mathsf{S}}} - \boldsymbol{\nabla} \boldsymbol{\cdot} \boldsymbol{\mathsf{T}}^{\mathcal{R}}, \end{equation}
where in the index form  $\bar {\boldsymbol {V}}(\boldsymbol {x},t)=\bar {V}_i$ and
 $\bar {p}(\boldsymbol {x},t)$ represent the velocity and the pressure fields for
 $i=1,2,3$ and
 $\boldsymbol {x}=x_i$. Moreover,
 $\nu$ and
 $\rho$ denote the kinematic viscosity and the density, respectively. Considering
 $\mathcal {L}$ as the filter width, the filtered field is obtained in the form of
 $\bar {\boldsymbol {V}}= G \ast \boldsymbol {V}$, where
 $G = G(\boldsymbol {x})$ denotes the kernel of a spatial isotropic filtering type and
 $*$ is the convolution operator. By implementing the filtering operation, we decompose the velocity field,
 $\boldsymbol {V}$, into the filtered (resolved),
 $\boldsymbol {\bar {V}}$, and the residual,
 $\boldsymbol {v}$, components. In (3.1) the filtered strain rate,
 $\bar {\boldsymbol{\mathsf{S}}}$, and the SGS stress tensor,
 $\boldsymbol{\mathsf{T}}^{\mathcal {R}}$, are defined by
 $\bar {\boldsymbol{\mathsf{S}}}_{ij}=\frac {1}{2}({\partial V_i}/{\partial x_j}+{\partial V_j}/{\partial x_i})$ and
 $\boldsymbol{\mathsf{T}}^{\mathcal {R}}_{ij}=\overline {V_i V_j}-\bar {V}_i\bar {V}_j$.
Since the filtering operator cannot commute with the nonlinear terms in the NS equations, SGS stresses must be modelled in terms of the resolved velocity field. As a common yet reliable approach, Smagorinsky (Reference Smagorinsky1963) offered modelling the SGS stresses by borrowing the Boussinessq approximation from the kinetic theory such that  $\boldsymbol{\mathsf{T}}^{\mathcal {R}} = -2 \nu _{R} \bar {\boldsymbol{\mathsf{S}}}$ and
 $\nu _{R}$ is indicated by
 $\nu _{R}= (C_s \mathcal {L})^2\,\vert \bar {\boldsymbol{\mathsf{S}}} \vert$, where
 $\vert \bar {\boldsymbol{\mathsf{S}}} \vert = \sqrt {2\bar {\boldsymbol{\mathsf{S}}}_{ij}\bar {\boldsymbol{\mathsf{S}}}_{ij}}$ and
 $C_s$ is the Smagorinsky (SMG) constant.
3.2. The BGK equation and the closure problem
Starting from the Boltzmann kinetic theory (Soto Reference Soto2016), the evolution of mass distribution function  $f$ is governed by the BT equation as
 \begin{equation} \frac{\partial f}{\partial t} + \boldsymbol{u}\boldsymbol{\cdot} \boldsymbol{\nabla} f = \varOmega(f), \end{equation}
in which  $f(t,\boldsymbol {x},\boldsymbol {u})\,\textrm {d}\boldsymbol {x}\,\textrm {d}\boldsymbol {u}$ represent the probability of finding the mass of particles, located within volume
 $\textrm {d}\boldsymbol {x}\,\textrm {d}\boldsymbol {u}$ centred on a specific location,
 $\boldsymbol {x}$, and speed,
 $\boldsymbol {u}$, at time
 $t$. It is worth noting that in the particle phase space
 $\boldsymbol {x}$,
 $\boldsymbol {u}$ and
 $t$ are independent variables. Technically, the left-hand side of (3.2) concerns the streaming of non-reacting particles in the absence of any body force and the right-hand side represents the collision operator. The most common form of
 $\varOmega (f)$ with a single collision is the so-called BGK approximation (Soto Reference Soto2016), given by
 \begin{equation} \varOmega(f)={-}\frac{f-f^{eq}}{\tau}, \end{equation}
where  $\tau$ represents the single relaxation time. In the case of incompressible flows with a roughly constant temperature,
 $\tau$ is assumed to be independent of macroscopic flow field velocity and pressure. Moreover, under the circumstances of thermodynamic equilibrium of particles,
 $f^{eq}(\varDelta )$ serves as
 \begin{equation} f^{eq}(\varDelta) = \frac{\rho}{U^3}F(\varDelta), \end{equation}
where  $F(\varDelta )=\textrm {e}^{-\varDelta /2}$,
 $\varDelta ={\vert \boldsymbol {u}-\boldsymbol {V}\vert ^2}/{U^2}$ as an isotropic Maxwellian distribution and
 $U$ denotes the agitation speed. More specifically,
 $U=\sqrt {3{k}_B T/m}$, in which
 ${k}_B$,
 $T$ and
 $m$ represent the Boltzmann constant, room temperature and molecular weight of air.
By recalling the basics of the BT equation from Epps & Cushman-Roisin (Reference Epps and Cushman-Roisin2018), Samiee et al. (Reference Samiee, Akhavan-Safaei and Zayernouri2020a), we introduce the following quantities:  $L$ as the macroscopic length scale,
 $l_s$ as the microscopic characteristic length associated with the Kolmogorov length scale,
 $l_m$ as the average distance, travelled by a particle between successive collisions. Furthermore, we define
 $\boldsymbol {x}^{\prime }$ as the location of particles before scattering, where
 $\boldsymbol {x}$ is the current location. Thus,
 $\boldsymbol {x}^{\prime }=\boldsymbol {x}-(t-t^{\prime })\boldsymbol {u}$, where
 $\boldsymbol {u}$ is assumed to be constant during
 $t-t^{\prime }$. The analytical solution of (3.2) and (3.3) is given by
 \begin{align} f(t,\boldsymbol{x},\boldsymbol{u}) &= \int_{0}^{\infty} \textrm{e}^{{-}s}f^{eq}(t-s\tau,\boldsymbol{x}-s\tau \boldsymbol{u},\boldsymbol{u}) \, \textrm{d}s\nonumber\\ &=\int_{0}^{\infty} \textrm{e}^{{-}s} f^{eq}_{s,s}(\varDelta) \,\textrm{d}s, \end{align}
where  $s\equiv ({t-t^{\prime }})/{\tau }$ and
 $f^{eq}_{s,s}(\varDelta )=f^{eq}(t-s\tau,\boldsymbol {x}-s\tau \boldsymbol {u},\boldsymbol {u})$.
Remark 3.1 In order to develop an LES model within the kinetic transport framework, we constrain our attention to the BT equation with the BGK collision approximation, involving a single relaxation time. Moreover, we follow assumption 1 in Samiee et al. (Reference Samiee, Akhavan-Safaei and Zayernouri2020a, p. 4) in the further derivations to establish a physical connection between the collision operator and the convective terms at the continuum level.
In description of turbulence effects at the kinetic level, we decompose  $f$ into the filtered,
 $\bar {f}$, and residual values,
 $f'$, where
 $\bar {f}=G*f$. As defined previously,
 $G$ represents the kernel of any generic spatial isotropic filtering type. Then, the filtered kinetic transport for
 $\bar {f}$ suffices
 \begin{equation} \frac{\partial \bar{f}}{\partial t} + \boldsymbol{u}\boldsymbol{\cdot} \boldsymbol{\nabla} \bar{f} ={-} \frac{\bar{f}-\overline{f^{eq}(\varDelta)}}{\tau}, \end{equation}
in which  $u$ is independent of
 $t$ and
 $\boldsymbol {x}$. Ensuing (3.5), the analytical solution of (3.6) is described by
 \begin{equation} \bar{f} (t,\boldsymbol{x}, \boldsymbol{u}) =\int_{0}^{\infty} \textrm{e}^{{-}s} \, \overline{f^{eq}_{s,s}(\varDelta)}\, \textrm{d}s, \end{equation}
where  $\overline {f^{eq}_{s,s}(\varDelta )}=\overline {f^{eq}(\varDelta (t-s\tau,\boldsymbol {x}-s\tau \boldsymbol {u},\boldsymbol {u}) )}$. Let define
 $\bar {\varDelta }:={\vert \boldsymbol {u}-\bar {\boldsymbol {V}} \vert ^2}/{U^2}$. Due to the nonlinear character of the collision operator (Girimaji Reference Girimaji2007), the filtering operation does not commute with
 $\varOmega$, which yields the following inequality as
 \begin{equation} \overline{f^{eq}(\varDelta)} = \frac{\rho}{U^3} \, \overline{\textrm{e}^{-\varDelta/2}} \neq \frac{\rho}{U^3} \, \textrm{e}^{-\bar{\varDelta}/2}=f^{eq}(\bar{\varDelta}). \end{equation}
This inequality gives rise to the so-called turbulence closure problem at the kinetic level. From the mathematical standpoint, the SGS motions stem from the convective nonlinear terms in the NS equations, which resembles the corresponding advective term of the BT equation. Therefore, it seems natural to recognize  $\boldsymbol {u}\boldsymbol {\cdot } \boldsymbol {\nabla } f$ responsible for the unresolved turbulence effects in the BT equation, they manifest implicitly via the filtered collision operator though. That is, the filtered collision term on the right-hand side of (3.6) undertakes not only molecular collisions, but also the embedded SGS motions. By emphasizing on the importance of modelling
 $\overline {f^{eq}(\varDelta )}$ in the filtered collision operator, we review some different approaches in treating nonlinear effects.
Classical approaches. As a common practice in modelling the SGS closures, the attentions were directed toward with eddy-viscosity approximations by employing a modified relaxation time,  $\tau ^{\star }$, in the BT equation (e.g. Sagaut Reference Sagaut2010). Therefore, the proposed filtered BT equation reads as
 \begin{equation} \frac{\partial \bar{f}}{\partial t} + \boldsymbol{u}\boldsymbol{\cdot} \boldsymbol{\nabla} \bar{f} ={-} \frac{\bar{f}-f^{eq}(\bar{\varDelta})}{\tau^{{\star}}}. \end{equation}
In this approach, the inequality in (3.8) is disregarded through using  $\tau ^{\star }$, which renders the SGS model inappropriate for reproducing many features of the SGS motions. Nevertheless, there some non-eddy-viscosity models within the lattice Boltzmann framework, which make use of (3.8) to propose a more consistent SGS model. For more details, the reader is referred to Chen et al. (Reference Chen, Orszag, Staroselsky and Succi2004), Premnath et al. (Reference Premnath, Pattison and Banerjee2009) and Malaspinas & Sagaut (Reference Malaspinas and Sagaut2012).
Fractional approach. In the proposed framework in Samiee et al. (Reference Samiee, Akhavan-Safaei and Zayernouri2020a), the modelling of turbulence nonlinear effects begins with closing the filtered collision operator, where the multi-exponential behaviour of  $\overline {f^{eq}(\varDelta )}$ is approximated properly by a heavy-tailed distribution function. Therefore, the
 $\overline {f^{eq}(\varDelta )}$ in (3.6) is described by
 \begin{equation} \overline{f^{eq}(\varDelta)} - f^{eq}(\bar{\varDelta}) \simeq f^{\beta}(\bar{\varDelta}), \end{equation}
where  $f^{\beta }(\bar {\varDelta }) = ({\rho }/{U^3})F^{\beta }(\varDelta )$ and
 $F^{\beta }(\varDelta )$ denotes an isotropic Lévy
 $\beta$-stable distribution. By taking the first moment of (3.6), one derives the corresponding fractional Laplacian operator, termed as fractional SGS (FSGS) model, at the continuum level, where
 \begin{equation} (\boldsymbol{\nabla} \boldsymbol{\cdot} \boldsymbol{\mathsf{T}}^{R})=\mu_{\alpha} (-\varDelta)^{\alpha} \bar{\boldsymbol{V}}, \end{equation}
where  $\mu _{\alpha }=({\rho (U\tau )^{2\alpha }\varGamma (2\alpha +1)}/{\tau })\,({2^{2\alpha } \varGamma (\alpha +d/2)}/{{\rm \pi} ^{d/2} \varGamma (-\alpha )})\, {c}_{\alpha }$ for
 $\alpha \in (0,1)$ and
 ${c}_{\alpha }$ is a real-valued constant. In principle, the choice of distribution function in (3.10) gives rise to a non-local operator of the resolved flow field in (3.1) as an SGS model.
Despite the notable potentials of the FSGS model in maintaining some important physical and mathematical properties of the SGS stresses, it lacks a finite second-order statistical moment. To control this statistical barrier in the FSGS model and to achieve more congruence between both sides of (3.10), we seek a finite-variance alternative for the Lévy  $\beta$-stable distribution by employing the tempered counterpart and thereby a more flexible and predictive fractional operator in the LES equations in the following subsection.
3.3. Tempered fractional SGS modelling
Multi-exponential functions express a power-law behaviour in the moderate range of distribution and eventually relaxes into an exponential decay (see Evin et al. Reference Evin, Blanchet, Paquet, Garavaglia and Penot2016). By engaging more exponential terms to a multi-exponential function, the corresponding power-law behaviour extends toward long ranges; however, it is bound to vanish exponentially at the tail of the distribution, which is enforced by the nature of the physical phenomenon. As a rich class of stochastic functions for fitting into realistic phenomena, tempered stable distributions (Sabzikar et al. Reference Sabzikar, Meerschaert and Chen2015) resemble a shear power law at the moderate range and then converge to an exponential decay.
Inspired by this argument, we propose to model  $\overline {f^{eq}(\varDelta )}$ with a coefficient of tempered Lévy
 $\beta$-stable distribution, denoted by
 $f^{\beta, \lambda }(\bar {\varDelta })$, within the proposed fractional framework as
 \begin{equation} \overline{f^{eq}(\varDelta)} - f^{eq}(\bar{\varDelta}) \simeq f^{Model}(\bar{\varDelta}) = {c}_{\beta,\lambda}\, f^{\beta, \lambda}(\bar{\varDelta}), \end{equation}
where  ${c}_{\beta,\lambda }$ is a real-valued constant number. Moreover, we consider
 $\beta \in (-1-{d}/{2}, -{d}/{2})$,
 $\lambda >0$ and
 $d=3$ represents the dimension of the physical domain. Therefore, the filtered BT equation reads as
 \begin{align} \frac{\partial \bar{f}}{\partial t} + \boldsymbol{u}\boldsymbol{\cdot}\boldsymbol{\nabla} \bar{f} &={-}\frac{\bar{f}-f^{eq}(\bar{\varDelta})+f^{eq}(\bar{\varDelta})-\overline{f^{eq}(\varDelta)}}{\tau} \nonumber\\ &\simeq{-} \frac{\bar{f}-f^{eq}(\bar{\varDelta})-f^{Model}(\bar{\varDelta})}{\tau}. \end{align}
For the sake of simplicity, we take  $f^{*}(\bar {\varDelta }) = f^{eq}(\bar {\varDelta })+f^{Model}(\bar {\varDelta })$. The approximation in (3.13) conceivably provides a good fit into the filtered collision operator by maintaining the significant statistical features of
 $\overline {f^{eq}(\varDelta )}$ and sets a physically richer starting point for developing a more expressive non-local LES model at the continuum level. It should be noted that
 $\beta$ and
 $\lambda$ rely not only on the thermodynamic properties and boundary conditions, but also they are functions of the flow Reynolds number and the filter width,
 $\mathcal {L}$. In following sections we assume that the Reynolds number has a relatively constant value in the stationary turbulent flow to reduce fractional parameters as a function of
 $\mathcal {L}$.
In this regard, the macroscopic variables associated with the flow field can be reconstructed according to
 \begin{gather} \bar{\rho} = \int_{\mathbb{R}^d} \bar{f}(t,\boldsymbol{x},\boldsymbol{u}) \,\textrm{d}\boldsymbol{u}, \end{gather}
 \begin{gather}\bar{V}_i=\frac{1}{\rho} \int_{\mathbb{R}^d} u_i \, \bar{f}(t,\boldsymbol{x},\boldsymbol{u}) \,\textrm{d}\boldsymbol{u}, \quad i=1,2,3, \end{gather}
where  $\bar {\rho }=\rho$ for an incompressible flow. To establish the connection between the kinetic description and the filtered NS equation, we proceed with deriving the macroscopic form of (3.13) by multiplying it with
 $\boldsymbol {u}$, and integrating over the kinetic momentum, which yields
 \begin{equation} \int_{\mathbb{R}^d} \left(\boldsymbol{u} \frac{\partial \bar{f}}{\partial t} + \boldsymbol{\nabla} \boldsymbol{\cdot} (\boldsymbol{u}^2 \bar{f}) \right) \textrm{d}\boldsymbol{u} = 0 \quad \Longrightarrow \quad \rho \frac{\partial \bar{\boldsymbol{V}}}{\partial t} + \boldsymbol{\nabla} \boldsymbol{\cdot} \int_{\mathbb{R}^d} \boldsymbol{u}^2 \bar{f} \,\textrm{d}\boldsymbol{u} = 0. \end{equation}
Recalling the assumptions in remark 3.1 that  $\int _{\mathbb {R}^d} \boldsymbol {u} (({\bar {f}-f^{*}(\bar {\varDelta })})/{\tau } ) \,\textrm {d}\boldsymbol {u} = 0$ due to microscopic reversibility of particle collisions. Following the derivations in Samiee et al. (Reference Samiee, Akhavan-Safaei and Zayernouri2020a, pp. 5–6), we add and subtract
 $\bar {\boldsymbol {V}}\bar {\boldsymbol {V}}$ to the advection term and accordingly, (3.16) is found to be
 \begin{equation} \rho \left(\frac{\partial \bar{\boldsymbol{V}}}{\partial t} + \boldsymbol{\nabla}\boldsymbol{\cdot} \bar{\boldsymbol{V}} \bar{\boldsymbol{V}} \right) ={-}\boldsymbol{\nabla}\boldsymbol{\cdot} {\varsigma}, \end{equation}
where  ${\varsigma }$ in the index form is expressed as
 \begin{equation} {\varsigma}_{ij}=\int_{\mathbb{R}^d} (u_i-\bar{V}_i)(u_j-\bar{V}_j) \, \bar{f} \, \textrm{d}\boldsymbol{u}. \end{equation}
Comparing (3.1) and (3.17), it turns out that the pressure term, viscous and SGS stresses all trace back to  $\boldsymbol {\nabla }\boldsymbol {\cdot } {\varsigma }$, where
 ${\varsigma }_{ij}=-\bar {p} \, \delta _{ij}+\boldsymbol{\mathsf{T}}^{shear}_{ij}+\boldsymbol{\mathsf{T}}^{\mathcal {R}}_{ij}$. By plugging (3.7) into the kinetic definitions of each term in
 ${\varsigma }_{ij}$, we obtain
 \begin{gather} \bar{p} \, \delta_{ij} ={-}\int_{\mathbb{R}^d} (u_i-\bar{V}_i)(u_j-\bar{V}_j) \, f^{*}(\bar{\varDelta}) \, \textrm{d}\boldsymbol{u} \int_{0}^{\infty} \textrm{e}^{{-}s} \,\textrm{d}s, \end{gather}
 \begin{gather}\boldsymbol{\mathsf{T}}_{ij}^{shear} = \int_{0}^{\infty} \int_{\mathbb{R}^d} (u_i-\bar{V}_i)(u_j-\bar{V}_j) \times \left(f^{eq}_{s,s}(\bar{\varDelta})-f^{eq}(\bar{\varDelta})\right) \textrm{e}^{{-}s} \,\textrm{d}\boldsymbol{u}\, \textrm{d}s = 2 \mu \bar{\boldsymbol{\mathsf{S}}}_{ij}, \end{gather}
where  $\mu =\rho U^2\tau$. Similarly, by employing
 $f^{Model}$ in (3.12), we attain
 \begin{align} \boldsymbol{\mathsf{T}}_{ij}^{R} &={c}_{\beta,\lambda}\, \int_{0}^{\infty} \int_{\mathbb{R}^d} (u_i-\bar{V}_i)(u_j-\bar{V}_j) \left(f^{\beta,\lambda}_{s,s}(\bar{\varDelta})-f^{\beta,\lambda}(\bar{\varDelta})\right) \textrm{e}^{{-}s} \,\textrm{d}\boldsymbol{u}\, \textrm{d}s \nonumber\\ &=\frac{\rho {c}_{\beta,\lambda}}{U^3} \int_{0}^{\infty} \int_{\mathbb{R}^d} (u_i-\bar{V}_i)(u_j-\bar{V}_j) \left(F^{\beta,\lambda}(\bar{\varDelta}_{s,s})-F^{\beta,\lambda}(\bar{\varDelta})\right) \textrm{e}^{{-}s} \,\textrm{d}\boldsymbol{u}\, \textrm{d}s, \end{align}
in which  $\bar {\varDelta }_{s,s} = \bar {\varDelta }(t-s\tau,\boldsymbol {x}-s\tau \boldsymbol {u}, \boldsymbol {u})$. As discussed in Samiee et al. (Reference Samiee, Akhavan-Safaei and Zayernouri2020a, appendix), the temporal shift can be detached from
 $f^{\beta,\lambda }_{s,s}(\bar {\varDelta })$ and then
 $\bar {\varDelta }_{s,s}$ is simplified to
 $\bar {\varDelta }_s = \bar {\varDelta }(t,\boldsymbol {x}-s\tau \boldsymbol {u}, \boldsymbol {u})$. Therefore,
 \begin{equation} \boldsymbol{\mathsf{T}}_{ij}^{R} = \frac{\rho {c}_{\beta,\lambda}}{U^3} \int_{0}^{\infty} \int_{\mathbb{R}^d} (u_i-\bar{V}_i)(u_j-\bar{V}_j) \left(F^{\beta,\lambda}(\bar{\varDelta}_{s})-F^{\beta,\lambda}(\bar{\varDelta})\right) \textrm{e}^{{-}s} \,\textrm{d}\boldsymbol{u}\, \textrm{d}s. \end{equation}
The strategy to evaluate  $\boldsymbol{\mathsf{T}}_{ij}^{R}$ is to decouple the particle speed into time and displacement by employing
 $\boldsymbol {u}=({\boldsymbol {x}^{\prime }-\boldsymbol {x}})/{s\tau }$ and approximate the asymptotic behaviour of
 $F^{\beta,\lambda }(\bar {\varDelta })$ with a tempered power-law distribution. In a detailed discussion in Appendix B, we show that
 \begin{equation} \boldsymbol{\mathsf{T}}_{ij}^{R} = {c}_{\alpha,\lambda} \, \bar{\nu}_{\alpha} \sum_{k=0}^{\mathcal{K}} \bar{\phi}_{k}^{\mathcal{K}}(\alpha) \int_{\mathbb{R}^d} (x_i -x_i^{\prime}) \, (x_j -x_j^{\prime}) \frac{(\boldsymbol{x} -\boldsymbol{x}^{\prime})\boldsymbol{\cdot} (\bar{\boldsymbol{V}}- \bar{\boldsymbol{V}}^{\prime} ) }{\vert \boldsymbol{x} -\boldsymbol{x}^{\prime}\vert^{2\alpha+5} \, \textrm{e}^{\bar{\lambda}_k \vert \boldsymbol{x} -\boldsymbol{x}^{\prime} \vert}} \textrm{d}\kern0.06em\boldsymbol{x}^{\prime}, \end{equation}
in which  $\bar {\nu }_{\alpha } = (2\alpha +3) (\rho C_{\alpha } \tau ^{2\alpha -1} U^{2\alpha })$ for
 $\alpha \in (0,\frac {1}{2})\cup (\frac {1}{2},1)$ and recalling
 $\bar {\lambda }_k = ({k}/{\tau U})\lambda$. Moreover,
 $\bar {\phi }_{k}^{\mathcal {K}}(\alpha )$ is indicated in (B9). Eventually, we disclose the integral form of
 $\boldsymbol {\nabla }\boldsymbol {\cdot } \boldsymbol{\mathsf{T}}^{\mathcal {R}}$ as
 \begin{equation} (\boldsymbol{\nabla}\boldsymbol{\cdot} \boldsymbol{\mathsf{T}}^{\mathcal{R}})_j = {c}_{\alpha,\lambda} \, \bar{\nu}_{\alpha} \sum_{k=0}^{\mathcal{K}} \frac{(2\alpha+\bar{\lambda}_k)}{(2\alpha+3)} \bar{\phi}_{k}^{\mathcal{K}}(\alpha) \int_{\mathbb{R}^d} \frac{(\bar{V}_j -\bar{V}_j^{\prime}) }{\vert \boldsymbol{x} -\boldsymbol{x}^{\prime}\vert^{2\alpha+3} \, \textrm{e}^{\bar{\lambda}_k \vert \boldsymbol{x} -\boldsymbol{x}^{\prime} \vert}} \textrm{d}\kern0.06em\boldsymbol{x}^{\prime}, \end{equation}
where  $\nu _{\alpha } = {c}_{\alpha,\lambda } \bar {\nu }_{\alpha }$. Recalling the integral representation of a tempered fractional Laplacian in (2.8), we formulate the divergence of the SGS stresses as
 \begin{equation} (\boldsymbol{\nabla}\boldsymbol{\cdot} \boldsymbol{\mathsf{T}}^{\mathcal{R}})_j = \nu_{\alpha} \sum_{k=0}^{\mathcal{K}} \phi_{k}^{\mathcal{K}}(\alpha,\lambda) (\varDelta+\bar{\lambda}_k)^{\alpha} \bar{V}_j, \end{equation}
where  $\phi _{k}^{\mathcal {K}}(\alpha,\lambda ) = ({(2\alpha +\bar {\lambda }_k)}/{(2\alpha +3)})\bar {\phi }_{k}^{\mathcal {K}}(\alpha )$. Evidently, by setting
 $\mathcal {K} = 0$, we find that
 $\bar {\phi }_{k}^{\mathcal {K}}(\alpha )=\varGamma (2\alpha )$ and the new operator in (3.25) reduces to a fractional Laplacian, which recovers the FSGS model.
Remark 3.2 In terms of the explicit Fourier form of the tempered operator,  $(\varDelta +\bar {\lambda })^{\alpha }(\cdot )$, the TFSGS model maintains the high-order accuracy of scheme in LES solutions similar to the eddy-viscosity models without including any computational cost.
Inferring from (3.25), our choice in the kinetic description of turbulent effects reflects in the form of a tempered fractional operator through a rigorous connection between the filtered BT and the filtered NS equations. More specifically, we adopt  $\mathcal {K} = 1$ and, hence, the TFSGS model can be formulated as
 \begin{equation} \boldsymbol{\nabla}\boldsymbol{\cdot} \boldsymbol{\mathsf{T}}^{\mathcal{R}} = \nu_{\alpha} \left[ \phi_{0}^{1}(\alpha)\left(- (-\varDelta)^{\alpha} \right) \bar{\boldsymbol{V}} + \phi_{1}^{1}(\alpha)\left(\varDelta+\bar{\lambda}_1 \right)^{\alpha} \bar{\boldsymbol{V}} \right], \end{equation}
where  $\phi _{0}^{1}(\alpha ) = ({1}/{(2\alpha +3)}) ( \varGamma (2\alpha +1)-\varGamma (2\alpha ) )$ and
 $\phi _{1}^{1}(\alpha,\lambda ) = ({(2\alpha +\lambda )}/{(2\alpha +3)} ) \varGamma (2\alpha -1)$. Accordingly, the governing LES equations read as
 \begin{equation} \frac{\partial \bar{V}_i}{\partial t}+\frac{\partial \bar{V}_i\,\bar{V}_j}{\partial x_j}={-}\frac{1}{\rho}\frac{\partial \bar{p}}{\partial x_i}+\nu \, \varDelta \bar{V}_i -\nu_{\alpha} \sum_{k=0}^{1} \phi_{k}^{1}(\alpha,\lambda) (\varDelta+\bar{\lambda}_k)^{\alpha} \, \bar{V}_i, \end{equation}
where  $\alpha \in (0,\frac {1}{2})\cup (\frac {1}{2},1)$,
 $\lambda >0$ and
 $\nu _{\alpha } = {\mu _{\alpha }}/{\rho }$.
Remark 3.3 As a generator of tempered Lévy-stable processes, the tempered fractional Laplacian is proven to be rotationally and Galilean invariant (see Huang Reference Huang2015; Kaleta & Sztonyk Reference Kaleta and Sztonyk2015; Cairoli Reference Cairoli2016). Therefore, by having  $\nu _{\alpha }$ and
 $\phi _{k}^{1}$ as real-valued functions of
 $\alpha$ and
 $\lambda$, the TFSGS model also adopts the frame invariance property in a consistent fashion with the SGS stresses.
3.4. TFSGS formulations for the SGS stresses
To study the key role of tempering fractional operators in recovering turbulent statistical structures, it is essential to establish a straightforward form of the modelled SGS stresses. Due to some numerical complications in evaluating the integral in (3.24), we settle to proceed with the Fourier representation of the TFSGS model. Employing the definition of  $\mathcal {I}^{\alpha }$ (
 $\alpha$-Riesz potential) from Stein (Reference Stein1970), it is possible to verify that
 \begin{equation} \boldsymbol{\nabla}\boldsymbol{\cdot} \boldsymbol{\mathsf{T}}^R = (\varDelta+\lambda)^{\alpha} \boldsymbol{\bar{V}} = \boldsymbol{\nabla\cdot\nabla} \mathcal{I}^{\alpha = 1}\left[ \nu_{\alpha} \sum_{k=0}^{1} \phi_{k}^{1}(\alpha,\lambda) (\varDelta+\bar{\lambda}_k)^{\alpha} \boldsymbol{\bar{V}} \right]. \end{equation}
Inspired by (3.28), we introduce  $\mathcal {R}_j^{\alpha,\lambda } (\boldsymbol {\cdot }) = \boldsymbol {\nabla }_j \mathcal {I}^{\alpha =1} (\varDelta +\lambda )^{\alpha } (\boldsymbol {\cdot })$ as a tempered fractional operator such that
 \begin{equation} \boldsymbol{\mathsf{T}}^R_{ij} = \frac{\nu_{\alpha}}{2}\sum_{k=0}^{1} \phi_{k}^{1}(\alpha,\lambda) \left[ \mathcal{R}_j^{\alpha,\bar{\lambda}_k} \bar{V}_i + \mathcal{R}_i^{\alpha,\bar{\lambda}_k} \bar{V}_j \right], \end{equation}
where  $\mathcal {F} [ I^{\alpha =1} ] = {1}/{\xi ^2}$ and
 $\mathcal {F} [ \boldsymbol {\nabla }_j ] (\boldsymbol {\xi }) = - \mathfrak {i} \, \xi _j$ and
 $\mathfrak {i}$ denotes an imaginary unite. Following (2.10) into (3.29), we find the Fourier form of
 $\mathcal {R}_j^{\alpha,\lambda }$ as
 \begin{equation} \mathcal{F} \left[ \mathcal{R}_j^{\alpha,\lambda} \right] (\boldsymbol{\xi}) = \mathfrak{C}_{\alpha} \frac{ - \mathfrak{i} \, \xi_j}{\xi^2} \left( \lambda^{2\alpha} - (\lambda^2+\xi^2)^{\alpha} \,{}_{2}{F}^{}_{1}\left(-\alpha, 1+\alpha;\frac{3}{2};\frac{\xi^2}{\xi^2+\lambda^2}\right) \right). \end{equation}
4. Statistical analysis
In pursuit of an ideal SGS model, nonlinearity induced by the convective terms and non-locality imparted by the pressure term in the NS equations contribute to a synthetic hierarchy of transport equations and multi-point descriptions of SGS terms, as shown in Sagaut & Cambon (Reference Sagaut and Cambon2008). The infinitely extended hierarchical triangle of nonlinearity and non-locality brings up the idea of indicating a set of weaker, and yet significant, statistical conditions and makes the ideal LES model more attainable, as endorsed by Moser et al. (Reference Moser, Haering and Yalla2021). To identify such statistical features, Meneveau (Reference Meneveau1994) developed a rigorous framework via a statistical a priori analysis and formulated some sufficient conditions for the assessment of LES models. As one of the candidates for evaluating SGS models, we give a brief review of the argued formulations in Meneveau (Reference Meneveau1994) and introduce an optimization strategy, which enables the TFSGS model to correctly generate the requisite statistical conditions.
Hereafter, we consider the following notations in study of the SGS fields. Let  $\boldsymbol{\mathsf{T}}^{R,D}$ and
 $\boldsymbol{\mathsf{T}}^{R,*}$ denote the SGS stresses, implied by the true DNS data and the SGS model, respectively. We also take
 $\boldsymbol {r}$ as the displacement vector between two points in the correlation functions Then,
 $r = \vert \boldsymbol {r} \vert$. As discussed in Meneveau (Reference Meneveau1994), performing an ensemble average of the filtered NS equations offers a set of necessary conditions for an LES simulation to ensure the equality of mean velocity profiles and the second-order moments, listed as
(a)
 $\langle \boldsymbol{\mathsf{T}}^{R,D}_{ij}\rangle = \langle \boldsymbol{\mathsf{T}}^{R,*}_{ij}\rangle$,
(b)
$\langle \bar {V}_i \boldsymbol{\mathsf{T}}^{R,D}_{ij}\rangle =\langle \bar {V}_i \boldsymbol{\mathsf{T}}^{R,*}_{ij}\rangle$,(c)
$\langle \bar {\boldsymbol{\mathsf{S}}}_{ij} \boldsymbol{\mathsf{T}}^{R,D}_{ij}\rangle = \langle \bar {\boldsymbol{\mathsf{S}}}_{ij} \boldsymbol{\mathsf{T}}^{R,*}_{ij}\rangle$,


in which conditions (b) and (c) are inferred from the ensemble-averaged SGS transport equation.
Focusing on the non-locality axis of the closure triangle for a homogeneous isotropic turbulent (HIT) flow, one obtains the so-called KH equation as
 \begin{equation} \left[ \frac{\partial}{\partial t}-2\nu \left(\frac{\partial^2}{\partial r^2} + \frac{4}{r}\frac{\partial}{\partial r}\right) \right] B_{LL}(r,t) - \left(\frac{\partial}{\partial r} + \frac{4}{r}\right) B_{LLL}(r,t) = \left(\frac{\partial}{\partial r} + \frac{4}{r}\right) G_{LLL}(r,t) \end{equation}
for sufficiently large  $\mathcal {L}\gg \eta$, where
 $L$ represents the longitudinal direction. Additionally, we denote by
 $B_{LL}(r,t)=\langle \bar {V}_L(\boldsymbol {x},t) \, \bar {V}_L(\boldsymbol {x}+\boldsymbol {r},t) \rangle$ and
 $B_{LLL}(r,t)=\langle [\bar {V}_L(\boldsymbol {x},t)]^2 \bar {V}_L(\boldsymbol {x}+\boldsymbol {r},t) \rangle$ the second- and third-order velocity correlation functions, respectively, and
 $G_{LLL}(r,t)=\langle \boldsymbol{\mathsf{T}}^{R}_{LL}(\boldsymbol {x},t) \bar {V}_L(\boldsymbol {x}+\boldsymbol {r},t) \rangle$ refers to the stress–strain correlation function. Technically, the third-order correlation function in (4.1) is subdivided into
 $B_{LLL}$ stemming from the resolved velocity field and
 $G_{LLL}(r,t)$ coming from the SGS stresses. It turns out from (4.1) that the SGS model should undergo a correct prediction of
 $G_{LLL}(r,t)$ to regenerate
 $B_{LL}$ and
 $B_{LLL}$ accurately. Referring to Meneveau (Reference Meneveau1994, pp. 819–820), we arrive at the equation
 \begin{equation} \left\langle [\bar{V}_L(\boldsymbol{x}+\boldsymbol{r},t)-\bar{V}_L(\boldsymbol{x},t)]^3 \right\rangle + 6\, G_{LLL}(r,t) = 6 \left\langle\bar{\boldsymbol{\mathsf{S}}}_{LL} \boldsymbol{\mathsf{T}}^{R}_{LL} \right\rangle r, \end{equation}
which exhibits the only sufficient condition for modelling third-order structure in a HIT flow. Therefore, by satisfying the equality of SGS dissipation via conditions (c), modelling  $G_{LLL}$ remains the only requisite for capturing the third-order structure functions.
This finding reveals the significance of condition (c), which intrinsically ties with the stress–strain correlation function, represented by  $D_{LL}(r,t) = \langle \bar {\boldsymbol{\mathsf{S}}}_{LL}(\boldsymbol {x}+\boldsymbol {r}\boldsymbol {\cdot } \boldsymbol {e},t) \boldsymbol{\mathsf{T}}^{R}_{LL} \rangle$. Using the conversation in Cerutti et al. (Reference Cerutti, Meneveau and Knio2000, p. 317),
 $D_{LL}$ is derived in terms of
 $G_{LLL}$ as
 \begin{equation} D_{LL}(r,t) = \frac{7}{2} \frac{\textrm{d}G_{LLL}(r,t)}{\textrm{d}r}+\frac{4 G_{LLL}(r,t)}{r}+\frac{r}{2}\frac{\textrm{d}^2 G_{LLL}(r,t)}{\textrm{d}r^2}. \end{equation}
Emphasizing the role of tempering parameter in modulating the turbulent dissipation range, we therefore adopt  $D_{LL}(r,t)$ as a key quantity in optimizing the TFSGS model to address condition (c) and capture the non-local structures in (4.2). It must be noted that in evaluating the aforementioned conditions and high-order structures,
 $\boldsymbol{\mathsf{T}}^{R}$ represents either
 $\boldsymbol{\mathsf{T}}^{R,D}$, obtained by filtering the instant DNS database, or
 $\boldsymbol{\mathsf{T}}^{R,*}$, implied by implementing any model to the true resolved velocity field.
4.1. Optimization strategy
Devising a robust optimization framework is an inevitable element in predictive fractional and tempered fractional modellings (see Burkovska et al. Reference Burkovska, Glusa and D'Elia2020; Pang et al. Reference Pang, D'Elia, Parks and Karniadakis2020). Regarding the given set of conditions for the closure problem, we find conditions (a) and (c) practically crucial in developing an approach for estimating the parameters and coefficient associated with the TFSGS model while condition (b) can be substantially recovered by imposing (4.2), where  $G_{LLL}(r,t)\vert _{r=0}=\langle \bar {V}_i \boldsymbol{\mathsf{T}}^{R}_{ij}\rangle$. As we learn from the one-point correlation analysis in Samiee et al. (Reference Samiee, Akhavan-Safaei and Zayernouri2020a) and the following section, correlations between the SGS stresses, obtained by the DNS data and the model, highly rely on
 $\alpha$ and
 $\lambda$ in the TFSGS model rather than playing a central role in capturing the SGS dissipation energy and non-local structure functions. This approach provides the basis for an optimal estimation of the fractional exponents (
 $\alpha$ and
 $\lambda$) by employing the normalized
 $D_{LL}$ and
 $\varrho _{i}$, defined in algorithm .
Estimation of the optimal model parameters for a specific  $\mathcal {L}$

By fixing the values of fractional exponents, it is possible to accurately quantify the model coefficient and thereby reproduce the third-order structure in (4.2) via modelling  $G_{LLL}$. In algorithm we schematically present the proposed method for optimizing the parameters associated with the TFSGS model at a given flow Reynolds number (Re) and a specific filter width,
 $\mathcal {L}$.
It must be noted that in step 3, we define
 \begin{equation} \boldsymbol{\mathsf{T}}^{R,N}_{ij}= \frac{\boldsymbol{\mathsf{T}}^{R,TF}_{ij}}{\mathrm{c}_{\alpha,\lambda} }=\frac{\bar{\nu}_{\alpha}}{2}\sum_{k=0}^{1} \phi_{k}^{1}(\alpha,\lambda) \left[ \mathcal{R}_j^{\alpha,\bar{\lambda}_k} \bar{V}_i + \mathcal{R}_i^{\alpha,\bar{\lambda}_k} \bar{V}_j \right]. \end{equation}
Moreover, superscripts ‘ $D$’ and ‘
 $TF$’ represent the values obtained by filtering the true DNS data and the TFSGS model, respectively.
5. A priori/posteriori analyses
To attain the optimal behaviour of the TFSGS model, we follow the steps in algorithm by performing an a priori analysis and evaluate the capabilities of the TFSGS model in generating the statistical features of turbulent flows.
5.1. Direct numerical simulation database and LES platform
In terms of a priori tests, we conduct the numerical simulation of a forced HIT flow employing the open-source pseudo-spectral NS solver for a triply periodic domain, the code of which is presented at Akhavan-Safaei & Zayernouri (Reference Akhavan-Safaei and Zayernouri2020) and the references therein (e.g. Mortensen & Langtangen Reference Mortensen and Langtangen2016). It should be noted that in the next section, the LES solver is successfully prepared using this DNS code and the statistically stationary DNS dataset presented here is filtered and used as the initial conditions for the final a posteriori assessments.
Using the NS solver, we performed DNS of a stationary HIT flow with  $320^3$ resolution for a periodic computation domain as
 $\varOmega =[0,2{\rm \pi} ]^3$ and the large-scale forcing occurs at
 $0 < \vert \boldsymbol {\xi } \vert \leqslant 2$ to maintain turbulence statistics stationary. Here,
 $\boldsymbol {\xi }$ represents the vector of Fourier wave numbers and
 $\xi _{max}=\sqrt {2}\,N/3$ is the maximum wave number solved numerically, where
 $N=320$ is the number of grid points. In this case,
 $\xi _{max}\,\eta _{k}=1.6>1$ certifies that all the scales of motion are well resolved, where
 $\eta _{k}$ refers to the Kolmogorov length scale. We detail the flow parameters and some of the statistical properties in table 1, in which
 $\varepsilon$ and
 $E_{tot}$ denote the expected values of dissipation rate and turbulent kinetic energy, respectively. Moreover,
 $Re_{\lambda }=\frac {u^\prime _{rms} \, l_{\lambda }}{\nu }$ and
 $l_{\lambda }=\sqrt {15 \nu \, {u'}_{rms}^2/\varepsilon }$ represent the Taylor Reynolds number and micro-scale length, respectively, where
 $u'_{rms}=\sqrt {2E_{tot}/3}$. The simulation undergoes running for
 $30$ eddy turnover times,
 $\tau _{\mathscr {L}}$, to construct
 $40$ sample snapshots as our database. Due to the present homogeneity and isotropy in the HIT flow, we find the database adequate for obtaining the required statistics in the further analysis. The kurtosis and skewness values of the diagonal components of velocity gradient tensor are also presented in table 1, supporting non-Gaussianity of turbulent structures.
Flow parameters and statistical properties in the DNS of a forced HIT flow.

For the purpose of crunching a heavy DNS database in the statistical analysis, we develop an LES platform in Python with a focus on efficiency in obtaining two-point correlations and the ease of dealing with the fractional operators. This platform consists of three chief components: filtering the DNS database, implementation of LES models and optimization, and executing the final analysis. To overcome the burden of a timely filtering process especially in two-point correlation analysis, we introduce the scalable multi-threaded filtering code using Numpy, threading and astropy.convolution packages. Further steps in finding the optimum model parameters and applying the Fourier form of the fractional models are developed by employing the highly efficient Intel® MKL library. For more information, the reader is referred to Samiee (Reference Samiee2021).
5.2. Optimal estimation of fractional parameters
In order to optimize the efficiency of the TFSGS model, we developed a flexible and rigorous strategy in algorithm . The proposed algorithm is equipped with verification and validation mechanisms through the conventional correlation coefficients and two-point structure functions. Recalling from § 4.1 that  $\boldsymbol{\mathsf{T}}^{R,D}_{ij}$ denotes the true SGS stresses obtained by filtering the well-resolved DNS data. Moreover,
 $\boldsymbol{\mathsf{T}}^{R,*}_{ij}$ represents the general form of modelled SGS values, where
 $*$ can be replaced by
 $TF$ or
 $SM$ in the TFSGS or SMG models, respectively.
The first step in algorithm concerns detecting the optimum value of the fractional exponent,  $\alpha ^{opt}$, where the maximum of ensemble-averaged correlation between
 $\boldsymbol{\mathsf{T}}^{R,D}_{ii}$ and
 $\boldsymbol{\mathsf{T}}^{R,TF}_{ii}$, denoted by
 $\varrho _{ii}$, occurs. Endorsed by the results of table 2, the tempering parameter,
 $\lambda$, appears not to make any noticeable change in
 $\varrho _{ii}$, namely less than 3%. Therefore, we plot the variations of
 $\varrho _{ii}$ vs
 $\alpha ^{opt}$ in figure 1 for
 $i=1,2,3$ in the absence of
 $\lambda$, where each dashed box specifies the interval of
 $\alpha$ yielding the maximum of
 $\varrho _{ii}$. Without any loss of accuracy, we adopt
 $\alpha ^{opt}=0.76$, 0.58, 0.51 as the corresponding minimum value in each specified interval for
 $\mathcal {L}_{\delta }= {\mathcal {L}}/{2 \delta x}=4,\,8,\,12$, respectively, where
 $\delta x={2{\rm \pi} }/{N}$ represents the computational grid size.
Variation of the correlation coefficients (a)  $\varrho _{11}$, (b)
 $\varrho _{22}$ and (c)
 $\varrho _{33}$ vs
 $\alpha \in (0,1)$ for
 $\mathcal {L}_{\delta }=4,\,8,\,12$ by setting
 $\lambda \simeq 0$ in (4.4). The maximum values lie in the dashed boxes.

The ensemble-averaged correlation coefficients ( $\varrho _{ii}$) between SGS stresses obtained by the filtered DNS data (
 $\boldsymbol{\mathsf{T}}^{R,D}_{ii}$) and the TFSGS model (
 $\boldsymbol{\mathsf{T}}^{R,TF}_{ii}$) for
 $i=1,2,3$. In the fractional models,
 $\alpha ^{opt}$ is set as
 $0.76$,
 $0.58$ and
 $0.51$ for
 $\mathcal {L}_{\delta }=4,\,8,\,12,$ respectively.

From the kinetic perspective, enlarging  $\mathcal {L}_{\delta }$,
 $\overline {f^{eq}(\varDelta )}$ in (3.6) demonstrates an increasingly multi-exponential pattern, which can be better described by a power-law distribution function. This argument accounts for the prediction enhancement in figure 1, achieved by the TFSGS model and the abduct reduction of
 $\alpha ^{opt}$ vs
 $\mathcal {L}_{\delta }$ (see Samiee et al. Reference Samiee, Akhavan-Safaei and Zayernouri2020a, p. 10). Theoretically, the tempered power-law distribution can resemble a power-law or a Gaussian distribution by letting
 $\lambda$ go to
 $0$ or
 $\infty$, respectively. This allows the TFSGS model to span the gap between the FSGS model, representing self-similar behaviour of the inertial range, and the SMG model, renowned for its dissipative characteristics. The results in table 2 support this line of reasoning by a row of correlation quantities for the given filter widths, particularly at
 $\mathcal {L}_{\delta }=12$.
On this background, we proceed with the second step in algorithm to indicate  $\lambda ^{opt}$ through a comparative study of the normalized stress–strain correlation function, defined as
 $S_{\varDelta } = {D_{LL}(r,t)}/{D_{LL}(0,t)}$. With the knowledge of
 $D_{LL}(r,t)$, we extend the two-point correlation analysis to the spectral space by evaluating the instantaneous radial dissipation spectrum, given by
 $\hat {\mathcal {D}}(\xi )=\mathcal {F} {[}D_{LL}(r,t) {]}(\xi )$. To evaluate the error between the dissipation spectrum, obtained by the true DNS data and the LES models at high wave numbers, we define
 \begin{equation} \mathcal{E}_{H} = \frac{\left\vert \left[ \hat{\mathcal{D}}(\xi)\right]^{*} - \left[\hat{\mathcal{D}}(\xi)\right]^{D}\right\vert}{\left\vert \left[ \hat{\mathcal{D}}(\xi)\right]^{D} \right\vert}, \end{equation}
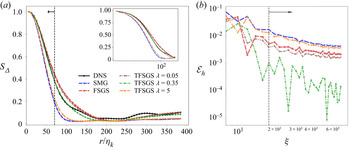
where  ${\vert } \cdot {\vert }$ represents the norm of the vector. Figure 2(a) displays
 $S_{\varDelta }$ vs the spatial shift,
 $r$, for a logarithmic sequence of
 $\lambda$ spanning three orders of magnitude in the TFSGS model, where
 $\mathcal {L}_{\delta }=8$. As stated earlier, the proposed model can take a journey from the FSGS to the SMG models by tuning
 $\lambda$. Evidently, the true quantities of
 $S_{\varDelta }$, coloured black, are well predicted by the proposed model with
 $\lambda ^{opt}=0.45$, where
 $\alpha ^{opt}=0.58$ is fixed. Figure 2(b) confirms our findings quantitatively in a plot of
 $\mathcal {E}_{H}$ vs radius of wave numbers,
 $\xi$, with log-scale axes. In fact, this plot implies accuracy of the TFSGS model in capturing the two-point structure function at the dissipation range, as pointed by an arrow.
(a) Comparing results of the normalized two-point stress–strain rate correlation functions ( $S_{\varDelta }$) and (b) error analysis of the longitudinal dissipation spectrum (
 $\mathcal {E}_{H}$) for FSGS and SMG models, where
 $\mathcal {L}_{\delta }=8$ and
 $\xi$ represents the radius of Fourier wave numbers. In both plots, the arrows point to the dissipation range.

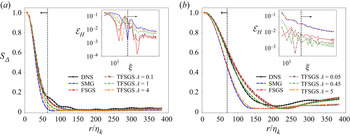
Employing the same analysis for  $\mathcal {L}_{\delta }=4, \, 12,$ we infer the optimal behaviour of the TFSGS model, evaluated for a logarithmic range of
 $\lambda$ with a fixed
 $\alpha ^{opt}$, in figure 3. The inset plots show
 $\mathcal {E}_{H}$ vs
 $\xi$ using log-scale on both axes to magnify the dissipation range at high wave numbers. Interestingly, at
 $\mathcal {L}_{\delta }=4$ the FSGS model is dissipative enough to outperform the tempered model in capturing the true
 $S_{\varDelta }$ in figure 3(a). With all this in mind, these results certify the importance of tempering in correct regeneration of two-point correlation functions particularly at larger filter widths (
 $\mathcal {L}_{\delta }=8, \, 12$). Moreover, the SMG model, resembling the TFSGS with
 $\lambda \sim 5$, exhibits a relatively steeper slope at the dissipation range, which is rooted in the diffusive form of its operator. In this context, tempering plays a crucial role in characterizing dissipation structures covering the widening gaps between the asymptotic cases (
 $\lambda = 0.01$ and
 $5$) in figure 3(b). This brings up the TFSGS model as a superior physics-based model in comparison with its counterparts, i.e. the SMG and FSGS models.
Comparing results of the normalized two-point stress–strain rate correlation functions for (a)  $\mathcal {L}_{\delta }=4$ and (b)
 $\mathcal {L}_{\delta }=12$. The inset plots illustrate the normalized error of longitudinal dissipation spectrum (
 $\mathcal {E}_{H}$) vs the radius of Fourier wave numbers (
 $\xi$). The arrows point to the dissipation range.

Given the values of  $\alpha ^{opt}$ and
 $\lambda ^{opt}$, we proceed lastly with quantifying
 ${c}_{\alpha,\lambda }$ as prescribed in algorithm . Under statistically stationary circumstances of the flow field,
 ${c}_{\alpha,\lambda }$ remains fairly unchanged for each
 $\mathcal {L}_{\delta }$ of interest, as reported in table 3. It should be noted that
 ${c}_{\alpha,\lambda }$ is part of the fractional coefficient, described in (4.4), to scale up the model in a constant
 $Re_{\lambda }$ and
 $\mathcal {L}_{\delta }$.
Optimized parameters associated with the TFSGS model in terms of algorithm for differing filter widths.

5.3. Interpretation of two-point structure functions
The third-order structure functions, arising from the KH equations, provide insights about the statistics of unresolved scales and their strong interactions with large-scale motions. As discussed previously in § 4,  $G_{\varDelta } = {G_{LLL}}/{\epsilon \mathcal {L}}$, representing the scaled two-point velocity-stress correlation function, is introduced as a sufficient condition for precise regeneration of third-order structure functions and an a priori consistency in LES modelling. Following the derivation of the longitudinal Taylor macroscale in Pope (Reference Pope2000, chap. 6),
 $D_{LL}(r)$ seems to be directly connected to the first-order derivative of
 $G_{LLL}(r)$ at the dissipation range. This offers the capability of the optimum edition of the TFSGS model in capturing
 $G_{\varDelta }$ and thereby fulfilling the essential conditions in (4.2).
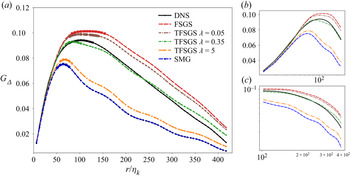
In the first stage of the statistical analysis, we perform a comprehensive study on  $G_{\varDelta }$ in figure 4(a) for
 $\mathcal {L}_{\delta } = 8$, in which the dissipation and inertial ranges are magnified in figure 4(b) with a semi-logarithmic scale on the
 $x$-axis and figure 4(c) with logarithmic scales on both axes, respectively. The balance regions (BR), including extremum points, are thickened up in all the graphs in figure 4(a). Balance regions also indicate the transitional zone between dissipation and inertial ranges. Aligned with the right side of (4.2), the trend of
 $G_{\varDelta }$ at small-scale interactions appear to be a linear function of spatial displacement,
 $r$, suggested by Meneveau (Reference Meneveau1994, figure 2). The results in figure 4(a) and more accurately in figure 4(b) offer that the optimum TFSGS model well predicts the true DNS quantities at the left side of the BR, not only the slope of
 $G_{\varDelta }$ but also the maximum of
 $G_{\varDelta }$ occurring at a relatively close
 $r$. This spotlights the importance of step three of algorithm in tuning the slope of
 $G_{\varDelta }$ at the dissipation range and the effective role of the tempering parameter in fitting the BR, associated with the filtered DNS data. In practice, increasing
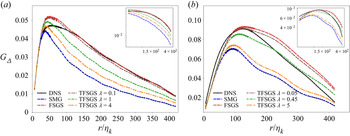
 $\lambda$ pushes the BR toward the left side to preserve the increasing linear correlation as a notion of more dissipative behaviour. These findings are endorsed qualitatively for the other filter widths in figure 5, considering
 $\lambda ^{opt}$ in table 3.
Two-point velocity-stress correlation function in a stationary HIT flow for  $\mathcal {L}_{\delta }=8$ using box filtering. The segment of the balance region (BR) has been thickened up in (a) for all the graphs. The dissipation and the inertial ranges have been enlarged in plots (b) with semi-logarithmic scale on the
 $x$-axis and (c) with a logarithmic scale on both axes, respectively.

Two-point velocity-stress correlation function in a stationary HIT flow for (a)  $\mathcal {L}_{\delta }=4$ and (b)
 $\mathcal {L}_{\delta }=12$ using box filtering. The inertial range has been enlarged in the inset plots with a logarithmic scale on both axes.

In analysis of  $G_{\varDelta }$ at the inertial range, the graph, associated with
 $\lambda ^{opt}$, shows a favourable match with true points, coloured black, in figures 4 and 5. For the purpose of clarity, the inertial ranges are magnified in log-log scale plots in figure 4(c) for
 $\mathcal {L}_{\delta }=8$ and the inset plots in figure 5 for
 $\mathcal {L}_{\delta }=4, \, 12$, respectively. Motivated by these results, tempered fractional modelling seems to be faithful in fitting structures at the dissipation and the inertial ranges and also estimating the correct value of
 $r$, associated with the extremum points. Inevitably, enlarging
 $\mathcal {L}_{\delta }$ accounts for inaccuracies in fitting the tail of graphs as observed in 5(b). Notwithstanding, the mid-range interactions are acceptably predicted by the optimized TFSGS model.
With an overview of the present results, the TFSGS model stands out as a structure-based approach, which reasonably covers the gap between the FSGS and SMG models. In  $\mathcal {L}_{\delta }=4$,
 $\lambda ^{opt}$ is found to be very close to zero, which renders tempering non-essential in capturing two-point structures. As we increase
 $\mathcal {L}_{\delta }$, this gap starts widening up and the tempering mechanism acts more dynamically in finding the true BR and fitting the dissipation structures. This argument confirms that the tempered fractional approach displays great potential for parameterizing structure function especially at larger filter widths while retaining fairly acceptable accuracy.
5.4. Probability density function of SGS stresses
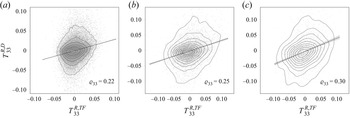
Within the proposed statistical framework, the last step in algorithm focuses on the probability density functions (PDFs) of filtered DNS data. The key idea is to assess the performance of models and verify if the proposed model maintains the true statistics. In this context, we present the scatter plots of  $\boldsymbol{\mathsf{T}}^{R,D}_{ii}$ against
 $\boldsymbol{\mathsf{T}}^{R,TF}_{ii}$ in figure 6 for three given filter widths and
 $i=3$. We should note that the present results are confined to
 $i=3$ due to the similarities in other directions. The slope in each plot is indicated by the corresponding correlation coefficients in table 2. The most noticeable specific about these results is that the data points are bounded within a same order of magnitude on both axes. As a matter of fact, we achieve a roughly unit regression coefficient between
 $\boldsymbol{\mathsf{T}}^{R,D}_{ii}$ and
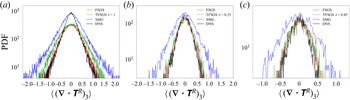
 $\boldsymbol{\mathsf{T}}^{R,TF}_{ii}$, where our optimization strategy targets for correct estimation of the SGS dissipation. This analysis can be extended to the PDF plots in figure 7. With nearly the same correlation coefficients, the SMG model fails to reproduce the true statistics, while the optimum TFSGS model offers a great match with the true graphs. As pointed out previously, in
 $\mathcal {L}_{\delta }=4$ the FSGS model represents the equivalent form of the TFSGS with
 $\alpha ^{opt}=0.76$ and
 $\lambda ^{opt}\simeq 0$.
Scatter plots of the SGS stresses obtained by the filtered DNS data ( $\boldsymbol{\mathsf{T}}^{R,D}_{33}$) vs the modelled stresses (
 $\boldsymbol{\mathsf{T}}^{R,TF}_{33}$) using optimized parameters in table 3 for (a)
 $\mathcal {L}_{\delta }=4$, (b)
 $\mathcal {L}_{\delta }=8$ and (c)
 $\mathcal {L}_{\delta }=12$.

Probability density function of the ensemble-averaged  $( \boldsymbol {\nabla } \boldsymbol {\cdot } \boldsymbol{\mathsf{T}} )_{i=3}$ for the optimized (tempered) fractional and the SMG models at (a)
 $\mathcal {L}_{\delta }=4$, (b)
 $\mathcal {L}_{\delta }=8$ and (c)
 $\mathcal {L}_{\delta }=12$.

From the understanding of energy cascading in turbulent flows, the SGS dissipation,  $\epsilon$, is considered as an external parameter in two-point structure equations for describing small-scale motions. In the statistical sense, we compare the PDFs of
 $\epsilon$, implied by the models, with the true PDFs, obtained by the filtered DNS data for
 $\mathcal {L}_{\delta }=4$, 8, 12. As shown in figure 8, the fractional models accurately predict the forward scattering, associated with the positive dissipation,
 $\epsilon ^{+}$, while the SMG model appears to be too dissipative due to its positive eddy viscosity. Furthermore, the TFSGS model presents an underprediction of the backward scattering by producing a slim amount of negative dissipation,
 $\epsilon ^{-}$. On the side of numerical analysis, this limitation results in preserving numerical stability by minimizing negative dissipation error.
Probability density function of the ensemble-averaged SGS dissipation for the optimized (tempered) fractional and the SMG models at (a)  $\mathcal {L}_{\delta }=4$, (b)
 $\mathcal {L}_{\delta }=8$ and (c)
 $\mathcal {L}_{\delta }=12$.

5.5. A posteriori analysis
With a focus on numerical stability, we extend the statistical a priori assessments to an a posteriori analysis in order to evaluate performance of the proposed models in time. We employ the pseudo-spectral solver, described in § 5.1, on  $\varOmega$ discretized with a uniform grid of
 $520^3$ resolution, and resolve over
 $5$ eddy turnover times,
 $\tau _{\mathscr {L}}$, to provide the DNS flow fields. The simulation is initiated with an instantaneous flow field, obtained from the sufficiently resolved DNS of a stationary HIT flow at
 $Re_{\lambda } = 240$. The comprehensive characteristics of this fully developed turbulent field are reported in Akhavan-Safaei & Zayernouri (Reference Akhavan-Safaei and Zayernouri2020). By the explicit filtering of this initial flow field, the a posteriori simulations are carried out on
 $130^3$ and
 $52^3$ grids for the corresponding
 $\mathcal {L}_{\delta }=2$,
 $5$, respectively.
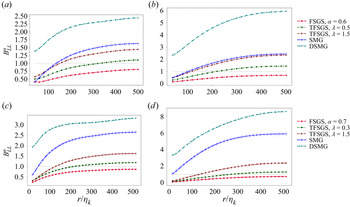
This analysis allows for structural comparisons between the fractional models and the filtered DNS data through tracking the evolution of resolved turbulent kinetic energy,  $K_{tot}(t) = \langle {\bar {V}_i\bar {V}_i}/{2}\rangle _s$. Figure 9 displays the decay of the resolved kinetic energy, which verifies computational stability of the fractional models. The TFSGS models associated with
 $\alpha =0.7$ and
 $\lambda =0.3$ for
 $\mathcal {L}_{\delta }=2$, and
 $\alpha =0.6$ and
 $\lambda =0.5$ for
 $\mathcal {L}_{\delta }=5$ present a favourable match with the true decaying of
 $K_{tot}$ compared with the SMG and dynamic SMG models. These results spotlight the importance of tempering in the correct prediction of kinetic energy while by increasing
 $\lambda$, the TFSGS model asymptotes overpredictions of the SMG model for both
 $\mathcal {L}_{\delta }=2$,
 $5$.
Decay of the resolved turbulent kinetic energy,  $K_{tot}$, for the optimized TFSGS and the SMG models with (a)
 $52^3$ and (b)
 $130^3$ grid points.

Given the a priori analysis in previous subsections, the model parameters are fitted through satisfying both sides of (4.2), which are inherently connected with the second- and third-order structure functions. In figure 10 we study the two-point second-order structure functions,  ${B}_{LL}$, after
 $2$ and
 $4$ eddy turnover times of simulation. It should be noted that
 ${B}_{LL}^{n}$ and
 ${B}_{LLL}^{n}$ represent the second- and third-order correlation functions from the LES models, which are normalized by the corresponding filtered DNS solutions, respectively. Supported by the results in figure 10, the TFSGS model, associated with the optimum
 $\lambda$, maintains
 ${B}_{LL}$ over a wide range of
 $r$ although presenting small inconsistencies at small scales. As an essential condition to a physically accurate SGS model, the optimized TFSGS also provides a fairly accurate and reliable prediction of
 ${B}_{LLL}$ compared with the FSGS and the eddy-viscosity approaches in figure 11. In this vein, we also present the energy spectra,
 $E_{\xi }$, resulting from the LES for different values of
 $\lambda$ in figure 12 and compare it with the corresponding
 $E_{\xi }$ from the DNS results at
 $t=2\tau _{\mathcal {L}}$ and
 $4\tau _{\mathcal {L}}$.
Two-point second-order structure functions of the resolved velocity fields normalized by the filtered DNS data for (a,b)  $\mathcal {L}_{\delta }=5$ and (c,d)
 $\mathcal {L}_{\delta }=2$ at
 $t=2\tau _{\mathscr {L}}$ and
 $t=4\tau _{\mathscr {L}}$, respectively.

Third-order structure functions of the resolved velocity fields normalized by the filtered DNS data for (a)  $\mathcal {L}_{\delta }=5$ and (b)
 $\mathcal {L}_{\delta }=2$ at
 $t=4\tau _{\mathscr {L}}$.

Energy spectra ( $E_{\xi }$) vs
 $\xi$, resulting from
 $130^3$ LES cases with the TFSGS models evaluated for
 $\alpha =0.7$ and
 $\lambda =0$, 0.3, 1.5 for
 $\mathcal {L}_{\delta }=2$ at (a)
 $t=2\tau _{\mathscr {L}}$ and (b)
 $t=4\tau _{\mathscr {L}}$.

In most of the LES approaches, fidelity in representing spatial structures is essentially compromised in order to preserve the numerical stability by inducing the excessive amount of energy dissipation. Nevertheless, the present results verify our findings in § 4 that the TFSGS model provides stable LES solutions while preserving high-order structure functions in a priori and also a posteriori tests.
5.6. Merits, challenges and future works
On the basis of a priori and a posteriori analyses, the present work provides a robust physics-based framework for fractional LES modelling of SGS structures. The significance of this approach lies in the following.
(i) We treat the source of turbulent small-scale motions at the kinetic level, by employing a tempered heavy-tailed distribution in approximating
$\overline {f^{eq}}$. This leads us to the tempered fractional operator in the filtered NS equations as a proper choice for modelling a power-law like behaviour in the mid-range and a Gaussian tail in real-physics anomalous phenomena.(ii) The proposed TFSGS model sets the ground for fulfilling essential statistical conditions as a relatively best approximation of an ideal LES model through fractional and tempering parameters. To achieve an optimized edition of the TFSGS model, we devise an optimization strategy, which involves conventional one-point correlation coefficients, two-point structures and the SGS dissipation.
(iii) The optimized TFSGS model presents reasonably accurate predictions of two-point structure functions for a range of filter widths while maintaining the expected correlations between the modelled and true SGS stresses.
(iv) The corresponding fractional LES solutions present a stable prediction of turbulent kinetic energy while preserving high-order structure functions in the a posteriori analysis.

Despite the theoretical and statistical challenges and achievements, we believe this approach shows a viable and promising direction toward non-local modellings of turbulence. By employing more sophisticated and physically consistent distributions in approximating  $\overline {f^{eq}(\varDelta )}$ (e.g. distributed-order tempered power laws), we can even attain better accuracy and enhanced performance. On the theoretical side, the current framework deserves a careful mathematical attention to be extended to anisotropic, yet homogeneous, flows employing proper forms of distributions at the kinetic level. Moreover, further works should be undertaken to generalize the fractional model to a data-driven representation of spatial and temporal structures in more complex turbulent regimes.
6. Conclusions and remarks
Inspired by non-locality, embedded in interactions between large- and small-scale motions, we developed a TFSGS model for LES of HIT flows. We began with modelling of turbulent effects at the kinetic level by closing the collision term in the filtered BT equation. To approximate multi-exponential behaviours of the filtered equilibrium distribution in the collision operator, we employed a tempered Lévy-stable distribution function, which presents a power law at a moderate range and then converges to an exponential decay. By ensemble averaging of the approximated BT, we derived the LES equations, in which the divergence of SGS stresses emerged as a summation of tempered fractional Laplacian,  $(\varDelta +\lambda )^{\alpha }(\cdot )$, where
 $\alpha \in (0,1)$,
 $\alpha \neq \frac {1}{2}$ and
 $\lambda > 0$. Interestingly, the FSGS is found to be a particular form of the TFSGS model when
 $\lambda$ approaches
 $0$. Moreover, we formulated the SGS stresses straightforwardly in terms of a combination of integer and fractional operators, which gives the advantage of being feasible and quite easy to implement in the Fourier space. The corollary on the frame invariant property of the FSGS model was also extended to the current model, showing its physical and mathematical consistency.
In a statistical framework, we constructed a structure based algorithm for optimizing the fractional models, which involved the closed essential conditions for a weaker sense of an ideal LES model. Following the optimization strategy, we inferred the optimum tempering parameter through a comparative study of two-point stress–strain correlation functions while the fractional exponent was fixed for maintaining reasonable values of correlation coefficients. Next, we quantified the fractional coefficient using SGS dissipation as a crucial factor in identifying high-order structures. The more profound analysis of dissipation structure functions emphasized on the central role of  $\lambda$ in spanning the gap between the FSGS and SMG models, especially at larger
 $\mathcal {L}_{\delta }$, when
 $\alpha ^{opt}$ decreases. Regarding the KH equation, the optimum TFSGS model presented a great match with the true values of two-point velocity-stress correlation functions, which ensures the accurate prediction of third-order structure functions.
The success of the tempering mechanism in capturing structure correlation functions, particularly at larger  $\mathcal {L}_{\delta }$, originated from the capabilities of our choice in fitting semi-heavy-tailed behaviour of the filtered equilibrium distribution at the kinetic level. The inspection of statistical results also supported accuracy of the fractional model in keeping unit regression and capturing the corresponding PDF tails. As a notion of numerical stability, we demonstrated that the optimized TFSGS model well predicted the true forward scattering in a statistical sense without generating any significant negative dissipation.
Lastly, the TFSGS model underwent the ultimate a posteriori analysis, which verified a numerically stable performance of the fractional model through tracking the resolved turbulent kinetic energy. With the emphasis on remarkable potentials and merits of the present work, we believe that this approach can be extended to more complex turbulent flows by employing a variety of rigorous fractional operators, derived from the statistical structures.
Acknowledgements
The high-performance computing resources and services were provided by the Institute for Cyber-Enabled Research (ICER) at Michigan State University.
Funding
This work was financially supported by the MURI/ARO grant (W911NF-15-1-0562), the ARO Young Investigator Program (YIP) award (W911NF-19-1-0444), and partially by the National Science Foundation award (DMS-1923201).
Declaration of interests
The authors report no conflict of interest.
Author contributions
Mehdi Samiee served as a PhD student on this project, and was in charge of deriving the model, developing the code based on an earlier PoF work, partially in charge of running the simulations, in addition to the statistical analyses and visualizing the data, and preparing the manuscript.
Ali Akhavan-Safaei served as a PhD student on this project, and was partially in charge of running the simulations, developing the code and analysing the data, in addition to assisting with the preparation of the manuscript.
Mohsen Zayernouri served as the PI and PhD advisor on the project, being in charge of the funding support, conceptualizing of the project and planning, providing advice on the simulations and statistical analyses, assisting with the writing original/revised manuscript, and serving as the corresponding author.
Appendix A
As noted in Deng et al. (Reference Deng, Li, Tian and Zhang2018), Di Nezza, Palatucci & Valdinoci (Reference Di Nezza, Palatucci and Valdinoci2012), the tempered fractional Laplacian operator can be represented in various equivalent forms, i.e.
 \begin{align} (\varDelta+\lambda)^{\alpha} u(\boldsymbol{x}) &={-}C_{d,\alpha} \, \mathrm{P.V.} \int_{\mathbb{R}^d}\frac{u(\boldsymbol{x})-u(\boldsymbol{\mathfrak{s}})}{ \textrm{e}^{\lambda\vert\boldsymbol{x}-\boldsymbol{\mathfrak{s}}\vert}\vert \boldsymbol{x}-\boldsymbol{\mathfrak{s}}\vert^{2\alpha+d}}\, \textrm{d}\boldsymbol{\mathfrak{s}} \nonumber\\ &=\frac{C_{d,\alpha}}{2} \, \mathrm{P.V.} \int_{\mathbb{R}^d }\frac{u(\boldsymbol{x}+\boldsymbol{\mathfrak{s}})+u(\boldsymbol{x}-\boldsymbol{\mathfrak{s}})-2u(\boldsymbol{x})}{ \textrm{e}^{\lambda\mathfrak{s}} \, \mathfrak{s}^{2\alpha+d}}\, \textrm{d}\boldsymbol{\mathfrak{s}}, \end{align}
where  $\mathfrak {s} = \vert \boldsymbol {\mathfrak {s}}\vert$,
 $\alpha \in (0,\frac {1}{2}) \cup (\frac {1}{2},1)$, and
 $\lambda >0$. By performing the Fourier transform of (A1), we get
 \begin{align} \mathcal{F} \left[(\varDelta+\lambda)^{\alpha} u(\boldsymbol{x}) \right] (\boldsymbol{\xi}) &= \frac{C_{d,\alpha}}{2} \int_{\mathbb{R}^d} \frac{\textrm{e}^{\boldsymbol{\xi}\boldsymbol{\cdot} \boldsymbol{\mathfrak{s}}}+\textrm{e}^{-\boldsymbol{\xi}\boldsymbol{\cdot} \boldsymbol{\mathfrak{s}}}-2}{\textrm{e}^{\lambda \mathfrak{s}} \, s^{2\alpha+d}}\, \textrm{d}\boldsymbol{\mathfrak{s}}\nonumber\\ &={-} C_{d,\alpha} \int_{\mathbb{R}^d}^{} \frac{1-\cos(\boldsymbol{\xi}\boldsymbol{\cdot} \boldsymbol{\mathfrak{s}})}{\textrm{e}^{\lambda \mathfrak{s}} \, \mathfrak{s}^{n+2\alpha}}\, \textrm{d}\boldsymbol{\mathfrak{s}} \, \mathcal{F} \left[u(\boldsymbol{x}) \right](\boldsymbol{\xi}), \end{align}
in which  $\boldsymbol {\xi }$ denotes the Fourier numbers. For the sake of simplicity, we define
 \begin{equation} I(\boldsymbol{\xi})={-}\int_{\mathbb{R}^d} \frac{1-\cos(\boldsymbol{\xi}\boldsymbol{\cdot} \boldsymbol{\mathfrak{s}})}{\textrm{e}^{\lambda \mathfrak{s}} \, \mathfrak{s}^{n+2\alpha}}\, \textrm{d}\boldsymbol{\mathfrak{s}}, \end{equation}
which appears to be rotationally invariant. Moreover, we introduce  $\xi = \vert \boldsymbol {\xi }\vert$ and
 $\mathfrak {s}_{\theta } = \mathfrak {s} \cos (\theta )$. Without loss of generality,
 $\theta$ can be chosen such that
 $\mathfrak {s} \, \cos (\theta )$ is aligned with the first primary direction. Therefore,
 $I(\boldsymbol {\xi })$ can be re-expressed by
 \begin{equation} I(\boldsymbol{\xi})=\int_{\mathbb{R}^d} \frac{\cos(\boldsymbol{\xi}\boldsymbol{\cdot} \boldsymbol{\mathfrak{s}})-1}{\textrm{e}^{\lambda \mathfrak{s}} \, \mathfrak{s}^{n+2\alpha}}\, \textrm{d}\boldsymbol{\mathfrak{s}} = \int_{\mathbb{R}^d} \frac{\cos(\eta_{\theta})-1}{\textrm{e}^{\lambda \eta / \xi} (\eta / \xi)^{n+2\alpha}} \frac{\textrm{d}\boldsymbol{\eta}}{\xi^n} = \xi^{2\alpha} \int_{\mathbb{R}^d} \frac{\cos(\eta_{\theta})-1}{\textrm{e}^{\lambda \eta / \xi} (\eta)^{n+2\alpha}}\, \textrm{d}\boldsymbol{\eta}, \end{equation}
where  $\boldsymbol {\eta }=\xi \boldsymbol {\mathfrak {s}}$,
 $\eta = \vert \boldsymbol {\eta } \vert$ and
 $\eta _{\theta } = \xi \mathfrak {s}_{\theta }$. Due to the invariant properties of
 $I(\boldsymbol {\xi })$, we proceed the derivations with transforming (A4) into the corresponding spherical coordinate,
 $(\mathrm {r}, \phi _1, \ldots, \phi _{d-1})$.
In terms of the transformation, we let  $\eta = \vert \boldsymbol {\eta } \vert = {r}$ and
 $\eta _{\theta }=\eta \cos (\theta ) = {r} \cos (\phi _1)$. Then, in a general case for
 $d>1$,
 $\textrm {d}\boldsymbol {\eta }$ follows
 \begin{equation} \textrm{d}\boldsymbol{\eta} = \mathcal{J}({r}, \phi_1, \ldots, \phi_{d-1}) \, \textrm{d}{r}\, \textrm{d}\phi_1 \dots \textrm{d}\phi_{d-1}, \end{equation}
where
 \begin{equation} \mathcal{J}({r}, \phi_1, \ldots, \phi_{d-1})=\left\vert \textrm{det} \frac{\partial x_i}{\partial({r} \phi_j)} \right\vert = {r}^{d-1} \sin^{d-2}(\phi_1)\sin^{d-3}(\phi_2) \dots \sin(\phi_{d-2}) \end{equation}
for  $i=1,\ldots,d$ and
 $j=1,\ldots,d-1$ (see Henderson & Taimina Reference Henderson and Taimina2000). Therefore, we find the general form of
 $I(\boldsymbol {\xi })$ as
 \begin{equation} I(\boldsymbol{\xi}) = \xi^{2\alpha}\, \bar{c} \,\int_{0}^{\infty} \int_{0}^{2{\rm \pi}} \frac{\cos \left({r} \cos(\phi_1) \right)-1}{\textrm{e}^{\lambda {r} / \xi} ({r})^{d+2\alpha}}\, {r}^{d-1} \sin^{d-2}(\phi_1) \, \textrm{d}\phi_1\,\textrm{d}{r}, \end{equation}
where  $\bar {c} = \int _{0}^{{\rm \pi} } \sin ^{d-3}(\phi _2) \, \textrm {d}\phi _2 \dots \int _{0}^{{\rm \pi} } \sin (\phi _{d-1}) \, \textrm {d}\phi _{d-1} = {2{\rm \pi} ^{(d-1)/2}}/{\varGamma ({(d-1})/{2})}$. It is shown by Deng et al. (Reference Deng, Li, Tian and Zhang2018) that
 \begin{align} I(\boldsymbol{\xi}) &= \bar{c} \, \xi^{2\alpha} \,\int_{0}^{\infty} \frac{\textrm{e}^{-\lambda {r}/\xi}}{{r}^{\beta+1}} \int_{0}^{2{\rm \pi}} \left[ \cos\left({r} \cos(\phi_1) \right)-1 \right] \sin^{d-2}(\phi_1)\, \textrm{d}\phi_1 \, \textrm{d}{r} \nonumber\\ &=\frac{\bar{c} \, \varGamma({-}2\alpha) {\rm \pi}^{1/2} \varGamma\left(\dfrac{d\!-\!1}{2}\right)}{\varGamma\left(\dfrac{d}{2}\right)} \left[ \lambda^2 \!-\! (\lambda^2\!+\!\xi^2)^{\alpha} \,{}_{2}{F}^{}_{1}\left(-\alpha, \frac{d\!+\!2\alpha\!-\!1}{2};\frac{d}{2};\frac{\xi^2}{\xi^2+\lambda^2}\right)\right], \end{align}
where  ${}_{2}{F}^{}_{1}$ denotes a Gaussian hypergeometic function. Therefore,
 \begin{equation} \mathcal{F} \left[ (\varDelta\!+\!\lambda)^{\alpha} u(\boldsymbol{x}) \right] (\boldsymbol{\xi}) = \mathfrak{C}_{d,\alpha} \times \left[ \lambda^2 - (\lambda^2+\xi^2)^{\alpha} {}_{2}{F}^{}_{1}\left(-\alpha, \frac{d+2\alpha-1}{2};\frac{d}{2};\frac{\xi^2}{\xi^2+\lambda^2}\right) \right], \end{equation}
where  $\mathfrak {C}_{d,\alpha } = C_{d,\alpha } \,\bar {c} \, \varGamma (-2\alpha )({{\rm \pi} ^{1/2}\varGamma ({(d-1)}/{2})}/{\varGamma (d/2)})={1}/{}_{2}{F}^{}_{1}(-\alpha,( {d+2\alpha -1})/ {2};{d}/{2};1)$.
Appendix B
As we discussed in subsection 3.3, the SGS stresses are described by
 \begin{equation} \boldsymbol{\mathsf{T}}_{ij}^{R} = \frac{\rho \, {c}_{\beta,\lambda}}{U^3} \int_{0}^{\infty} \int_{\mathbb{R}^3} (u_i-\bar{V}_i)(u_j-\bar{V}_j) \left(F^{\beta,\lambda}(\bar{\varDelta}_{s})-F^{\beta,\lambda}(\bar{\varDelta})\right) \textrm{e}^{{-}s} \,\textrm{d}\boldsymbol{u}\, \textrm{d}s, \end{equation}
where  $F^{\beta,\lambda }(\bar {\varDelta })$ represents a tempered Lévy
 $\beta$-stable distribution. Let us consider
 $\beta = -\alpha -\frac {3}{2}$ for
 $\alpha \in (0,\frac {1}{2}) \cup (\frac {1}{2},1)$. Regarding the equivalent Pareto-like behaviour of Lévy distributions (Weron Reference Weron2001) at
 $\bar {\varDelta } > 1$, we decompose the domain of kinetic momentum such that
 $\mathbb {R}^3 = \mathcal {I}_{\epsilon } \cup ( \mathbb {R}^3 \setminus \mathcal {I}_{\epsilon } )$, where
 $\mathcal {I}_{\epsilon }=\{ u\in \mathbb {R}^d\ s.t. \ \vert \bar {\varDelta } \vert < \epsilon \}$ and
 $\epsilon \ll 1$. This allows for the approximation
 \begin{equation} F^{\alpha,\lambda}(\bar{\varDelta}) \simeq C_{\alpha} \begin{cases} 0, & \boldsymbol{u} \in \mathcal{I}_{\epsilon}, \\ \textrm{e}^{-\lambda \, \bar{\varDelta}^{{1}/{2}}} \bar{\varDelta}^{-(\alpha+{3}/{2})}, & \boldsymbol{u} \in \mathbb{R}^3 \setminus \mathcal{I}_{\epsilon}, \end{cases} \end{equation}
where  $C_{\alpha } \!=\! ({-\varGamma ({3}/{2})}/{2 {\rm \pi}^{{3}/{2}}\varGamma (-2\alpha )})({1}/{^{2}{F}^{}_{1}(-\alpha,1\!+\!\alpha ;{3}/{2};1)})$. It is worth mentioning that
 $F^{\alpha,\lambda }(\bar {\varDelta })$ reduces exponentially in a close proximity of
 $\bar {\varDelta } = 0$. With all this in mind, the approximated function of
 $F^{\alpha,\lambda }(\bar {\varDelta })$ in (B2) can properly capture the heavy-tailed behaviour of the filtered collision term. Evidently, by replacing
 $\textrm {e}^{-\lambda \bar {\varDelta }_s^{{1}/{2}}}$ with
 $\textrm {e}^{-\lambda \bar {\varDelta }^{{1}/{2}}}$ for
 $\bar {\varDelta } >1$, we arrive at the expression
 \begin{align} F^{\alpha,\lambda}(\bar{\varDelta}_{s})-F^{\alpha,\lambda}(\bar{\varDelta}) &= C_{\alpha} \left( \frac{\textrm{e}^{-\lambda \bar{\varDelta}_s^{{1}/{2}}}} {\bar{\varDelta}_s^{(\alpha+{3}/{2})}} - \frac{\textrm{e}^{-\lambda \bar{\varDelta}^{{1}/{2}}}}{\bar{\varDelta}^{(\alpha+{3}/{2})}} \right)\nonumber\\ &\simeq C_{\alpha} \, \textrm{e}^{-\lambda \bar{\varDelta}^{{1}/{2}}} \left( \frac{1}{\bar{\varDelta}^{(\alpha+{3}/{2})}_s }- \frac{1}{\bar{\varDelta}^{(\alpha+{3}/{2})}} \right), \end{align}
and accordingly,
 \begin{equation} \boldsymbol{\mathsf{T}}_{ij}^{R} = \frac{\rho \, {c}_{\alpha,\lambda}}{U^3} \, C_{\alpha} \int_{0}^{\infty} \int_{\mathbb{R}^3 \setminus \mathcal{I}_{\varDelta}} (u_i\!-\!\bar{V}_i)(u_j-\bar{V}_j) \textrm{e}^{-\lambda \bar{\varDelta}^{{1}/{2}}} \left( \frac{1}{\bar{\varDelta}^{(\alpha+{3}/{2})}_s }- \frac{1}{\bar{\varDelta}^{(\alpha+{3}/{2})}} \right) \textrm{e}^{{-}s} \,\textrm{d}\boldsymbol{u}\, \textrm{d}s, \end{equation}
where  ${c}_{\alpha,\lambda }$ is a real-valued constant. As a continuous differentiable function for
 $\bar {\varDelta } >1$, we proceed with the Taylor expansion of
 $\bar {\varDelta }_s^{-(\alpha +{3}/{2})}$ according to
 \begin{equation} \bar{\varDelta}_s^{-(\alpha+{3}/{2})} - \bar{\varDelta}^{-(\alpha+{3}/{2})} \approx \frac{\partial\bar{\varDelta}^{-(\alpha+{3}/{2})} }{\partial \bar{\varDelta}} (\bar{\varDelta}_s-\bar{\varDelta}) ={-}\left(\alpha+\frac{3}{2}\right) C_{\alpha}\frac{(\bar{\varDelta}_s-\bar{\varDelta})}{\bar{\varDelta}^{\alpha+5/2}}. \end{equation}
In terms of the assumptions in remark 3.1, we use the same argument, presented by Samiee et al. (Reference Samiee, Akhavan-Safaei and Zayernouri2020a, appendix), on approximating  $\bar {\varDelta }_s-\bar {\varDelta }$ for
 $\bar \varDelta \gg 1$, which allows for
 $u_i -\bar {V}_i \approx u_i$ and, thus,
 \begin{equation} \bar{\varDelta}_s-\bar{\varDelta} \approx 2 \sum_{k=1}^{3}\frac{ u_k(\bar{V}_k(\boldsymbol{x}^{\prime})-\bar{V}_k(\boldsymbol{x}))}{U^2}. \end{equation}
Reminding the definition of  $\boldsymbol {u} = ({\boldsymbol {x} - \boldsymbol {x}^{\prime }})/{s \tau }$ from § 3.2, we plug (B6) into (B4) and obtain
 \begin{align} \boldsymbol{\mathsf{T}}_{ij}^{R} &= (2\alpha+3)(\rho\, {c}_{\alpha,\lambda}\, C_{\alpha} \tau^{2\alpha-1} U^{2\alpha}) \nonumber\\ & \quad \times\int_{0}^{\infty} \frac{\textrm{e}^{{-}s}}{s^{1-2\alpha}} \int_{\mathbb{R}^3 \setminus \mathcal{I}_{\varDelta}} (x_i-x_i^{\prime}) (x_j-x_j^{\prime}) \frac{(\boldsymbol{x} -\boldsymbol{x}^{\prime})\boldsymbol{\cdot} (\bar{\boldsymbol{V}}(\boldsymbol{x})- \bar{\boldsymbol{V}} (\boldsymbol{x}^{\prime}) ) }{\vert \boldsymbol{x} -\boldsymbol{x}^{\prime}\vert^{2\alpha+5} \textrm{e}^{\lambda ({\vert \boldsymbol{x} -\boldsymbol{x}^{\prime}\vert}/{s\tau U}})}\, \textrm{d}\kern0.06em\boldsymbol{x}^{\prime} \,\textrm{d}s. \end{align}
In order to evaluate the outer integral in (B7) and find the corresponding coefficient, our approach is to dissociate the temporal element by employing the bionomial series of  $\textrm {e}^{\lambda ({\vert \boldsymbol {x} -\boldsymbol {x}^{\prime }\vert }/{s\tau U})}$ as
 \begin{align}
\exp\left(-\frac{\lambda \vert \boldsymbol{x} -\boldsymbol{x}^{\prime}\vert}{s\tau
U}\right) &= \left(1-1+\exp\left(- \frac{\lambda \vert
\boldsymbol{x} -\boldsymbol{x}^{\prime}\vert}{s\tau
U}\right)\right)^{{1}/{s}}
= \sum_{k=0}^{\infty} {\dfrac{1}{s}}{k} \, (\exp(\bar{\lambda}\vert
\boldsymbol{x} -\boldsymbol{x}^{\prime}\vert)-1)
\nonumber\\
&= 1 + \frac{1}{s} (\exp(\bar{\lambda}\vert
\boldsymbol{x} -\boldsymbol{x}^{\prime}\vert)-1) \!+\!
\frac{\frac{1}{s}\left(\dfrac{1}{s}-1\right)}{2!}
(\exp({\bar{\lambda}\vert \boldsymbol{x}
-\boldsymbol{x}^{\prime}\vert})-1) +\cdots \nonumber\\
&=\sum_{k=0}^{\infty} W_{k,\infty}(s)
\exp({-\bar{\lambda}_k \vert \boldsymbol{x}
-\boldsymbol{x}^{\prime}\vert }) \nonumber\\ &\simeq
\sum_{k=0}^{\mathcal{K}} W_{k,\mathcal{K}}(s)
\exp({-\bar{\lambda}_k \vert \boldsymbol{x}
-\boldsymbol{x}^{\prime}\vert }),
\end{align}
where  $\bar {\lambda }={\lambda }/{\tau U}$ and
 $\bar {\lambda }_k=\bar {\lambda }$. Under the assumption of
 $\lambda > 0.01$, we can approximate the binomial series with the first two leading terms, which yields
 $W_{0,1}=1-{1}/{s}$ and
 $W_{1,1}={1}/{s}$ for
 $\mathcal {K}=1$. Accordingly, by defining
 $\bar {\nu }_{\alpha } = (2\alpha +3)(\rho \, C_{\alpha } \, \tau ^{2\alpha -1} U^{2\alpha })$ and
 \begin{equation} \bar{\phi}_{k}^{\mathcal{K}}(\alpha) = \int_{0}^{\infty} \frac{\textrm{e}^{{-}s}}{s^{1-2\alpha}} \, W_{k,\mathcal{K}}(s) \, \textrm{d}s, \end{equation}
we obtain the closed form of  $\boldsymbol{\mathsf{T}}_{ij}^{R}$ as
 \begin{equation} \boldsymbol{\mathsf{T}}_{ij}^{R} = {c}_{\alpha,\lambda} \, \bar{\nu}_{\alpha} \sum_{k=0}^{\mathcal{K}} \bar{\phi}_{k}^{\mathcal{K}}(\alpha) \int_{\mathbb{R}^d-B_{\epsilon}} \underbrace{(x_i -x_i^{\prime}) \, (x_j -x_j^{\prime}) \frac{(\boldsymbol{x} -\boldsymbol{x}^{\prime})\boldsymbol{\cdot} (\bar{\boldsymbol{V}}- \bar{\boldsymbol{V}}^{\prime} ) }{\vert \boldsymbol{x} -\boldsymbol{x}^{\prime}\vert^{2\alpha+5} \textrm{e}^{\bar{\lambda}_k \vert \boldsymbol{x} -\boldsymbol{x}^{\prime} \vert}}}_{\mathcal{I}_{ij}} \textrm{d}\kern0.06em\boldsymbol{x}^{\prime}. \end{equation}
To ensue the proper form of the SGS stresses in the filtered NS equations, we take the derivative of  $\mathcal {I}_{ij}$ term by term, which yields
 \begin{align} \frac{\partial \mathcal{I}_{ij}}{\partial x_i} &= \int_{\mathbb{R}^d-B_{\epsilon}} \sum_{i=1}^{3} \left\{-(x_j -x_j^{\prime}) \frac{(\boldsymbol{x} -\boldsymbol{x}^{\prime})\boldsymbol{\cdot} (\bar{\boldsymbol{V}}- \bar{\boldsymbol{V}}^{\prime})}{\vert \boldsymbol{x} -\boldsymbol{x}^{\prime}\vert^{2\alpha+5} \, \textrm{e}^{\bar{\lambda}_k \vert \boldsymbol{x} -\boldsymbol{x}^{\prime} \vert}}\right.\nonumber\\ &\quad - (x_i -x_i^{\prime}) \, \delta_{ij} \, \frac{(\boldsymbol{x} -\boldsymbol{x}^{\prime})\boldsymbol{\cdot} (\bar{\boldsymbol{V}}- \bar{\boldsymbol{V}}^{\prime} ) }{\vert \boldsymbol{x} -\boldsymbol{x}^{\prime}\vert^{2\alpha+5} \, \textrm{e}^{\bar{\lambda}_k \vert \boldsymbol{x} -\boldsymbol{x}^{\prime} \vert}} \nonumber\\ &\quad - \frac{(x_j -x_j^{\prime}) (x_j -x_j^{\prime}) (\bar{V}_i - \bar{V}^{\prime}_i ) }{\vert \boldsymbol{x} -\boldsymbol{x}^{\prime}\vert^{2\alpha+5} \, \textrm{e}^{\bar{\lambda}_k \vert \boldsymbol{x} -\boldsymbol{x}^{\prime} \vert}}\nonumber\\ &\quad -(x_i -x_i^{\prime}) (x_j -x_j^{\prime})(x_k -x_k^{\prime}) \frac{\partial \bar{V}_k}{\partial x_i} \frac{\textrm{e}^{-\bar{\lambda}_k \vert \boldsymbol{x} -\boldsymbol{x}^{\prime} \vert}}{\vert \boldsymbol{x} -\boldsymbol{x}^{\prime}\vert^{2\alpha+5}}\nonumber\\ &\quad (2\alpha+5) (x_i -x_i^{\prime})^2 (x_j -x_j^{\prime}) \frac{(\boldsymbol{x} -\boldsymbol{x}^{\prime})\boldsymbol{\cdot} (\bar{\boldsymbol{V}}- \bar{\boldsymbol{V}}^{\prime} ) }{\vert \boldsymbol{x} -\boldsymbol{x}^{\prime}\vert^{2\alpha+5} \, \textrm{e}^{\bar{\lambda}_k \vert \boldsymbol{x} -\boldsymbol{x}^{\prime} \vert}}\nonumber\\ &\quad \left.+ \bar{\lambda}_k (x_i -x_i^{\prime}) (x_j -x_j^{\prime}) \frac{(\boldsymbol{x} -\boldsymbol{x}^{\prime})\boldsymbol{\cdot} (\bar{\boldsymbol{V}}- \bar{\boldsymbol{V}}^{\prime} ) }{\vert \boldsymbol{x} -\boldsymbol{x}^{\prime}\vert^{2\alpha+5} \, \textrm{e}^{\bar{\lambda}_k \vert \boldsymbol{x} -\boldsymbol{x}^{\prime} \vert}} \right\}\textrm{d}\kern0.06em\boldsymbol{x}^{\prime}, \end{align}
which is clearly simplified to
 \begin{equation} \frac{\partial \mathcal{I}_{ij}}{\partial x_i} = (\bar{\lambda}_k + 2\alpha +5-3-1-1) \int_{\mathbb{R}^d-B_{\epsilon}} (x_j -x_j^{\prime}) \frac{(\boldsymbol{x} -\boldsymbol{x}^{\prime})\boldsymbol{\cdot} (\bar{\boldsymbol{V}}- \bar{\boldsymbol{V}}^{\prime} ) }{\vert \boldsymbol{x} -\boldsymbol{x}^{\prime}\vert^{2\alpha+5} \, \textrm{e}^{\bar{\lambda}_k \vert \boldsymbol{x} -\boldsymbol{x}^{\prime} \vert}}\, \textrm{d}\kern0.06em\boldsymbol{x}^{\prime}. \end{equation}
Following the derivations in Samiee et al. (Reference Samiee, Akhavan-Safaei and Zayernouri2020a), Epps & Cushman-Roisin (Reference Epps and Cushman-Roisin2018), (B12) can be formulated in the form of a tempered fractional Laplacian by performing the technique of integration-by-parts for (B12) as  $\int A \,\textrm {d}B = AB - \int B \,\textrm {d}A$. We consider
 \begin{equation} A=(x_j -x_j^{\prime})(\bar{V}_k - \bar{V}^{\prime}_k ) \, \textrm{e}^{-\bar{\lambda}_k \vert \boldsymbol{x} -\boldsymbol{x}^{\prime} \vert}, \quad \textrm{d}B = \frac{(x_k -x_k^{\prime})}{\vert \boldsymbol{x} -\boldsymbol{x}^{\prime}\vert^{2\alpha+5}} \, \textrm{d}\kern0.06em\boldsymbol{x}^{\prime}, \end{equation}
which directly leads to  $AB|_{u\in \mathbb {R}^3} \simeq 0$. Therefore, we get
 $\int A \, \textrm {d}B = - \int B \, \textrm {d}A$, in which
 \begin{equation} \left.\begin{gathered} B=\frac{-1}{(2\alpha+3) \vert \boldsymbol{x} -\boldsymbol{x}^{\prime}\vert^{2\alpha+3}}, \\ \textrm{d}A = \delta_{jk} (\bar{V}_k - \bar{V}^{\prime}_k )\textrm{e}^{-\bar{\lambda}_k \vert \boldsymbol{x} -\boldsymbol{x}^{\prime} \vert} + (x_j -x_j^{\prime})\left(\frac{\partial \bar{V}_k}{\partial x_k} \right)\textrm{e}^{-\bar{\lambda}_k \vert \boldsymbol{x} -\boldsymbol{x}^{\prime} \vert}\\ - \bar{\lambda}_k (x_j -x_j^{\prime})(\bar{V}_k - \bar{V}^{\prime}_k ) \textrm{e}^{-\bar{\lambda}_k \vert \boldsymbol{x} -\boldsymbol{x}^{\prime} \vert} \,\textrm{d}\kern0.06em\boldsymbol{x}^{\prime}. \end{gathered}\right\} \end{equation}
We can make even more simplifications by eliminating the second term of  $\textrm {d} A$ due to the incompressibility assumption, i.e.
 $\partial \bar {V}_k/\partial x_k=0$. Moreover, by evaluating
 $\int B \, \textrm {d}A$ the last term vanishes since it represents an odd function of
 $\boldsymbol {x}^{\prime }$. Therefore, the ultimate form of the TFSGS model is found to be
 \begin{align} (\boldsymbol{\nabla}\boldsymbol{\cdot} \boldsymbol{\mathsf{T}}^{\mathcal{R}})_j &= {c}_{\alpha,\lambda} \, \bar{\nu}_{\alpha} \sum_{k=0}^{\mathcal{K}} \frac{(2\alpha+\bar{\lambda}_k)}{(2\alpha+3)} \,\bar{\phi}_{k}^{\mathcal{K}}(\alpha) \int_{\mathbb{R}^d-B_{\epsilon}} \frac{(\bar{V}_j -\bar{V}_j^{\prime}) }{\vert \boldsymbol{x} -\boldsymbol{x}^{\prime}\vert^{2\alpha+3} \, \textrm{e}^{\bar{\lambda}_k \vert \boldsymbol{x} -\boldsymbol{x}^{\prime} \vert}}\, \textrm{d}\kern0.06em\boldsymbol{x}^{\prime},\nonumber\\ &= \nu_{\alpha} \sum_{k=0}^{\mathcal{K}} \phi_{k}^{\mathcal{K}}(\alpha,\bar{\lambda}_k) (\varDelta+\bar{\lambda}_k)^{\alpha} \, \bar{V}_j, \end{align}
where  $\nu _{\alpha } = \mathrm {c}_{\alpha,\lambda } \, \bar {\nu }_{\alpha }$.