INTRODUCTION
The rising population of the developing world poses unprecedented pressure on the agricultural production systems and natural resources to meet the increasing food demand. Achieving food security under sustainable systems without deteriorating natural resources like land, water and environment is highly critical for alleviating poverty (Walsh et al., Reference Walsh, Klatt, Solie, Godsey and Raun2013; Wu and Ma, Reference Wu and Ma2015). Despite technological advances such as improved cultivars, genetically modified organisms, precise irrigation systems and improved pest management, nutrient is still a key factor determining agricultural productivity.
Wheat (Triticum aestivum L.) is one of the most important cereals in the human diet after rice (Oryza sativa L.) and its cultivation is largely dependent on extensive use of N fertilizer. However, wheat grain produced per unit of applied N fertilizer has been decreased continuously (Dobermann et al., Reference Dobermann, Witt, Dawe, Gines, Nagarajan, Satawathananont, Son, Tan, Wang, Chien, Thoa, Phung, Stalin, Muthukrishnan, Ravi, Babu, Chatuporn, Kongchum, Sun, Fu, Simbahan and Adviento2002), resulting in poor N use efficiency (López-Bellido et al., Reference López-Bellido, López-Bellido and Redondo2005). The large variation in soil N status and blanket fertilizer application following improper general recommendation by the farmers lead to over application of N fertilizer. Singh et al. (Reference Singh, Singh, Singh, Thind, Kumar, Gupta, Kaul and Vashistha2012a) opined that blanket N fertilizer recommendations for large tracts have well served the purpose to produce optimum grain yields, but fail to increase N use efficiency. The main reason for poor N use efficiency is inefficient splitting of N dose coupled with N application in excess of crop demand. N volatilization, denitrification and leaching also lead to low N use efficiency in wheat (Pathak et al., Reference Pathak, Aggarwal, Roetter, Kalra, Bandyopadhaya, Prasad and van Keulen2003; Singh et al., Reference Singh, Singh, Singh, Thind and Gupta2010). From a sustainable point of view, N management in wheat needs to be refined for improving N use efficiency, crop productivity and profitability, while minimizing N fertilizer loss to the environment.
Generally, wheat farmers used to apply half of the recommended dose of N and full dose of P and K at the time of sowing and the remaining N is topdressed equally in two splits at crown root initiation (CRI) and maximum tillering (MT) stages, coinciding with irrigation events. Increment of N use efficiency can be obtained only when the application coincides with stages of high N demand by crops (Diacono et al., Reference Diacono, Rubino and Montemurro2013). Blanket N dose varying from 100 to 150 kg N ha−1 indicates huge spatial variation and farmers apply it in more than two splits. In fact, farmers often apply an extra dose of N to avoid the risk of deficiency as it is linked with irrigation events. In few cases, researchers noticed that 13% extra wheat grain yield could be achieved by applying three splits rather than two (Erdle et al., Reference Erdle, Mistele and Schmidhalter2011; Singh et al., Reference Singh, Singh, Singh, Thind, Kumar, Singh, Choudhary, Gupta and Vashistha2013).
The major reason for apparently wasting more money by applying more fertilizer than a crop can use is that the general recommendation in split is not appropriate for all cultivation regions. In many regions, farmers are applying N fertilizer at levels that exceed the dose suggested by the government extension services (Singh et al., Reference Singh, Sharma, Kaur, Jat, Martin, Singh, Singh, Chandna, Choudhary, Gupta, Thind, Singh, Uppal, Khurana, Kumar, Uppal, Vashistha, Raun and Gupta2011). This resulted in loss of both money and fertilizer. In the mid-80s to mid-90s, emphasis was given to reduce N losses by matching crop N demand with fertilizer N supply, increasing N use efficiency. This was achieved by using gadgets such as leaf colour charts and Chlorophyllmeters for guiding real-time N topdressing in wheat (Shukla et al., Reference Shukla, Ladha, Singh, Dwivedi, Balasubramanian, Gupta, Sharma, Singh, Pathak, Pandey, Padre and Yadav2004). SPAD 502 Chlorophyllmeter, which measures leaf transmittance at two wavelengths (650 and 940 nm), is a non-destructive alternative to indirect evaluation of nitrogen nutrition (Naud et al., Reference Naud, Makowski and Jeuffroy2009). The gadgets can help improving N management in wheat under field conditions by saving N fertilizer, enhancing wheat yield and providing economic benefits to the farmers.
This study emphasizes the development and evaluation of site-specific N fertilizer management in wheat using Chlorophyllmeter for saving N fertilizer, improving wheat productivity, and N use efficiency. The major aim was to test whether SPAD-based N fertilizer management was appropriate for managing fertilizer N in irrigated wheat in eastern India.
MATERIALS AND METHODS
Experimental site
Field experiment was conducted in the research farm of Agricultural and Food Engineering Department, Indian Institute of Technology Kharagpur, Kharagpur, India (22°19′N; 87°19′E, and 44 m a.s.l.). The soil of the location is red lateritic sandy loam in texture, taxonomically grouped under Haplustaff and low in fertility status. The climate of Kharagpur is characterized by hot and humid summer (April and May), moderately hot and dry autumn (October and November) and cool and dry winter (December and January). The site receives annual average rainfall of 1400 mm of which 70–75% occurred in the monsoon months (June to October). The average air temperature varies from 21°C in December/January to 32°C in May/June.
Treatments
The experiment was carried out during the dry season (November to April) of 2010/11 and 2011/12. The experiment had 12 treatments, with nine treatments combining three SPAD thresholds (38, 40 and 42) and three N levels defined as low (15 kg ha−1), medium (25 kg ha−1) and high (35 kg ha−1) at each topdressing under real time N management (RTNM), one treatment of fixed time N management (FTNM) with 120–21.8-50 kg N-P-K ha−1, farmers’ fertilizer practise (FFP) and control (zero-N). The plot size for each treatment was 6 × 5 m. All treatment combinations, except FFP and control, received 60-21.8-50 kg N-P-K ha−1 as basal fertilization. In RTNM treatments, N was topdressed as urea when the SPAD value went below the threshold level up to the first flowering (Supplementary Figures S1 and S2, available online at https://doi.org/10.1017/S0014479717000035). The low, medium and high N rates were used for each SPAD thresholds of 38, 40 and 42 during both crop seasons. In FTNM, N was topdressed at 30 kg ha−1 each at CRI and jointing stages of wheat crop. The FFP received 40-26.2-12.5 kg N-P-K ha−1 as basal fertilization and 20 kg N and 12.5 kg K ha−1 each at CRI and jointing stages as topdressing. The sources of chemical fertilizers were urea, single super phosphate and muriate of potash.
The details of treatment combinations are as follows:
 $$\begin{equation*}
\begin{array}{@{}l@{}} {{\rm{T}}_1} = {{\rm{S}}_{38}}{{\rm{N}}_{15}}\ \quad {{\rm{T}}_4} = {{\rm{S}}_{40}}{{\rm{N}}_1}_5\quad {{\rm{T}}_7} = {{\rm{S}}_{42}}{{\rm{N}}_{15}} \\[5pt]
{{\rm{T}}_2} = {{\rm{S}}_{38}}{{\rm{N}}_{25}}\ \quad {{\rm{T}}_5} = {{\rm{S}}_{40}}{{\rm{N}}_2}_5\quad {{\rm{T}}_8} = {{\rm{S}}_{42}}{{\rm{N}}_{25}}\\[5pt]
{{\rm{T}}_3} = {{\rm{S}}_{38}}{{\rm{N}}_{35}}\ \quad {{\rm{T}}_6} = {{\rm{S}}_{40}}{{\rm{N}}_3}_5\quad {{\rm{T}}_9} = {{\rm{S}}_{42}}{{\rm{N}}_{35}}\\[5pt]
{{\rm{T}}_{10}}{\rm{ = FTNM }}\, (120 - 21.8 - 50{\rm{ kg\, N}} - {\rm{P}} - {\rm{K h}}{{\rm{a}}^{ - 1}})\\ [5pt]
{{\rm{T}}_{11}}{\rm{ = FFP }}\, (80 - 26.2 - 37.5{\rm{ kg\, N}} - {\rm{P}} - {\rm{K h}}{{\rm{a}}^{ - 1}})\\ [5pt]
{{\rm{T}}_{12}}{\rm{ = Control}}\, ({\rm{No}}\;{\rm{application}}\;{\rm{of}}\;{\rm{fertilizer}}) \\
\end{array}
\end{equation*}$$
The Chlorophyllmeter (SPAD 502, Minolta Camera Co., Osaka, Japan) was used for estimating chlorophyll content from CRI (25 days after sowing – DAS) up to the soft dough stage (85 DAS) at 10 days intervals for all treatments and replications. The fully youngest expanded leaf was used in SPAD measurements and readings were taken on one side of the midrib of the leaf blade, midway between the leaf base and tip. A mean of 15 readings per plot was taken as the measured SPAD value.
Crop management
Wheat variety ‘Sonalika’ was used as it is the most popular variety of wheat grown in India for several decades and provides good yield. It takes about 105–110 days to mature under short and mild winter condition at Kharagpur, India. Before field preparation, well decomposed farm yard manure was added (5.0 Mg ha−1) to the experimental field in both years and mixed thoroughly with soil by crosswise ploughing the field twice with a power tiller after harvesting the previous crop rice. Basal dose of fertilizer as per the treatments was applied and incorporated in each plot one day before sowing of wheat. Wheat was sown on 25 November 2010 and 28 November 2011 at a spacing of 20 cm between rows.
Biometry and yield
An area of 15 m2 from each plot was earmarked for destructive sampling and the rest of the plot was used for yield estimation. Various biometric variables were recorded at different growth stages of the crop from the earmarked area of each plot and economic yield was estimated at final harvest. Tiller number including mother stem at booting (55 DAS) and plant height at flowering (65 DAS) were evaluated and plant samples from an area of 50 × 20 cm of the earmarked portion in each plot were collected at CRI, tillering, jointing, heading, soft dough and at maturity. After sampling, the above ground plant samples were dried in an oven at 65–70°C for about 72 h until constant weights were obtained. Then, total biomass production was estimated. The number of earhead m−2, number of spikelets earhead−1, number of grains earhead−1 and test weight of grain were recorded from each plot at maturity. The crop was harvested from 10 m2 area for yield estimation in each plot. After threshing, the grain and straw were dried for 3–4 days and their weights recorded. The grain and straw yields were converted into kg ha−1 and corrected to 12% moisture content. Harvest index was estimated dividing the grain by total biomass (including all above ground dry matter) and expressed in percentage.
Efficiency estimation
The N contents in leaf, stem and grain were measured following the method suggested by Yoshida and Coronel (Reference Yoshida and Coronel1976). The N uptake at maturity was determined by multiplying N concentration with the respective biomass of leaf, stem and grain at maturity. Agronomic N use efficiency (AEN), N recovery efficiency (REN), internal N use efficiency (IEN) and partial factor productivity of applied N (PFPN) as described by Huang et al. (Reference Huang, He, Cui, Roland, Buresh, Gong and Peng2008) and Singh et al. (Reference Singh, Singh, Singh, Thind, Singh, Kaur, Kumar and Vashistha2012b) were computed as follows:
 $$\begin{equation*}
{\rm{AEN\ (kg\ k}}{{\rm{g}}^{ - {\rm{1}}}}{\rm{) = }}\frac{{{\rm{Grain\ yield\ in\ N\ fertilized\ plot\ }} - {\rm{\ Grain\ yield\ in\ control\ plot}}}}{{{\rm{Quantity\ of\ N\ fertilizer\ applied\ in\ fertilized\ plot}}}}.
\end{equation*}$$
 $$\begin{equation*}
{\rm{REN\ (kg\ k}}{{\rm{g}}^{ - {\rm{1}}}}{\rm{) = }}\frac{{{\rm{Total\ N\ uptake\ in\ fertilized\ plot\ }} - {\rm{Total\ N\ uptake\ in\ control\ plot}}}}{{{\rm{Quantity\ of\ N\ fertilizer\ applied\ in\ fertilized\ plot}}}}.\vspace*{-8pt}
\end{equation*}$$
 $$\begin{equation*}
{\rm{IEN\ (kg\ k}}{{\rm{g}}^{ - {\rm{1}}}}{\rm{)}} = \frac{{{\rm{Grain\ yield}}}}{{{\rm{Total\ N\ uptake}}}}.
\end{equation*}$$
 $$\begin{equation*}
{\rm{PFPN\ (kg\ k}}{{\rm{g}}^{ - {\rm{1}}}}{\rm{)}} = \frac{{{\rm{Grain\ yield}}}}{{{\rm{Quantity\ of\ N\ fertilizer\ applied}}}}.
\end{equation*}$$
Statistical analysis
The data were analysed by ANOVA, in completely randomized block design, with three replications (Cochran and Cox, Reference Cochran and Cox1985). The significance of different sources of variation was tested by the error mean square of Fisher Snedecor's ‘F’ test at probability level 0.05. Standard error of mean (SE) and least significant difference (LSD) at 0.05of significance were used to compare treatments. The relationship between SPAD values and grain yield was evaluated through regression analysis.
RESULTS
SPAD level
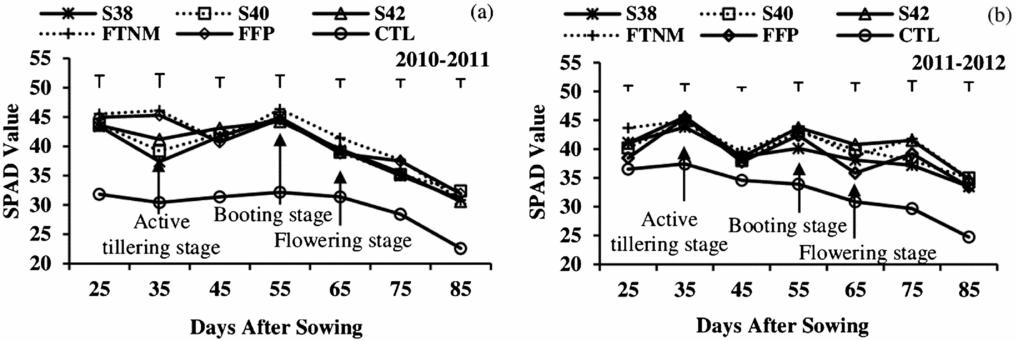
The highest SPAD values were recorded between active tillering (35 DAS) to booting stage (55 DAS) in most of the cases during both years (Figure 1). The SPAD value gradually decreased from booting stage onwards in the first season (2010/11); however, it increased after flowering and decreased gradually in 2011/12.The SPAD value did not vary much among the N management practises after booting stage, mainly during 2010/11. SPAD levels remained 38 or more from active tillering to flowering in all N management practises. Control plot (without fertilizer) recorded the lowest SPAD values, which remained below 38 at all phonological stages during both seasons.
Effect of nitrogen management on Chlorophyllmeter readings in wheat during dry season of 2010/11 (a) and 2011/12 (b). Vertical lines indicate standard error of mean. S = SPAD threshold value averaged for three N top dressings; FTNM = Fixed time nitrogen management; FFP = Farmers’ fertilizer practise; CTL = Control. Arrows indicate the crop growth stages of respective days.

Growth attributes
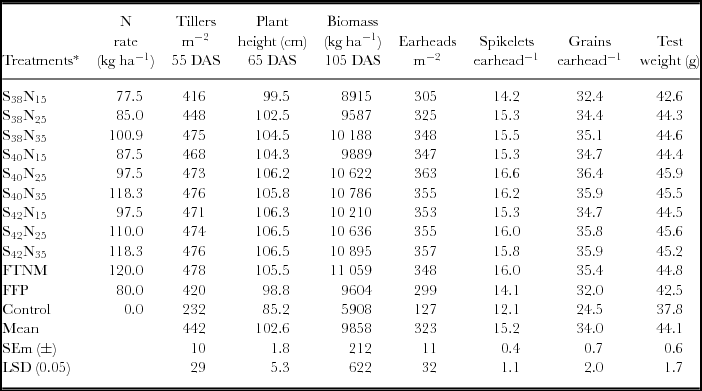
N management practises exerted significant effect on tillering and height of the wheat plants. The crop at low rate of N topdressing at low SPAD (N15S38) produced significantly lower number of tillers m−2 and dwarf plants as compared to those of other N management practises, with exception of FFP and control plots (Table 1). The control plots produced the lowest number of tillers m−2 and dwarf plants, which were significantly, lower than those of all other N management practises. Biomass production also varied markedly among the N management practises, increasing with increasing N topdressing and SPAD level. High (N35) and medium (N25) rate of N topdressing at high (S42) and medium (S40) SPAD levels recorded significantly higher biomass production than that of low N rate (N15) at low SPAD (S38). However, the biomass production among the high (N35) and medium (N25) rate of N topdressing at high (S42) and medium (S40) SPAD levels did not vary significantly (Table 1). The FTNM practise caused higher biomass production than that of low rate of N topdressing at low SPAD; but was comparable to that of medium and high rate of N topdressing at medium and high SPAD levels under RTNM. FFP recorded lower biomass than those of other N management treatments under RTNM and FTNM; but had higher biomass than that of the control plots, which produced the lowest biomass. Medium (N25) rate of N topdressing at medium SPAD (S40) was found most conducive for enhancing vegetative growth of wheat in addition to saving N fertilizer as compared to FTNM.
Effect of nitrogen management practises on growth and yield attributes of wheat (average data over 2 years).

*S = SPAD threshold value; N = Nitrogen top dressing in kg N ha−1 in each application; FTNM = Fixed time nitrogen management; FFP = Farmers’ fertilizer practise; SEm (±) = Standard error of mean; LSD = Least significant difference.
Yield components
The yield components like number of earheads m−2, number of spikelets earhead−1, number of grains earhead−1 and test weight of grain responded well to N management practises. The crop having medium (N25) rate of N topdressing at medium SPAD level (S40) produced the highest number of earheads m−2 (363), spikelets earhead−1 (16.6) and grains earhead−1 (36.4) and recorded the highest test weight of grain (45.9 g). These values were significantly higher than those ones found under low (N15) rate of N topdressing at low SPAD (S38), FFP and control plots; but were comparable to those of other N management practises under RTNM and FTNM (Table 1).The control plots recorded the lowest values of all above yield components of wheat. Medium rate of N topdressing at medium SPAD was the best N management for improving yield components of wheat.
Wheat productivity
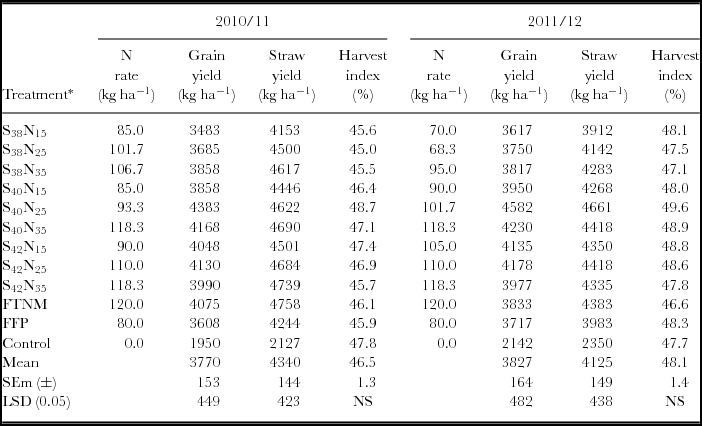
The N management practises exerted significant effect on grain and straw yield of wheat, but they did not affect the harvest index in both seasons (Table 2). Increasing the rate of N application from low (N15) to medium (N25) increased grain yield. Further increase in rate of N application (N35) did not increase the grain yield; rather, it reduced the grain yield at higher SPAD threshold. The highest grain yield (4383 kg ha−1 in 2010/11 and 4582 kg ha−1 in 2011/12) was recorded with medium rate of N topdressing at medium SPAD level (N25S40), which was significantly greater than that of all rates of N topdressing at low SPAD but comparable to that of medium to high (N25-35) rate of N topdressing at medium to high SPAD (S40-42). As compared to that of FTNM, N25S40 also caused similar grain yield in 2010/11 and much higher grain yield in 2011/12. Plants under N25S40 management also presented higher grain yield than that of plants under FFP and control conditions, which recorded the lowest grain yield during both seasons. The highest straw yield (4739 kg ha−1) was reached with high rate of N top dressing at high SPAD level (N35S42) in 2010/11; but, medium rate of N top dressing at medium SPAD level (N25S40) caused the highest straw yield (4661 kg ha−1) in 2011/12 (Table 2). The treatments FTNM, N35S42 and N25S40 had significantly higher straw yield than that of low rate of N top dressing at low SPAD level (N15S38); but were comparable to those obtained with medium to high (N25-35) rate of N top dressing at medium SPAD (S40) and all rates of N top dressing at high SPAD (S42) in both seasons. Plants under FFP had straw yield comparable to most of the N management practises, except that of high rate of N top dressing at high and medium SPAD (N35S42 and N35S40) and FTNM.
Effect of nitrogen management practises on wheat productivity during dry season of 2010/11 and 2011/12.

*S = SPAD threshold value; N = Nitrogen top dressing in kg N ha−1 in each application; FTNM = Fixed time nitrogen management; FFP = Farmers’ fertilizer practise; SEm (±) = Standard error of mean; LSD = Least significant difference.
Nitrogen content and uptake
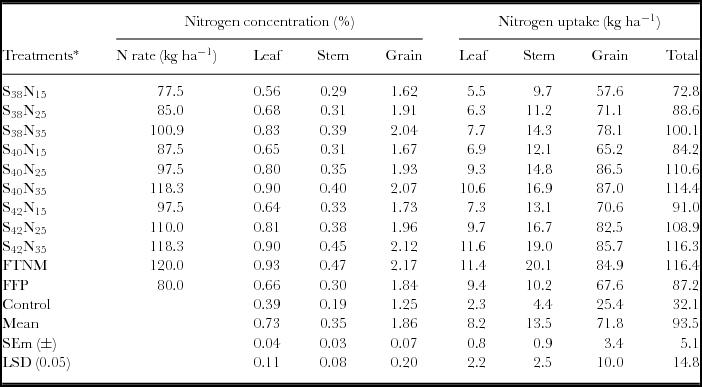
The highest leaf N content was recorded at CRI, thereafter decreasing gradually towards maturity of the crop in both seasons. The N management practises markedly increased leaf N content as compared to that of the control plots, which recorded the lowest leaf N content at all phenological stages (Figure S3). The leaf N content increased due to increasing N topdressing at higher SPAD levels at all growth stages. The crop under FTNM recorded the highest N content in leaf, stem and grain at maturity, which was significantly higher than those of low and medium (N15-25) rate of N topdressing at different SPAD thresholds, FFP and control plots; but comparable to high (N35) rate of N topdressing (Table 3).The lowest N content in leaf, stem and grain was found in the control plot, which was significantly lower than those of all N management practises (Table 3).
Effect of nitrogen management practises on nitrogen content (%) and nitrogen uptake (kg ha−1) in wheat at maturity (average data over 2 years).

*S = SPAD threshold value; N = Nitrogen top dressing in kg N ha−1 in each application; FTNM = Fixed time nitrogen management; FFP = Farmers’ fertilizer practise; SEm (±) = Standard error of mean; LSD = Least significant difference.
The N uptake in leaf, stem and grain increased considerably due to topdressing high (N35) and medium (N25) rate of N at high (S42) and medium (S40) SPAD thresholds (Table 3). Accordingly, high rate of N topdressing at high SPAD (N35S42) and FTNM recorded higher N uptakes in leaf, stem and grain than those of low rate of N topdressing at low to medium SPAD (N15S38-40) and medium rate of N topdressing at low SPAD level (N25S38), FFP and the control plots (Table 3). Medium to high rate of N topdressing (N25-35) at medium to high SPAD (S40-42) threshold caused higher total N uptake than low rate (N15) at all SPAD levels. Similarly N topdressing at medium to high SPAD (S40-42) induced higher total N uptake than that at low SPAD (S38). The highest N uptake (116kg ha−1) was recorded with high rate of N topdressing at high SPAD level (N35S42) and FTNM, which was comparable to other N management practises with exception of low rate of N application at low to medium SPAD levels (N15S38-40). Plants under FFP had lower total N uptake than those in other N management practises, with exception of N15S38 and control plots (Table 3).
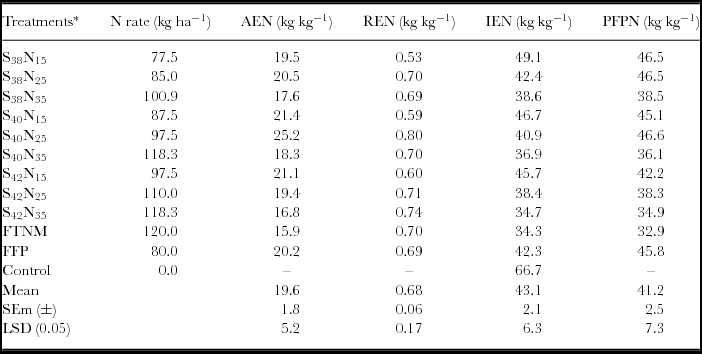
Nitrogen use efficiency
The N management practises exerted significant effect on AEN, REN, IEN and PFPN of wheat. Application of medium rate of N at medium SPAD level (N25S40) recorded the highest AEN and REN, which was greater than those of high (N35) and low (N15) rate of N topdressing at high (S42) and low SPAD (S38) levels, FTNM and FFP (Table 4). N25S40 increased AEN and REN by 29.2 and 50.9% over low rate of N topdressing at low SPAD level (N15S38), 50 and 8.8% over high rate of N topdressing at high SPAD level (N35S42) and 58.5 and 15.1% over FTNM. The IEN and PFPN decreased steadily by increasing the rate of N topdressing in wheat irrespective of SPAD levels. Accordingly, high rate of N topdressing at high SPAD level (N35S42) caused significantly lower IEN and PFPN than those of moderate (N25) and low (N15) rate of N topdressing at medium (S40) and low (S38) SPAD levels (Table 4). FTNM also considerably reduced IEN and PFPN as compared to low to moderate (N15-25) rates of N topdressing at low to medium SPAD levels (S38-40). Moderate rate of N topdressing at medium SPAD level (N25S40) caused higher IEN (+19.1%) and PFPN (+41.5%) than FTNM.
Effect of nitrogen management practises on agronomic N use efficiency (AEN), nitrogen recovery efficiency (REN), internal N use efficiency (IEN) and partial factor productivity of applied N (PFPN) in wheat (average data over 2 years).

*S = SPAD threshold value; N = Nitrogen top dressing in kg N ha−1 in each application; FTNM = Fixed time nitrogen management; FFP = Farmers’ fertilizer practise; SEm (±) = Standard error of mean; LSD = Least significant difference.
DISCUSSION
Application of N fertilizer in right amount at right time (RTNM treatments) caused plant height and tiller production comparable to those of FTNM (Table 1), despite low rate of N application. Tiller production at middle growth stage is the key in enhancing the ear-bearing tillers in wheat (Ling, Reference Ling2000) as ear-bearing tillers play important role in grain formation and productivity of wheat. Medium rate of N topdressing at medium SPAD level (N25S40) recorded high biomass production comparable to those obtained with high rate of N topdressing at medium to high SPAD (N35S40-42) and FTNM (Table 1). High biomass production after blooming leads to high grain yield (Peng et al., Reference Peng, Ying, Guo and Long2012) and crop at FTNM failed to increase biomass production during grain filling period over that of medium and high rate of N topdressing (N25-35)at medium and high SPAD (S40-42) in spite of higher N fertilizer consumption. This was due to luxuriant vegetative growth at early stages without significant effect on reproductive growth (Hussain et al., Reference Hussain, Zia, Akhtar and Yasin2003; Peng et al., Reference Peng, Ying, Guo and Long2012; Pirjo et al., Reference Pirjo, Lauri, Ari and Susanna2009).
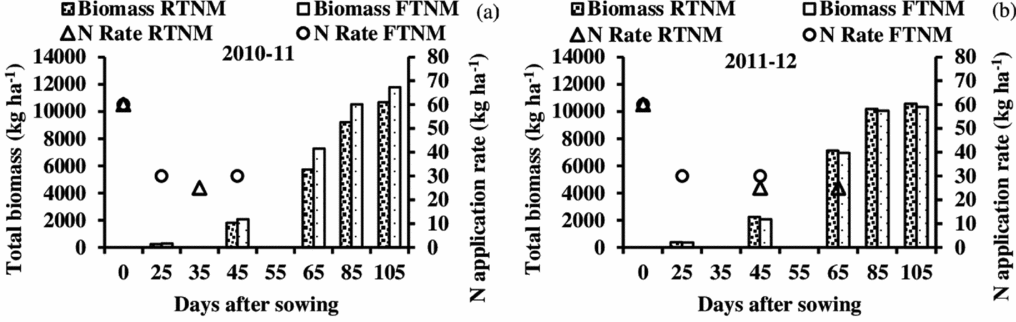
In our study, all RTNM treatments received lower N rate than that of FTNM and the medium rate of N topdressing at medium SPAD (N25S40) was found the most conducive N management in increasing growth and yield of wheat. The first topdressing of N was done at the MT (35 DAS) and at jointing (45 DAS) in N25S40 in first and second season, respectively; but it was at CRI (25 DAS) in FTNM (Figure 2). The results indicated that 60 kg N ha−1 as basal fertilization led to good nutrient supply up to CRI and then the first topdressing of N for wheat might be shifted to the MT or jointing stages. Accordingly, Singh et al. (Reference Singh, Singh, Singh, Thind, Kumar, Singh, Choudhary, Gupta and Vashistha2013) noticed that N topdressing at MT stage could increase wheat yield by 1.0 or 0.5 Mgha−1. Our study showed that total biomass production did not change between RTNM (S40N25) and FTNM, up to jointing (Figure 2). However, biomass production at maturity was comparatively lower in RTNM as compared to FTNM in the first season (Figure 2a) due to omitting the second topdressing of N fertilizer. Sui et al. (Reference Sui, Feng, Tian, Hu, Shen and Guo2013) noticed that biomass production under FTNM was faster than that of optimized N treatments at the vegetative stages, but not at the reproductive stages. Our results indicated that a split application of N fertilizer at flowering increased biomass production after flowering (Figure 2), which led to increases in grain yield despite the basal application and topdressing at CRI. Ling (Reference Ling2000) also reported that wheat yield depends on biomass production after heading or blooming and, therefore, timing of N application plays crucial role in determining the grain yield.
Effect N application under fixed time N management and real-time N management (N25S40) on above ground biomass of wheat during dry season of 2010/11 (a) and 2011/12 (b).

Earhead m−2, grains earhead−1 and test weight (1000-grain weight) were positively associated with the grain yield of wheat (Tables 1 and 2). The increased biomass during flowering and grain filling promoted ear-head production, grain formation and grain growth that finally increased grain yield under RTNM (Ling, Reference Ling2000; Pirjo et al., Reference Pirjo, Lauri, Ari and Susanna2009). The grain yield increased up to the medium rate of N topdressing at medium SPAD (N25S40) and further increase in the N application rate and SPAD value did not increase the grain yield (Table 2). N25S40 produced 13.4% higher grain yield over that of FTNM. Low grain yield in FTNM despite having highest N rate was due to relatively lower number of ear-bearing tillers, grains earhead−1 and lower test weight as compared to those of chlorophyll-based N management in RTNM (Peng et al., Reference Peng, Ying, Guo and Long2012; Singh et al., Reference Singh, Singh, Singh, Thind and Gupta2010; Walsh et al., Reference Walsh, Klatt, Solie, Godsey and Raun2013).
Optimization of SPAD value at critical stages of wheat is most important in regulating growth and maximizing grain productivity and varies with region, season and crop varieties. SPAD threshold of 37 in the eastern Indo-Gangetic Plains and SPAD threshold of 38 in the middle Indo-Gangetic Plains (Singh et al., Reference Singh, Singh, Singh, Thind and Gupta2010) worked well for guiding N fertilization in wheat. However, SPAD threshold of 42 in Pakistan (Hussain et al., Reference Hussain, Zia, Akhtar and Yasin2003) and SPAD threshold of 44 in Bangladesh (Kyaw, Reference Kyaw, Vlek, Denich, Martius and Giesen2003) could be used for guiding N management in wheat. In our study, SPAD 40 and 42 had comparable grain yield, but SPAD 40 had lower N requirement than SPAD 42. Hence, the optimal SPAD threshold for precision N management aiming at increasing grain yield with improving N use efficiency was 40. The relationship between SPAD value and grain yield (y = −14.92x 2 + 1323x – 25273; R 2 = 0.695; r = 0.229 at P = 0.05; n = 72) also suggested that SPAD 40 can be used for determining the timing of N application. The maximum grain yield (4805 kg ha−1) was recorded from average SPAD value of 40.7, which supported the SPAD threshold of 40–41 maintained by topdressing of N at 25 kg ha−1. Then, SPAD-based N management under RTNM could considerably reduce the rate of N application by 6 to 27% of the existing N fertilizer recommendation in FTNM without reducing wheat grain yield. Medium rate of N topdressing at medium SPAD level (N25S40) not only reduced the cost of wheat cultivation by saving N fertilizer but also increased N use efficiency.
Medium rate of N topdressing at medium SPAD level (N25S40) enhanced ear-bearing tillers, translocation of N in the stem and improved grain formation and grain development (Table 1). Higher N uptake in different plant organs in FTNM was mainly due to higher biomass yield without much advantage in grain productivity (Cui et al., Reference Cui, Zhang, Chen, Miao, Li, Shi, Xu, Ye, Liu, Yang, Zhang, Huang and Bao2008; Ling, Reference Ling2000). The lowest N uptake by wheat in control plots was associated with lowest biomass and grain yield (Peng et al., Reference Peng, Ying, Guo and Long2012; Singh et al., Reference Singh, Singh, Singh, Thind, Singh, Kaur, Kumar and Vashistha2012b; Walsh et al., Reference Walsh, Klatt, Solie, Godsey and Raun2013). The increases in AEN and REN with medium rate of N topdressing at medium SPAD was associated with increase in grain yield with less N fertilizer use over that of high rate of N top dressing at high SPAD and FTNM (Diacono et al., Reference Diacono, Rubino and Montemurro2013; Peng et al., Reference Peng, Ying, Guo and Long2012). The chlorophyll-based N management in wheat, thus, appears to be a better option for N management in wheat for increasing wheat yield and N use efficiency.
CONCLUSIONS
The Chlorophyllmeter can be used for measuring leaf N status non-destructively and guiding need-based N application. Herein, a marginal decrease in wheat grain yield at low SPAD level (S38) was noticed as compared to that of FTNM while saving of 21–43% N fertilizer. Maintaining SPAD threshold of 40 with topdressing 25 kg N ha−1 at each time had significant positive effect on grain yield, saving of 18.8% N fertilizer as compared to FTNM. Overall, SPAD-based N management in RTNM (N25S40) increased AEN by 58.5% over FTNM. Then, the SPAD value of 40 was found to be critical for wheat in eastern India. Our results indicated that a split application of N fertilizer after heading increased dry matter accumulation after flowering, which led to increases in grain yield despite basal N application and topdressing at crow root initiation. Our findings strongly suggest the revision of current recommendation in the rate and timing of N fertilizer application, aiming to maintain SPAD value ≥40 up to heading stage and then improving growth and productivity of wheat in the subtropics of eastern India.
Acknowledgements
National Agricultural Innovation Project of Indian Council of Agricultural Research, New Delhi is gratefully acknowledged for funding the research programme.
SUPPLEMENTARY MATERIALS
For supplementary material for this article, please visit https://doi.org/10.1017/S0014479717000035.