1 Introduction
The affordability of state and local public employee defined pension benefits in the USA has been debated since the stock market decline in 2000. The debate became more heated following the 2008 financial crisis and the Great Recession. Media reports, government and academic studies, and surveys have shown that the financial health of public pension plans has deteriorated. In a series of reports covering all 50 states in the USA, the Pew Research Center documented the progression of the unfunded pension liability, which is the difference between pension benefits promised by governments and the assets available to pay those benefits. From 2008 to 2010, the national unfunded liability grew from US$450 billion to 757 billion (Pew Research Center, 2010, 2012). By the end of fiscal year 2013, the funding gap was close to US$1 trillion (National Association of State Retirement Administrators, 2013), and state governments had about 74% of the funds needed to finance promised pension benefits. Illinois has been frequently singled out as having the largest unfunded pension liability, which is currently about US$100 billion.
Pension plans at the local level show similar funding shortages. In a study of 61 large cities in the USA, the Pew Research Center (2013) reported a funding shortage of US$99 billion out of the US$385 billion needed for pension benefits, which represents a funded ratio (amount available vs. amount needed) of 74%. In a large sample of 128 local pension plans in 43 states, Munnell et al. (Reference Munnell, Aubry and Hurwitz2013) found that the average funded ratio in 2011 was 72%.
The fiscal threat of growing unfunded pension liabilities at state and local levels goes beyond the economics of the pension plans themselves. State and local governments are obliged to pay pension benefits in full when due, regardless of funding levels; therefore, the money must be found somewhere.Footnote 1 Barring a sustained outsize performance in the financial market, the money for pensions will eventually be drawn from the same tax and revenue base that is relied upon to pay for critical government services, such as education, public safety, health care, and transportation. Accordingly, the increasing cost of pension benefits is tied to broader state and local government finances and has a negative effect on vital public services.
To understand whether public pension benefits crowd out other government services, the burden of public pension benefits needs to be known. We defined pension burden as the annual government pension contributions that must be paid relative to the ability to pay, or the percentage of total state and local government tax and revenue bases. We posed three related research questions: (1) historically, how burdensome are public pension benefits overall? (2) how much variation in pension burden exists among the 50 US states? and (3) what are the main factors behind this variation? For the first question, a historical analysis of national aggregate data provided a suitable perspective on the evolution of pension burdens. We compared these historical trends to current pension burdens to establish the relative level of pension burdens and to determine whether concerns about the crowding out of other public services are warranted. To address the second research question, national data was used as a benchmark against which state variability in pension burdens was measured. For the third question, we explored the factors behind the variations in pension benefit burdens to address the potential problem of increasing pension burdens.
The findings of this study have important implications for taxpayers, beneficiaries of government services, and state and local government employees. In most cases, pension benefits are an important part of the compensation packages used to attract and retain public sector employees.Footnote 2 Ensuring adequate pension benefits is a long-term strategy for maintaining a quality public sector workforce, which is particularly important in the context of the retiring baby boomer generation – many of these positions will soon need to be refilled. At the same time, the financing of pension benefits competes for funding with other government services that benefit society. Ensuring that public pension benefits are affordable in the long run and account for a reasonable share of government tax and revenue bases is in the best interests of taxpayers and those who benefit from public services.
2 Measuring the burden of pension benefits
While the unfunded pension liability is one way to measure the burden of public pensions, it does not tell the whole story. An absolute increase in the unfunded pension liability by itself may not necessarily raise alarm. What is more important is the ability to service pension liabilities, including the unfunded liabilities. This is very similar to paying off state and local government debt. The total outstanding debt of state and local government has increased steadily over time to US$3.67 trillion in 2013 (Securities Industry and Financial Markets Association, 2014), and unfunded pension liabilities may be considered another form of government debt. Credit rating agencies determine the affordability of state and local government debt by examining the ability of governments to service their debt, or the percentage of tax and revenue bases accounted for by debt service payments. Similarly, we examined the ability of state and local governments to service pension liabilities, including unfunded amounts, by expressing pension financing cost as a percentage of the tax and revenue bases.
To understand the cost of financing pension benefits, we need to briefly discuss the determinants of pension liabilities and pension contribution. State and local public pension benefits are almost always funded in advance of an employee's retirement. In advance funding, at the time of employment, the present value of an employee's all future pension benefits based on a benefit formula in retirement is calculated using a set of demographic and economic assumptions, such as wage growth, retirement age, mortality, inflation and investment return. As all future pension benefits are discounted to present value, the choice of discount rate is of critical importance as the benefits are discounted over such a long period of time. For state and local public pension plans, the choice of the discount rate is the assumed long-term rate of return on pension asset investment, which is now somewhere between 7.5% and 8% for most public pension plans.Footnote 3 Through the same actuarial valuation process, the amount of periodic pension contribution over the working career of the employee will also be determined, so that in combination with the investment income on these pension contributions, sufficient assets will be accumulated to pay for the employee's pension benefit by the time he retires. This periodic pension contribution consists of two parts: normal cost and amortization cost.
The normal cost is part of the overall pension contributions that pay for the pension liabilities incurred when an employee provides certain amount of service. If normal costs are paid each year in full and the assumptions underlying actuarial valuations materialize as expected, then sufficient assets can be accumulated to pay for an employee's benefits. However, if the normal cost is not paid in full and/or if some of the assumptions fail to materialize, an unfunded pension liability can occur. Of these assumptions, the most important is the investment return assumption. Investment earnings account for the majority of accumulated assets, so if the average investment return does not meet expectations, an unfunded pension liability will occur. This liability then needs to be amortized over the remaining working years of an employee, and the annual amount is the amortization cost. In general, the normal cost is shared between the employers and employees and the amortization cost is paid entirely by employers. There are exceptions to this general rule, such as the Arizona State Retirement System, which splits the normal and amortization cost evenly between employers and employees. The portion of the total cost borne by the government employer is called the annual required contribution (ARC). While government employers should pay the full amount of ARC each year, such payment is subject to annual budget appropriation, and thus is at the discretion of the legislative bodies of state and local governments. With few exceptions, there is no real legal mechanism forcing the government to pay the full ARC if it fails to do so. Even though many governments pay the full amount in most years, many governments still do not pay the full amount in some years.
Employer pension contributions come from government taxes and revenues; thus, the true financial burden of pension benefits is best measured by the ratio of the ARC to the tax and revenue bases, although ARC can be subject to change due to changes in the actuarial assumptions. For these calculations, the ARCs of state and local governments must be combined due to the two important characteristics of US public pension plans. The first characteristic is the domination of the US public pension world by about 200 state-level pension plans, out of over 3,000 state and local plans. In 2011, these 200 state-level plans controlled 83 of the assets in all public pension plans and covered 90% of all state and local employees (U.S. Census Bureau, 2011a ).Footnote 4 As a result, most local government pension contributions go to state rather than local pension plans. The second characteristic is the variation in the level of domination by the state-level plans in each state. In some states, such as Hawaii, one state pension plan covers all state and local employees, whereas in other states, such as Pennsylvania and Florida, more local employees are covered by local pension plans.
For government tax and revenue bases, we chose state and local government own-source revenues, as defined by the U.S. Census Bureau (2011b ), which include all general taxes, special taxes and user fees and exclude intergovernmental revenue and utility charges. Compared to total state and local revenue, own-source revenue is a preferred measure of revenue base because state and local governments typically cannot draw on federal grants or utility revenues to pay their pension contribution. Therefore, we constructed the ratio of total government pension contribution to own-source revenue, which should be most appropriate for this study. Ideally, this ratio should also be adjusted to reflect the changes in tax rates over the sample frame and its effect on pension burden. In this study, however, we measure the pension burden of not just 50 state governments, but also all the local governments within each state. While it is possible to collect information on the tax base and rate changes for each state government over time, it is not feasible to collect such information on the 80,000 plus local governments over time. To deal with this problem, we constructed an alternative measurement of pension burden, which compares pension contribution to a broader pre-tax economic base–each state's gross state product (GSP). The rationale is that ultimately, the GSP is each state's tax base in the broadest sense. Changes in GSP also mean changes in the tax base. While our historical and empirical analysis of pension burden is primarily based on the own source revenue, we will also bring in such analysis based on GSP as comparison whenever it is possible.
3 Historical trends
Our first research question asks: historically, how burdensome are public pension benefits overall? The US Census Bureau conducts an annual survey of all state and local pension plans and maintains a record of vital information on many aspects of public pensions, including government and employee annual contributions for each state at the local and state levels (U.S. Census Bureau, 2011a ). This information was used as a source of data on government pension contributions for the present study. In addition, annual records of GSP are maintained by the Bureau of Economic Analysis (BEA). Using these two sources of information, we measured the burden of pension benefits for each state as the ratio of state and local government pension contributions to both total own-source revenue and GSP.
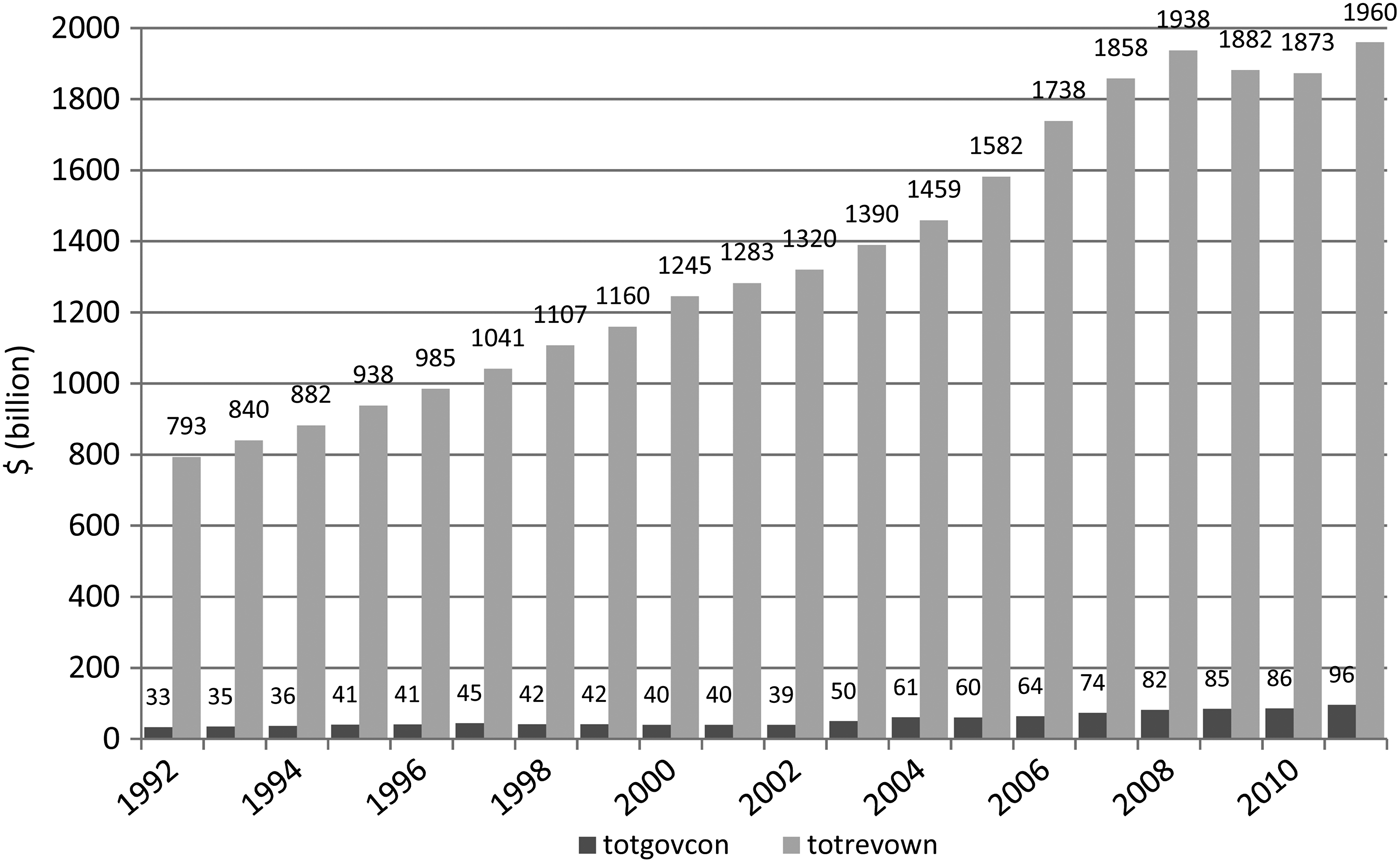
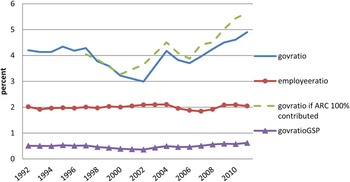
Figure 1 shows government pension contributions and own-source revenues over a 20-year period, from 1992 to 2011, for all 50 US states combined. During that time, the revenue base increased from US$793 billion to US$1.96 trillionFootnote 5 , and government pension contributions increased from US$33 billion to US$96 billion. Figure 2 shows pension contributions by government employers (solid line) and public employees (solid line with circular markers) as a percentage of government own-source revenues, and also government pension contribution as a percentage of GSP (solid line with triangular markers) for all 50 US states over the same period. Government contributions remained at just over 4% of revenue until 1997, then followed a declining trend until reaching a low of 3% in 2002, mostly as a result of booming stock markets in the 1990s. Government contributions then increased to 4.9% of own-source revenues in 2011, the highest level over this 20-year period. In comparison, the ratio of government contribution to GSP showed a very similar pattern, except that its variation over the period was noticeably narrower.
Annual national government pension contributions (dark gray bars), including state and local governments, relative to total own-source revenues (light gray bars) from 1992 to 2011. Values above the bar are the precise amounts in billions of dollars.

Twenty-year trends in national pension burden from 1992 to 2011. Dash line = ARC-adjusted government contributions as a percentage of own-source revenues; solid line = actual government contributions as a percentage of own-source revenues; solid line with circular markers = employee contributions as a percentage of own-source revenues; solid line with triangular markers = actual government contributions as a percentage of GSP.

Nevertheless, the observed increase in government pension contributions as a percentage of tax and revenue bases does not tell the whole story, because in many years over this period, especially in the second half of this period, the actual pension contributions have been less than the required amounts. The US Census Bureau data records actual rather than required government pension contributions. Thus, the true burden of pension costs is best reflected by the percentage of required contributions relative to own-source revenues (dash line).Footnote 6 To calculate required pension contributions, we used data showing the weighted average percentage of ARC paid to state-level pension plans for each state. This information is available from the Pew Research Center, which has maintained records since 1997 (Pew Research Center, 2010, 2011, 2012, 2014). As an example, if the actual amount paid by a state is US$100 and the percentage of ARC paid is 50, then the required contribution amount for that year is US$200.Footnote 7 As shown in Figure 2, the true pension burden has increased in recent years beyond the burden based on actual government pension contributions. For example, in 2011 the required pension contributions as a percentage of own-source revenues approached 6%, which is approximately one percentage point higher than the percentage of revenues accounted for by actual contributions. In dollar terms, this difference equates to almost US$20 billion in unpaid contributions for that year.
The increase in required contributions over recent years and the increasing gap between required and actual contributions have raised pension burdens for state and local governments. Failure to pay the required contributions causes unfunded pension liabilities to increase, which in turn raises amortization costs and places increasing stress on government finances. The above analysis provides some initial evidences that pension benefit costs have a negative impact on government services: since 2002, approximately 2% of government revenues have been redirected toward pension costs and away from other government services. This situation is mitigated to some extent only because governments often fail to pay the required pension contributions in full. As shown in Figure 2, employee contributions as a share of own-source revenues remained fairly stable over this 20-year period, at approximately 2%.
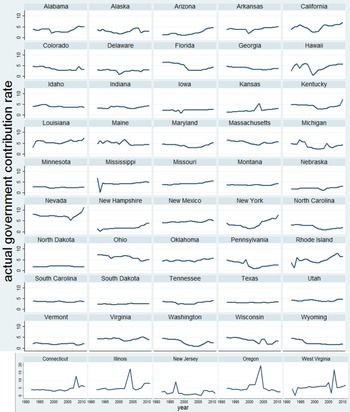
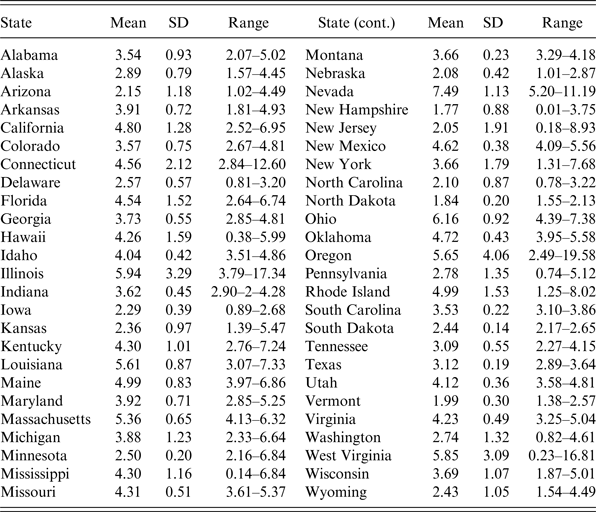
Our historical analysis provides an understanding of public pension burdens at the national level, but it masks the considerable variation in pension burdens among the 50 individual states. Figures 3 shows unadjusted historical trends for pension burdens, or the actual pension contributions as a percentage of own-source revenues, for each of 50 states from 1992 to 2011.Footnote 8 As shown, pension burdens for some states, such as Missouri and South Dakota, remained fairly constant over this period, whereas in other states, such as California, the percentage of own-source revenues accounted for by actual contributions fluctuated considerably. Table 1 lists the mean pension burdens for each state for this 20-year period. The average pension burden varied significantly from 1992 to 2011, from a low of 1.7% in New Hampshire to a high of 7.5% in Nevada. These differences indicate that factors other than financial market performance can affect pension burdens. In the following sections, we explore the factors that contribute to these observed variations.
Twenty-year trends in combined state and local government pension burdens, by state, from 1992 to 2011. The bottom row consists of five states that experienced significant, one-time spike in pension burdens during this period. In West Virginia, the spike was caused by the merger of the teachers’ defined contribution retirement plan into the defined benefit retirement plan in 2006. The other four states experienced a spike due to the one-time issuance of large POBs, the proceeds of which were deposited into pension plans as government contributions.

Average Government Pension Burdens, 1992–2011, by State (in percentage)

Note: States highlighted in gray have a SD greater than 1.
4 Literature review
The financing of pension benefits is affected by the growth of pension assets and pension liabilities, and the ratio of assets to liabilities is the pension funded ratio. Thus the financing issues examined in past literature can generally fall into these two categories: (1) those affecting pension asset value; and (2) those affecting pension liability.
As mentioned earlier, pension assets have two components: pension contributions and investment earnings. For pension contributions, several researchers have studied the relationship between pension contributions, fiscal condition and pension funding level. For example, Marks et al. (Reference Marks, Raman and Wilson1988) showed that state and local government sponsors under tight financial constraints and political pressure provide lower cash contributions to pension plans. Mitchell and Smith (Reference Mitchell and Smith1994) found that unionized employers are less likely to fully fund future pension obligations, especially in the context of fiscal pressures. Mitchell and Hsin (Reference Mitchell, Hsin and Valdes1997) found that pension systems are more likely to underfund their plans during times of fiscal stress. Chaney et al. (Reference Chaney, Copley and Stone2002) found a negative relationship between pension funding levels of state pension plans and fiscal stresses and constitutional requirements to balance state budgets. Munnell et al. (Reference Munnell, Haverstick and Aubry2008a , Reference Munnell, Haverstick, Aubry and Golub-Sass b ) found that when governments paid the full amount of their pension contributions, funded ratios increased by 6%, but fiscal stress caused governments to fall short on their contributions. Munnell et al. (Reference Munnell, Haverstick and Aubry2008a , Reference Munnell, Haverstick, Aubry and Golub-Sass b ) found that fiscal stress was a factor why some government did not pay the full amount of pension contribution. Several studies have also shown that under certain circumstances, governments and retirement systems adopt optimistic actuarial assumptions that allow them to reduce their ARCs or to increase pension funded ratios (Marks et al. Reference Marks, Raman and Wilson1988; Mitchell and Smith, Reference Mitchell and Smith1994; Chaney et al. Reference Chaney, Copley and Stone2002; Hess, Reference Hess2005; Giertz and Papke, Reference Giertz and Papke2007; Vermeer et al. Reference Vermeer, Styles and Patton2010; Stalebrink, Reference Stalebrink2014). Splinter (Reference Splinter2011) also found that if the employee pays a smaller share of pension contributions, then the employer has to pay a larger share. As for the second part of pension assets, Wang and Peng (Reference Wang and Peng2014) found that investment return had a very significant impact on change in funded ratio for pension plans between 2001 and 2009. A higher average return over this period results in a smaller decrease in funded ratio.
In terms of pension liability, Johnson (Reference Johnson1997) examined 102 state-level pension plans from 1983 and 1988, and found positive relationship between underfunding, individual pension benefits, and taxpayer mobility. Chaney et al. (Reference Chaney, Copley and Stone2002), and Coggburn and Kearney (Reference Coggburn and Kearney2010) examined the effect of employee density on pension funding level. Employee density, measured by the percentage of the state population employed in the public sector, is a proxy for the size of government. The authors found that higher employee density is associated with an increase in pension benefits and pension burden. Wang and Peng (Reference Wang and Peng2014) found that generous cost-of-living adjustments from 2001 to 2009 were associated with large decreases in pension funded ratios. Political ideology and unionization have been mentioned as having a potential impact on the pension benefit level. Coggburn and Kearney (Reference Coggburn and Kearney2010) argued that as more liberal states and states with more union membership are more likely to grant more generous pension benefits, there is a potential for more unfunded pension liability.
In summary, many factors that affect the growth of pension assets and liabilities have been identified in the literature, including the percentage of ARC paid, the actuarial assumptions, pension benefit generosity, and investment returns. Other important factors that have been mentioned in the literature include employee contribution share, public employee density, fiscal stress, political ideology, and union membership.
5 Variables and hypotheses
In this section, we developed statistical models to investigate factors that may contribute to the variations in pension burdens among all 50 states, as observed in the ‘Historical Trends’ section. As described above, we constructed two dependent variables using the ratio of annual employer pension contributions to total own-source revenues and GSP for each individual state in the USA for the period 1997–2011 (see Figures 1 and 2 and Table 1 for detailed information on these two dependent variables).
With respect to the independent variables, the factors that affect pension burden can generally fall into three categories based on the literature review: (1) pension assets; (2) pension liabilities; and (3) other miscellaneous control factors. For pension assets, we examined employee contributions and investment returns. Employee contributions were expressed in relation to total pension contributions (employer and employee) for each state. We hypothesized that a negative relationship exists between employee contributions and public pension burdens; in other words, as the share of contributions paid by employee increases, pension burdens for government employers decrease. Investment returns, which are a significant source of revenue for public pension funds, were calculated as the ratio of annual investment earnings in year t to total pension assets at the end of year t−1. Since the vast majority of public pension plans have a smoothing period of 3 years or longer (Standard and Poor's, 2014), we included investment returns lagged for 1, 2, and 3 years. Higher investment earnings in previous years can offset the need for increasing or maintaining the current pension contribution levels; thus, we hypothesized that increased investment returns are associated with lower pension burdens.
In terms of factors related to pension liabilities, we selected six variables to capture their impact on pension burdens. Typically, the more generous the pension benefits, the higher the contributions. In our empirical model, we utilized three variables to capture pension benefit generosity: employee wage growth, benefit multiplier, and cost of living adjustment (COLA) provision. Employee wage growth is the annual percentage change of state full-time employees’ average monthly salaryFootnote 9 . It is directly linked to government pension burden, because higher wage growth rate leads to higher final salary and post-retirement pension benefits for employees. The second proxy for pension liabilities, benefit multiplier, plays a key role in calculating normal retirement benefit. A relatively small increase in the multiplier can mean a significant increase in retirement benefits, as the increase applies to every year of credited service. As a result, states with higher average benefit multiplier should have higher pension burden. Thirdly, COLA adjustment is also a significant pension benefit, because an average retiree is expected to live for many years after retirement. Over time, those state governments that provide automatic or CPI-linked COLA will bear significant higher pension burden than states with no COLA or less stringent forms of COLA (e.g. ad hoc, investment-based, and so forth). For these reasons, we hypothesized a positive relationship between all three variables and pension burden.
The next liability variable examined in this study is Social Security coverage. Social Security benefits constitute an important source of retiree income, but approximately 25% of state and local employees are not covered by social security (Nuschler et al. Reference Nuschler, Shelton and Topoleski2011), and this percentage varies from state to state. Lack of social security coverage calls for higher pension benefits from the employer and thus larger contributions. The effect is that instead of paying payroll taxes to the federal government, the government has to pay more contributions to pension plans. We used a dummy variable to capture Social Security coverage. States with more than 50% of the employees covered by Social Security are coded 1, and otherwise zero. Accordingly, we hypothesized an inverse relationship between Social Security coverage and pension burdens.
The fifth variable in this category is state and local employee density, which is a measure of government size and is expressed as the total number of state and local public employees relative to the state population. We followed the literature and hypothesized that high employee density is associated with heavier pension burdens (Coggburn and Kearney, Reference Coggburn and Kearney2010). The final factor affecting pension liability is union coverage. According to Mitchell and Smith (Reference Mitchell and Smith1994), unions may sometimes exert pressure to improve public plan funding by urging government employers to increase contribution, but they may also use their collective bargaining power to increase salaries, to which employers respond by reducing pension contributions (p. 286). Therefore, we hypothesized that union coverage has an uncertain relationship with government contributions and pension burdens.Footnote 10
As the literature suggests, one important control variable for pension burden is the percentage of ARC paid, which is the percentage of required contributions that are actually paid by governments. The inclusion of this variable is to control for the fact that some states’ pension burdens were artificially lower only because they did not pay the required contributions in full. We hypothesized an inverse relationship between the percentage of ARC paid and the pension burdens.
Other variables controlling for the effects of economic, political, and fiscal factors on pension burdens were also included in our model. We used the growth rate of state personal income as a proxy for economic growth that increases the revenue base. Higher growth rates lead to increased own-source revenue; thus, the relationship between income growth rate and pension burden is expected to be negative. Political ideology affects the design of pension benefits and pension contribution practices. Evidence in the literature generally points to Democrats being more liberal than Republicans in terms of spending; therefore, we expected higher pension burdens for states with a Democratic governor due to more generous pension benefits provision. Fiscal stress impacts pension contributions in several ways. For example, state and local revenues may decrease, and governments may be forced to postpone or cut pension contributions. In this research, we used per capita deficit as a proxy for fiscal stress. It was calculated by dividing the difference between total revenue and total expenditure by state population, and the expected relationship between fiscal stress and pension burdens was uncertain, because fiscal stress might affect both pension contribution and revenue. In addition, some state and local governments issued pension obligation bonds (POBs) during the sample period. Assuming these governments used all or a large part of POB proceeds as pension contributions, in addition to their regular ARC payments, we need to include this variable to control for an artificial increase in pension burden due to this one-time event. Finally, fiscal policies such as tax and expenditure limitations (TELs) may affect the ability of governments to pay a higher percentage of their ARCs because TELs are designed to restrain the growth of government expenditures. Therefore, we expected TELs to be associated with lower pension burden.
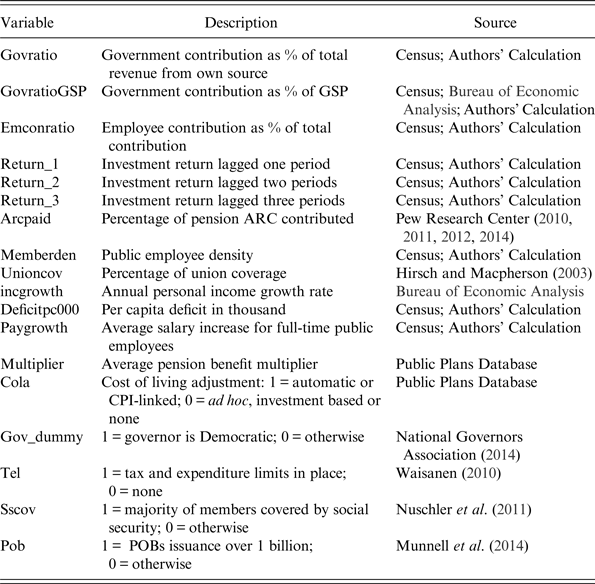
Together, the variables described above provide a model to explain government pension burdens, as shown in Model (I), where i = ith state and t = year. The signs in the parentheses to the right of each variable indicate the expected relationship (positive or negative) to the dependent variable. As a robustness check, we also constructed model (II) where the dependent variable is total government contributions as percentage of GSP. Both models will be estimated in the next section and description of each variable can be found in Table 2.
 $$\eqalign{& govrati{o_{it}}\, = \,f\{ emconrati{o_{it}}\left( - \right),{\rm} return\_{1_{it - 1}}\left( - \right),{\rm} return\_{2_{it - 2}}\left( - \right),{\rm} return\_{3_{it - 3}}\left( - \right), \cr & \matrix{ {arcpai{d_{it}}\left( + \right),{\rm} memberde{n_{it}}\left( + \right),{\rm} unionco{v_{it}}\left( ? \right),{\rm} incgrowt{h_{it}}\left( - \right),} \hfill \cr {deficitpc{{000}_{it}}\left( { + / -} \right),{\rm} paygrowt{h_{it}}\left( + \right),multiplie{r_{it}}\left( + \right),{\rm} col{a_{it}}\left( + \right),} \hfill \cr} \cr & gov\_dumm{y_{it}}\left( + \right),{\rm} te{l_{it}}\left( - \right),{\rm} ssco{v_{it}}\left( - \right),{\rm} po{b_{it}}\left( + \right)\}} $$
 $$\eqalign{& govratioGS{P_{it}}\, = \,f\{ emconrati{o_{it}}\left( - \right),{\rm} return\_{1_{it - 1}}\left( - \right),{\rm} return\_{2_{it - 2}}\left( - \right),{\rm} return\_{3_{it - 3}}\left( - \right), \cr & arcpai{d_{it}}\left( + \right),{\rm} memberde{n_{it}}\left( + \right),{\rm} unionco{v_{it}}\left( ? \right),{\rm} incgrowt{h_{it}}\left( - \right), \cr & deficitpc{000_{it}}\left( { + / -} \right),{\rm} paygrowt{h_{it}}\left( + \right),multiplie{r_{it}}\left( + \right),{\rm} col{a_{it}}\left( + \right), \cr & gov\_dumm{y_{it}}\left( + \right),{\rm} te{l_{it}}\left( - \right),{\rm} ssco{v_{it}}\left( - \right),{\rm} po{b_{it}}( + )\}} $$
Variable description and source

Note: All monetary variables have been converted into 2008 constant dollar.
6 Data and descriptive statistics
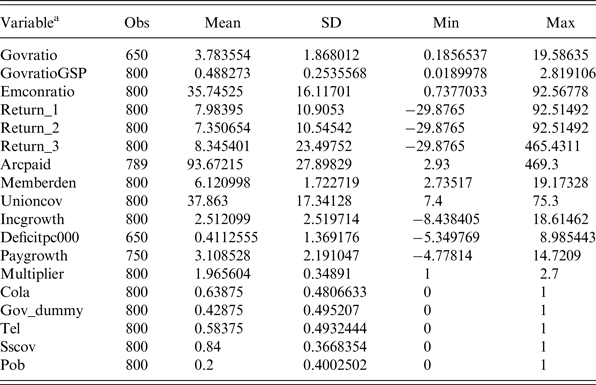
The data for this study came from various sources. Much of the information on variables related to state and local pension contributions, investment earnings, pension assets, and own-source revenues was obtained from the U.S. Census Bureau (2011a , b ). Another important data source for this research is the Public Plans Database (PPD) (2001–2013), which includes plan-level data for almost all state pension plans in the USA since 2001. From this dataset, we collected information on pension benefit multiplier and COLA from 2001 to 2012. And for the few years prior to 2001, we supplemented the dataset with information obtained from the biennial surveys by the Wisconsin Retirement Research Committee. Other data regarding actual contributions as a percentage of ARC, public employee density, union membership, social security coverage, political affiliation of the governor, tax and expenditure limits, and issuance of POBs were obtained from Pew Research Center (2010, 2011, 2012, 2014); the U.S. Census Bureau (2011c ); Hirsch and Macpherson (Reference Hirsch and Macpherson2003); Waisanen (Reference Waisanen2010); Nuschler et al. (Reference Nuschler, Shelton and Topoleski2011); Munnell et al. (Reference Munnell, Aubry and Cafarelli2014) and National Governors Association (2014). Table 2 lists the study variables, their abbreviations, and the source of information for the data, and Table 3 provides descriptive statistics for all study variables. While the historical analysis of all 50 states’ pension burden was conducted over a 20-year period from 1992 to 2011, the empirical model was tested on observations of 50 individual states over a 15-year period from 1997 to 2011. This is because information on one of the key-independent variables, percentage of ARC paid, is available only after 1997.

7 Results
The dataset used in this research is essentially panel data, so panel methods were best suited for the analysis. For comparison purposes, we first estimated a pooled cross-sectional model using the ordinary least squares (OLS) method. To control for year fixed effect, we also included 11 yearly dummy variables with the year 1998 as the base year.Footnote 11 The results of a joint F test of yearly dummy variables were statistically significant (p = 0.0299), so the year dummies were retained in the OLS model. Next, we conducted a Hausman test to determine whether a fixed-effect model was significantly different from a random-effect model. The results indicated that the null hypothesis should be rejected (p = 0.042) in favor of a fixed-effect model. Additionally, social security coverage and POB issuance did not change over the sample period in any state, so these variables were omitted from the fixed-effect model.
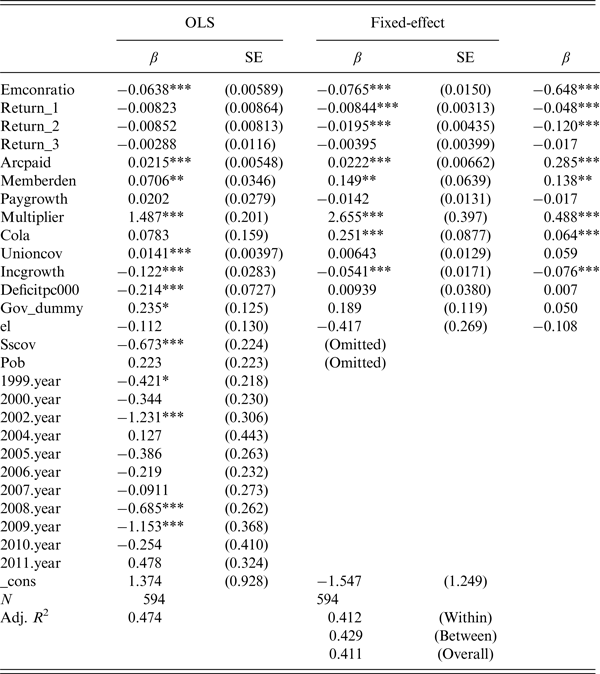
Table 4 presents both the OLS and fixed-effect estimation results of Model (I) for a sample of 594 observations on 50 states over a 15-year period from 1997 to 2011.Footnote 12 The Breusch–Pagan test and the White test both indicated that heteroskedasticity was present in both estimations (p < 0.001), so robust standard errors were used for hypothesis testing. To compare the relative magnitude of each coefficient, we also reported the standardized betas in the last column of Table 4. Overall, the OLS model explained approximately 47% of the variations in pension burdens, while the fixed-effect model explained approximately 41%. As indicated by the overall F test results (p < 0.01), all variables included in the two models were highly significant, and the coefficients were not sensitive to change.
Estimation results of Model I (Dependent = government pension contributions as percentage of total own-source revenue)

Note: Robust SEs were used for hypothesis testing; *p < 0.10, **p < 0.05, ***p < 0.01.
The fixed-effect results reported in Table 4 are generally consistent with our expectations. In regard to pension assets, we found a significant negative relationship between the employee contribution share and pension burden, such that a 1% increase in the employee share of contributions would reduce government pension burdens by about 0.08%. Investment returns that were lagged 1 and 2 years showed a significant negative relationship to pension burden, meaning that higher investment returns from financial markets were associated with reduced pension burden. However, investment returns that were lagged 3 years showed no significant effect on pension burden, probably because the effect of earlier years’ returns gradually taper off as the impact of return in the immediate past year becomes more dominant. The percentage of ARC that is actually contributed by governments, as expected, was significant, indicating that some states’ pension burdens were lower only because they did not pay the full amount of ARC.
In regard to pension liability, the size of government, as measured by public employee density, showed a positive and significant relationship to pension burden such that an increase in employee density of 1% is associated with an increase in pension burden of approximately 0.15%. Personal income growth rate showed a negative and significant effect, such that a 1% increase in income growth rate is associated with a 0.05% decrease in pension burden. The two variables measuring the generosity of provided pension benefits, namely benefit multiplier and COLA provision, were both significant and positively associated with pension burden. In particular, a 1% increase in benefit multiplier will lead to 2.65% increase in pension burden; and state plans with automatic or CPI-linked COLA provision will have a pension burden that is 0.25% higher than state with no COLA or less rigorous forms of COLA. Finally, standardized betas revealed that employee contribution share, investment return, percentage of ARC paid, public employee density and benefit multiplier were the main factors contributing to the observed variations in pension burden across states in our model. Other independent variables, including union coverage, tax and expenditure limits, wage growth, party affiliation of the governor, and fiscal stress, were insignificant.
The pooled OLS model served as a base estimation, and the results were generally comparable to those in the fixed-effect model in terms of significance and the direction of relationship. No variable changed sign, but the coefficient of a few variables differed in significance level. In the OLS estimation, investment return was no longer significant, while COLA provision and governor's party affiliation turned significant. We believe that these observed discrepancies were mainly due to the fact that the pooled data did not take into account the existing differences between each individual state government over the sample frame. The two unique variables in the OLS estimation, social security coverage and year dummies offered some interesting stories. First, when all state governments over the 14 years were pooled together, social security showed an overall negative relationship with pension burden, as predicted. This confirms that states with better social security coverage contributed less to their pension funds and vice versa. Additionally, compared to the base year 1998, pension contribution ratio in the USA were significantly lower in 2002, 2008, and 2009. Not surprisingly, these were the years following the two economic downturns in the 21st century, revealing that state governments some times did cut pension contributions to fight temporary budgetary problems when they were faced with fiscal difficulties.
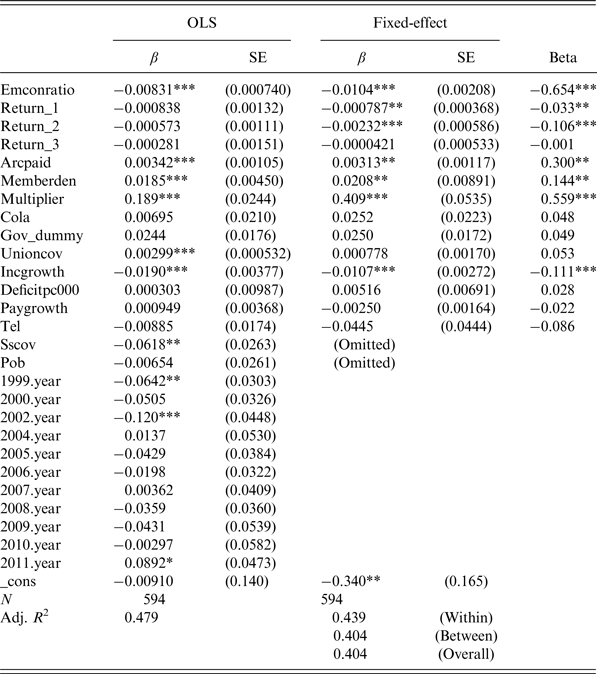
To take account of changes in tax base, we also estimated Model (II) with the ratio of government pension contribution over GSP as the dependent variable and the same set of independent variables. We repeated all above estimation procedures and the results are reported in Table 5. A quick comparison of Table 4 with Table 5 reveals that the estimation results for Model (II) are very similar to those of Model (I), confirming that our model is relatively successful in explaining the variations in pension burden, whether it is measured against government general own-source revenue or GSP. The only noticeable difference between Tables 4 and 5 is that COLA is no longer significant in Model (II). This is probably because COLA has relatively small impact on pension liabilities (as indicated by its standardized coefficient), and our model failed to detect its effect when the dependent variable is constructed using GSP and the variation becomes narrower (see Figure 2).
Estimation results of Model II (Dependent = government pension contributions as percentage of GSP)

Note: Robust SEs were used for hypothesis testing; *p < 0.10, ** p < 0.05, ***p < 0.01.
8 Conclusion and implications
The present study is the first to use large-scale up-to-date data covering an extended period to study government pension burdens. While much of the attention on public pension benefits has focused on pension plan funded ratios and unfunded pension liabilities, we chose a different approach to examine this important public finance issue. We used a historical analysis of the financing costs of pension benefits, expressed as a percentage of total government revenues and GSP, as a proxy for the financial burden of public pension benefits. Our analysis revealed that the financing costs of public pensions have increased significantly in recent years. This burden would have been even higher if not for the fact that some governments failed to pay their required pension contributions in full. Thus, the nationwide burden of pension benefits is increasing and placing more pressure on government finances. By postponing required pension contributions, the true cost of public pension benefits is masked, which increases the pension burden and delays plans to reduce unfunded pension liabilities.
What strategies exist to decrease the burden of pension costs on government finances? Since pension burdens vary significantly from state to state, we developed a statistical model to explore the main factors that contribute to pension burdens. Pension burdens may be reduced by increasing revenues, reducing liabilities, or a combination of both. On the asset side, we looked at employee contributions and investment return. Increasing employee contributions is the easiest and most direct approach. Our results showed that even a small increase in employee contribution share has a significant impact on pension burdens. The decrease in take-home pay for public employees will be offset by the improved long-term sustainability and affordability of public pension benefits in exchange for a relatively small increase in employee contributions.
Another strategy to reduce the pension burden is to improve investment performance. Our results showed that higher investment returns are associated with reduced pension burdens. Average investment returns vary significantly among public pension plans (Wang and Peng, Reference Wang and Peng2014). While this is certainly not a call for blindly pursuing a high-risk and high-return investment strategy, at least for those plans with very low average long-term returns (of which there are quite a few) relative to their peers, they need to reevaluate their investment and asset allocation strategies to determine whether anything can be done to improve investment performance to at least the national average.
Another important lesson on the asset side from this historical analysis of pension burdens is the management of volatility in government pension contributions. Over the 20-year period covered by this study, the pension burden decreased from 4% to 3% over the first 10 years and increased to 5% over the second 10 years, primarily due to increases and decreases in investment earnings as a result of stock market performance. Had state and local governments not substantially reduced their pension contributions and, instead, maintained their contributions at a more consistent level during strong economic periods, they would have been in a much better position to deal with increasing pension costs later on. In the future, a more consistent funding policy over economic and financial cycles may help to ensure that a higher percentage of required government pension contributions are paid.
Strategies that aim to control pension benefits and thereby reduce pension liabilities are more difficult to employ. This study found that a larger work force relative to the population leads to increased pension burdens. Thus a strategy to reduce the work force without compromising the provision of public services should be pursued. As for the pension benefit itself, the study also shows, not surprisingly, that more generous benefits, measured by benefit multiplier and COLA, also results in higher pension burden. However, reduction in pension benefits, in the form of lower benefit multiplier and less generous COLA, will have minimal impact on existing pension burdens because such reduction rarely applies to existing employees and retirees. Even though some state and local governments have tried, the courts in most cases find such changes to existing employees and retirees unlawful.Footnote 13 It remains to be seen whether courts in some part of the country will have a different opinion in the future or state and local governments can devise different strategies in reducing the pension benefits for current employees and retirees.
The findings of this study demonstrate that state and local governments are in a difficult financial situation. Since pension liabilities cannot easily be reduced, state and local governments seek to address increasing pension burdens, at least in part, by failing to pay the full amount of their required contributions. This situation only serves to increase unfunded liability and reduce the pension funded ratio, which results in more pension contributions being required in the future. One silver lining in our findings is that economic growth has the potential to help reduce pension burdens, as it increases the tax and revenue base from which pension contributions are made. Once the US economy has healed from the pernicious effect of the Great Recession and enjoys more healthy growth again, the heavy pension burden can potentially be reduced to some extent.