



Introduction
In Brazil, soybean stands out as one of the main commodities of major relevance to the country's economy, showing high production and leading exports. The soybean production in Brazil was 135.4 million tons in the 2020/2021 harvest year, reinforcing Brazil's leading position in the international market (USDA 2021).
Paraná stands out among the soybean-producing states, being the second largest producer in Brazil and responsible for 14.6% of the production in the 2020/2021 harvest year. However, the state's production showed a 5% reduction in relation to the 2019/2020 harvest year, mainly owing to weather conditions (CONAB 2021).
Climatic factors directly influence the development, quality, and productivity of agricultural crops (Stansel and Fries, Reference Stansel and Fries1980; Baldisera and Dallacort, Reference Baldisera and Dallacort2017). In this sense, knowledge of meteorological conditions and productivity trends helps agribusiness companies and official bodies identify and manage the risks associated with extreme weather events, such as droughts and floods.
With accurate information about the cultivated area and expected productivity, agribusiness companies and official bodies can make more assertive decisions regarding when and how to market their crops. Furthermore, this information is relevant for monitoring agricultural production, predicting food supply, and taking preventive measures in the event of shortages or food crises (MAPA 2022). Producers also need this information so that they can, based on stocks and expected future prices, make decisions regarding the crop to be cultivated and also choose the best sowing time, aiming for greater productivity.
Therefore, the sowing time for annual crops depends on the occurrence of precipitation and temperature conditions, which may differ between regions (Oliveira and Padovani, Reference Oliveira and Padovani2017). Rainfall is the main source of water for plants and affects practically all physiological and biochemical processes. The amount and distribution of precipitation affects the availability of water in the soil, which is essential for plant growth. Lack of rain can lead to drought and water stress, whereas excess rain can cause waterlogging and drainage problems (Farias et al., Reference Farias, Nepomuceno and Neumaier2007; Cohen et al., Reference Cohen, Zandalinas, Huck, Fritschi and Mittler2021).
Air temperature regulates plant growth and development rates (Serio et al., Reference Serio, Spescha and Murphy2006). Furthermore, other variables such as solar radiation and potential evapotranspiration influence agricultural production. Solar radiation provides the energy necessary for photosynthesis, which is essential for plant biomass production. The amount of sunlight directly affects the growth rate and yield of crops (Taiz and Zeiger, Reference Taiz and Zeiger2009).
The relationship between climate variables and agriculture is fundamental to the success of a production system (Baldisera and Dallacort, Reference Baldisera and Dallacort2017). The climate directly influences the growth, development, and productivity of crops. In this way, strategies such as carrying out agro-climatic zoning make it possible to understand the climatic characteristics of a given region and determine the best agricultural practices and crops that are most suitable for that environment (Ribeiro et al., Reference Ribeiro, Dallacort, Barbieri, Santi and Ramos2015).
However, in places with continental characteristics, such as Brazil, on-site monitoring of these variables is a difficult and costly task to carry out. Therefore, agricultural monitoring with remote sensing allows monitoring of the crop throughout its cycle, ultimately generating a more objective estimate of the agricultural harvest (Johann et al., Reference Johann, Becker, Uribe-Opazo and Mercante2016; Becker et al., Reference Becker, Johann, Richetti and Silva2017; Paludo et al., Reference Paludo, Becker, Richetti, Silva and Johann2020). Using remote sensing techniques, Becker et al. (Reference Becker, Richetti, Mercante, Esquerdo, Silva Junior, Paludo and Johann2020) identified phenological patterns with periods of growth and senescence based on vegetation index data for agricultural crops from the Moderate Resolution Imaging Spectroradiometer (MODIS) sensor. Using these techniques, the authors monitored the vegetation phenology quickly and on a large scale.
Furthermore, remote sensing allows the acquisition of a vast amount of agrometeorological and crop development data, both spatially, and temporally, often generating Big Data (Corea, Reference Corea2019). In this context, we sought to understand the spatial and temporal variability of climatic variables and the crop vegetation index, both at the global and regional levels, using multivariate analysis techniques, such as exploratory factor analysis (EFA) and clustering.
Cluster analysis techniques were used by Johann et al. (Reference Johann, Rocha, Oliveira, Rodrigues and Lamparelli2013), who identified five homogeneous regions that characterized the temporal dynamics of the normalized difference vegetation index (NDVI) obtained by the Satellite Pour l'Observation de la Terre (SPOT) satellite for soybean-producing municipalities in Paraná.
This technique was also used by Shirin and Thomas (Reference Shirin and Thomas2016) and Sathiaraj et al. (Reference Sathiaraj, Huang and Chen2018), who collected daily precipitation and temperature information to characterize homogeneous regions in India and the United States.
Other studies used EFA and clustering techniques to characterize an agricultural region, such as Bianchi et al. (Reference Bianchi, Oliveira, Pinto, Andreoli and Garnica2016), who evaluated the production of sugarcane, corn, cassava, and soybeans in the middle Paranapanema region, in the state of São Paulo, and Grzegozewski et al. (Reference Grzegozewski, Cima, Uribe-Opazo, Johann and Guedes2020), who evaluated three consecutive harvest years of soybean cultivation, in relation to the variables precipitation, potential evapotranspiration, solar radiation, minimum, average, and maximum temperatures, improved vegetation index (EVI), and soybean productivity to identify five homogeneous regions, for the municipalities of the state of Paraná.
The aim of this study is to evaluate homogeneous regions for soybean cultivation in Paraná. Previous studies, such as those by Lopes et al. (Reference Lopes, Marcolin, Johann, Vilas Boas and Schuelter2019), Gebert et al. (Reference Gebert, Kist and Virgens Filho2018), Richetti et al. (Reference Richetti, Cima, Johann and Uribe-Opazo2018), and Nascimento et al. (Reference Nascimento, Silvestre and Neto2020), used few climatic variables and did not consider the phenological stages of soybeans. The integration of meteorological variables and the vegetation index (EVI) with the phenological stages, in 25 km data in Paraná, has not yet been done. To fill these gaps, three agricultural scenarios were evaluated to regionalize the state, considering decadal metrics and the European Centre for Medium-Range Weather Forecasts (ECMWF) grid, aiming to define an agroclimatic regionalization for soybeans, the state's main crop.
Materials and methods
Data and metrics
The study area encompasses the state of Paraná, Brazil, limited to 22°29'S and 26°43'S, and 48°2’W and 54°38’W, respectively. The state is subdivided into ten mesoregions (representing territorial units with homogeneous physical, economic, and social characteristics), totalling 399 municipalities (IBGE, 2018) (Fig. 1(a)).
Flowchart representing: (a) Study area, state of Paraná. (b) Summary of methodological steps for data acquisition: European Centre for Medium-Range Weather Forecasts (ECMWF). (c) Various information on meteorological variables at each virtual station. (d) Data acquisition: Moderate Resolution Imaging Spectroradiometer (MODIS). (e) Generation of the average enhanced vegetation index (EVI) profile for each VS. (f) sowing date (SD), date of maximum vegetative development (DMVD) and harvest date (HD) estimates for each virtual station.

To carry out this study, data from the enhanced vegetation index (EVI), meteorological variables, such as rainfall (mm) were used; minimum, average and maximum air temperature (°C); solar radiation (MJ/m2/day); potential evapotranspiration (mm) by the Penman–Monteith method; and climatological water balance (mm), proposed by Thornthwaite and Mather (Reference Thornthwaite and Mather1955), was calculated by taking the difference between precipitation and potential evapotranspiration (Pereira et al., Reference Pereira, Angelocci and Sentelhas2002), and the weighted average productivity of soybeans.
These meteorological variables were selected because they are critical for agricultural production and directly influence final productivity (Fontana et al., Reference Fontana, Berlato, Lauschner and Mello2001; Krüger et al., Reference Krüger, Fontana and Melo2007).
Based on the precipitation information from the ECMWF, three crop years (2011/2012, 2013/2014, and 2015/2016) were evaluated, representing different agrometeorological scenarios within a historical series from 2000/2001 to 2015/2016.
The 2011/2012 crop year showed typical drought behaviour, with the lowest average precipitation values. The 2015/2016 crop year, on the other hand, was characterized as rainy, with the highest average precipitation values. The 2013/2014 crop year had a precipitation close to the average of the historical series evaluated. As it was not possible to explore the entire time series, we selected crop years with these distinct characteristics to understand the productivity patterns under these conditions.
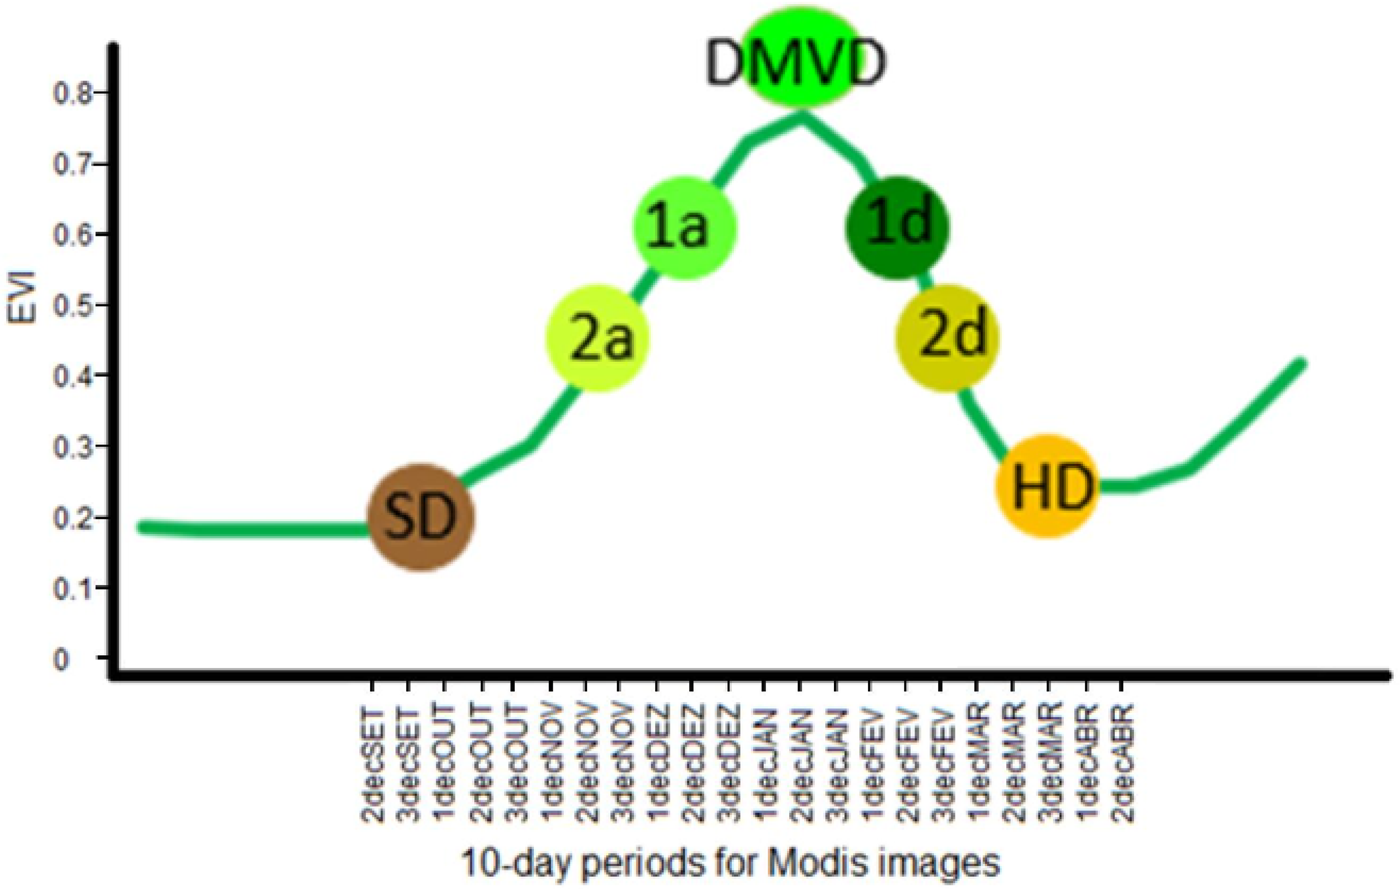
Furthermore, precipitation, which presents great spatial and temporal variability, is one of the most important climatic elements in agriculture because of its significant influence on all stages of plant development. Generally, it is the variable that most affects the final productivity of soybeans (Neumaier et al., Reference Neumaier, Nepomuceno and Farias2021). Using data from the EVI, meteorological variables, and estimates of sowing dates, maximum vegetative development and harvest, associated metrics were generated at 10-year intervals, considering the entire soybean crop cycle in Paraná (Figs 2 and 3(a)).
Representation of the soybean crop cycle, with sowing date, maximum vegetative development and harvest, and the 10-day periods close to date of maximum vegetative development. EVI, enhanced vegetation index; SD, 10-day sowing period; 2a, Two 10-day periods before DMVD; 1a, One 10-day period before DMVD; DMVD, 10-day period of maximum vegetative development; 1d, One 10-day period after DMVD; 2d, Two 10-day periods after DMVD; HD, 10-day harvest period; 2decSET, 3decSET: second and third 10-day periods in September. 1decOUT, 2decOUT, 3decOUT: first, second and third 10-day periods in October. 1decNOV, 2decNOV, 3decNOV: first, second and third 10-day periods in November. 1decDEZ, 2decDEZ 3decDEZ: first, second and third 10-day periods in December. 1decJAN, 2decJAN, 3decJAN: first, second and third 10-day periods in January. 1decFEV, 2decFEV, 3decFEV: first, second and third 10-day periods in February. 1decMAR, 2decMAR, 3decMAR: first, second and third 10-day periods in March. 1decABR, 2decABR, 3decABR: first, second and third 10-day periods in April.
(a) Description of the variables and the acronyms that represent them, associated with 10 years, generated from the sowing date, date of maximum vegetative development and harvest date. SD: Sowing 10-day period, DMVD: 10-day period of maximum vegetative development, HD: Harvest 10-day period. (b) Metrics of meteorological variables and EVI associated with 10 years with the respective phenological stages of soybean, in each crop year. V: Value; S: Sum; VE: Emergence; VC: Cotyledon; R1: Beginning of flowering. R2: Full flowering. R3: Beginning of legume formation. R4: Full pod formation. R5: Grain filling. R6: Full grain. R7: Beginning of maturation. R8: Full maturation.

Enhanced vegetation index – EVI metrics
For the EVI, 14 metrics were generated associated with the 10-year period of the soybean cycle for each crop year analysed (Figs 2, 3(a, b)). To determine the metrics, EVI images from the MOD13Q1 and MYD13Q1 products from the MODIS sensor were initially used, with a spatial resolution of 250 m and a temporal resolution of 8 days (Fig. 1(d) and (e)) (NASA, 2019).
The spectro-temporal profile of the EVI was analysed for the harvest years 2011/2012, 2013/2014 and 2015/2016, using soybean mapping carried out by Souza et al. (Reference Souza, Mercante, Johann, Lamparelli and Uribe-Opazo2015), Grzegozewski et al. (Reference Grzegozewski, Johann, Uribe-Opazo, Mercante and Coutinho2016), and Verica (Reference Verica2018), respectively. EVI values were extracted from the pixels of these mappings between scenes 225(13/08) and 120(30/04) using the tenth day corresponding to the date of the scene for this study. The IDL (Interactive Data Language) programming language was used (Esquerdo et al., Reference Esquerdo, Zullo Júnior and Antunes2011).
With the EVI values on the decennial scale, ArcGis 10.3 software (ESRI, 2018) was used to obtain the EVI spectral profile at each virtual station (Fig. 1(e)). These profiles were analysed using TIMESAT software (Eklundh and Jönsson, Reference Eklundh, Jönsson, Kuenzer, Dech and Wagner2015), through the TSM_GUI module, and using the Savitzky–Golay filter (Savitzky and Golay, Reference Savitzky and Golay1964). This allowed the analysis of temporal vegetation index profiles, generating data on the sowing date (SD), date of maximum vegetative development (DMVD), harvest date (HD), and crop cycle duration (CC) (Johann et al., Reference Johann, Becker, Uribe-Opazo and Mercante2016; Becker et al., Reference Becker, Richetti, Mercante, Esquerdo, Silva Junior, Paludo and Johann2020).
For each virtual season and harvest year, the sowing date, date of maximum vegetative development and harvest date were identified, which were rescheduled to 10 days, that is, according to the date found, they were assigned to the 1st, 2nd or 3rd tenth of the month (Fig. 1(f)).
During the process of estimating these data, the virtual stations were evaluated for the EVI spectral profile. Some of these virtual stations showed deviations such as high variability during the cultivation period, regions with low crop cultivation, and edge regions. The profiles that did not present a spectro-temporal pattern of EVI characteristic of soybeans were eliminated from the data set, leaving, respectively, for 2011/2012, 2013/2014 and 2015/2016, a number of 251, 245 and 268 virtual stations.
Weather metrics
For each of the meteorological variables, precipitation, potential evapotranspiration, water balance, solar radiation, and minimum, average, and maximum temperatures, 14 metrics were generated and associated with the 10-year period of the soybean cycle for each crop year analysed (Figs 2, 3(a, b)).
Meteorological data were obtained from the ECMWF model (ECMWF 2012) at a regular spatial resolution of 0.25 ° (± 25 × 25 km) longitude and latitude. For each point on this grid, called virtual station, information was obtained on the following variables: rainfall; minimum, average and maximum air temperature; Solar radiation; potential evapotranspiration by the Penman–Monteith method; and climatological water balance, proposed by Thornthwaite and Mather (Reference Thornthwaite and Mather1955), was calculated by taking the difference between precipitation and potential evapotranspiration (Pereira et al., Reference Pereira, Angelocci and Sentelhas2002). These variables were made available hourly to obtain the daily average for each variable.
Thus, 14 metrics were generated for the EVI and 98 for the meteorological variables, totalling 112 metrics associated with the 10-year period of the soybean cycle.
Metrics associate with soybean phonological stages
Variables associated with the phenological stages of soybean crops were generated. To prepare them and estimate the number of days and 10 days per phenological stage, the works of Fehr and Caviness (Reference Fehr and Caviness1977), Doorenbos and Kassam (Reference Doorenbos and Kassam1979), Kaster and Farias (Reference Kaster, Farias and Embrapa2011), and Thomas (Reference Thomas2018) were used (Table 1).
Number of days and ten-day periods (in between parenthesis) estimated by phenological stage based on the 120-day cycle proportion

SD, 10-day sowing period; VE, Emergence; V,: Cotyledon; V1, First node; V(n), nth node; R1: Beginning of flowering. R2: Full flowering. R3: Beginning of legume formation. R4: Full pod formation. R5: Grain filling. R6: Full grain. R7: Beginning of maturation. R8: Full maturation.
In this way, metrics associated with the phenological stages and the intervals between them were obtained, considering the accumulated sum of the EVI and the meteorological variables (precipitation, potential evapotranspiration, solar radiation, and water balance), in addition to the average for the meteorological temperature variables (minimum, average, and maximum), as shown in Fig. 3(a).
Thus, 29 metrics were generated for the accumulated sum and 29 metrics for the accumulated average associated with the phenological stages and the intervals between them, totalling 232 metrics. For each crop year, the database was composed of 112 metrics associated with 10-year periods and 232 metrics associated with phenological stages, totalling 344 metrics.
For the two groups of metrics - associated with decennials and phenological stages - a preliminary analysis was carried out to calculate the canonical correlation coefficient between these two groups to assess the existence of an association between the metrics generated by decennials and stages. phenological. The canonical correlations were greater than 0.90 for the three crop years, indicating the variables generated for the two groups are similar.
Therefore, we chose to use only the metrics associated with 10 years (Fig. 3(a)), as they are simpler to obtain in future applications of this methodology. However, in the discussions, the metrics associated with 10-day periods were related to the metrics associated with phenological stages (Fig. 3(b)) for a better agronomic understanding.
It was found that there is high variability in phenological stages in relation to 10-year intervals throughout the soybean cycle in Paraná. For example, in the 2011/2012 and 2015/2016 harvest years, on the date of maximum vegetative development, soybeans were between the beginning of legume formation and full pod formation stages (R3 and R4, Fig. 3(b)), whereas that in 2013/2014, soybeans were in the full flowering and beginning of legume formation stages (R2 and R3, Fig. 3(b)). As a result, the phenological stages of soybeans were independently characterized for each crop year (Fig. 3(b)).
Thus, if the soybeans were in the R3 stage in the virtual station, for example, the 10-day interval, 1a_R3_1d, (one 10-day before the R3 stage and one 10-day after) was described, which corresponds to the R2 to R4 stages, and so on for the next 10-day intervals, until completing the soybean cycle with the corresponding phenological stages.
Exploratory factor analysis and dimensionality reduction
Considering the large number of metrics associated with EVI and meteorological variables for each crop year under study, an EFA was performed (Fig. 4) to reduce the dimensionality and evaluate the structure of the metrics through their correlations with the factors (Hair et al., Reference Hair, Black, Babin and Anderson2014).
Flowchart corresponding to the analysis of the profile of virtual stations within each group. The relationships between the decennial metrics associated with the enhanced vegetation index (EVI) and the meteorological variables and factors (direct (positive) or inverse (negative)). The value of the metrics in the group is called an indicator (high (positive) or low (negative)); these indicators are high or low in relation to the doctor in the group.

After organizing and reading the data, a correlation matrix was obtained using Pearson's linear correlation. The adequacy of the correlation matrix was verified using Bartlett's Test of Sphericity and the KMO Index (Hair et al., Reference Hair, Black, Babin and Anderson2014). Eigen extraction was performed using principal component analysis, and the retention of factors in the EFA followed Kaiser's (Reference Kaiser1958) criteria (eigenvalues λ > 1) in addition to considering a minimum percentage of 70% of the total variability of the metrics associated with the EVI and meteorological variables explained by the factors (Ferreira, Reference Ferreira2018). The varimax orthogonal rotation method was used (Damásio, Reference Damásio2012; Hair et al., Reference Hair, Black, Babin and Anderson2014). With the factors retained, their scores were estimated for each virtual station. Pearson's linear correlation was verified between the variables and factors, with a correlation above 0.60. Furthermore, the direct or inverse relationship between variables and factors was evaluated (Fig. 5). With these scores, it was possible to perform cluster analysis (Fig. 4).
Flowchart corresponding to the stages of individual and global analysis of metrics associated with enhanced vegetation index (EVI) and meteorological variables, using multivariate methods. Steps in constructing the Moran scattering map from productivity data.

Grouping of meteorological zones and EVI
To obtain these groups, tests were carried out using hierarchical methods and the non-hierarchical k-means method (MacQueen, Reference MacQueen1967), using Euclidean distance as a measure of dissimilarity. The hierarchical methods did not provide adequate values for the cophenetic correlation coefficient. Therefore, the non-hierarchical k-means method was used to form similar groups (Fig. 4).
The optimal number of groups was determined using the following cluster validation indices: Calinski–Harabasz (CH) (Calinski and Harabasz, Reference Calinski and Harabasz1974), Dunn (Dunn, Reference Dunn1974), silhouette index (ISil) (Rousseeuw, Reference Rousseeuw1987), DB index (Davies and Bouldin, Reference Davies and Bouldin1979), C index (Hubert and Levin, Reference Hubert and Levin1976), SD index (Halkidi et al., Reference Halkidi, Vazirgiannis and Batistakis2000), CCC (Sarle, Reference Sarle1983), Scott (Scott and Symons, Reference Scott and Symons1971), and KL index (Krzanowski and Lai, Reference Krzanowski and Lai1988).
To evaluate the profile of the virtual stations belonging to each group, the relationships (direct or inverse) between the variables and factors as well as the score of each factor within each group (high or low) were verified. With this, the value of the variable in the group, called an indicator (high or low), was obtained, as shown in Fig. 5.
Individual analysis
Fourteen metrics were used for individual analysis (Fig. 3(a)) associated with the EVI and meteorological variables. The EFA and grouping were carried out with the metrics associated with the EVI and the meteorological variables individually, resulting in maps with the groupings of metrics for each meteorological variable and the EVI in each crop year (Fig. 6).
Regionalization of Paraná for individual analysis, considering the factorial scores of the virtual stations through cluster analysis, in relation to the metrics associated with the enhanced vegetation index (EVI) and indirect variations in each crop year, 2011/2012, 2013/2014, 2015/2016. (a) EVI (2011/2012), (b) EVI (2013/2014), (c) EVI (2015/2016), (d) Precipitation (2011/2012), (e) Precipitation (2013/2014), (f) Precipitation (2015 /2016), (g) Potential Evapotranspiration (2011/2012), (h) Potential Evapotranspiration (2013/2014), (i) Potential Evapotranspiration (2015/2016), (j) Solar Radiation (2011/2012), (k) Solar Radiation (2013 /2014), (l) Solar Radiation (2015/2016), (m) Water Balance (2011/2012), (n) Water Balance (2013/2014), (o) Water Balance (2015/2016), Temp: Temperature, (p) Minimum Temp (2011 /2012), (q) Minimum Temp (2013/2014), (r) Minimum Temp (2015/2016), (s) Average Temp (2011/2012), (t) Average Temp (2013/2014), (u) Average Temp (2015 /2016), (v) Maximum Temp (2011/2012), (w) Maximum Temp (2013/2014), (x) Maximum Temp (2015/2016). VE – R5, phases from sowing to grain filling; R2 – R5, phases from the beginning of flowering to grain filling; R5 – R8, stages from grain filling to maturation; DS – DC, 10 years from sowing to 10 years from harvest.

Global analysis
For the global analysis, 14 metrics (Fig. 3(a)) associated with the EVI and meteorological variables were also used. The EFA and grouping were performed considering all metrics simultaneously (totalling 112 metrics analysed), resulting in a single map with the groupings of all metrics associated with the EVI and meteorological variables for each crop year (Fig. 7). The stages of these analyses are illustrated in Fig. 5.
Regionalization of Paraná for global analysis, considering the factorial scores of the virtual stations through cluster analysis, in relation to the metrics associated with the EVI and meteorological variables in each crop year. Productivity information in each group of the respective harvest year. Moran scatter map for productivity for the respective crop year. (a) 2011/2012. (b) 2013/2014. (c) 2015/2016. VE – R5, phases from sowing to grain filling; R2 – R5, phases from the beginning of flowering to grain filling; R5 – R8, stages from grain filling to maturation; DS – DC, 10 years from sowing to 10 years from harvest (Fig. 3(b)).

Individual analysis allows the visualization and understanding of the spatial pattern of metrics associated with each of the meteorological and EVI variables. In global analysis, although it does not provide this specific visualization, it allows us to understand the pattern of metrics associated with the EVI and meteorological variables in a joint analysis.
Integration of soybean productivity data by municipality with the ECMWF grid
As the information on the EVI metrics and meteorological variables was integrated with the ECMWF grid on the Paraná map, it was also necessary to obtain information on the average soybean productivity in each ECMWF virtual station. To carry out this integration, it was initially verified which municipalities make up each virtual station and the percentage of areas of these municipalities in each virtual station.
Soybean productivity data (t/ha) were obtained from the 399 municipalities in the state of Paraná, from the Brazilian Institute of Geography and Statistics (IBGE) (IBGE, 2012, 2014, 2015) (Fig. 5). There were no average productivity data in 37, 28 and 23 municipalities for the harvest years 2011/2012, 2013/2014 and 2015/2016, respectively, due to the absence of soybean production.
For each virtual station, the Weighted Average Productivity (WAP) (Equation (1)) was calculated considering only the municipalities that present soybean production.

where WAP is the Weighted Average Productivity value, a i is the percentage of the area of the ith municipality within the virtual station, p i is the productivity of the ith municipality with p i ≠ 0 and i = 1,…,n where n is the number of municipalities within the virtual station.
Spatial indicators
Moran's Local Index (Equation (2)) was used to identify virtual stations that were distinct in terms of productivity in relation to other virtual stations.

where n is the number of virtual station under study, x i and x j are the values of the variable of interest in virtual station i and j, with i = 1, …, n and , j = 1, …, n; $\bar{x}$ is the average value of the variable of interest in the virtual station under study and wij are the elements of the spatial proximity matrix.
The local spatial association indicator (LISA) is commonly conceived as a numerical measure of a random variable that relates each individual data point to values observed in neighbouring locations (Anselin, Reference Anselin1995; Mathur, Reference Mathur2015).
All statistical analyses were performed using the R software version 4.0.2 (R Development Core Team, 2022). For EFA, the nFactors package was used (Raiche et al., Reference Raiche, Walls, Magis, Riopel and Blais2013), for validation measures, NbClust (Charrad, et al., Reference Charrad, Ghazzali, Boiteau and Niknafs2022), for the Moran Local index the rgeoda package (Li and Anselin, Reference Li and Anselin2023) was used, and the maps were represented using ArcGIS software version 10.3 (ESRI, 2018).
Results
The results of the factor analysis and regionalization of the state of Paraná are presented through a cluster analysis.
Exploratory factor analysis
Overall, the variation explained by the three factors of the 2011/2012 harvest and by the four factors of the 2013/2014 and 2015/2016 harvests was greater than 82% for the global analysis and greater than 87% for the individual analysis, indicating that these factors define the dimensionality of the variables analysed and will be used in the subsequent steps (Table 2).
Number of factors and percentage of the total explained variance for the metrics associated with the EVI and the meteorological variables, resulting from the joint and individual analyses, for all three harvest years
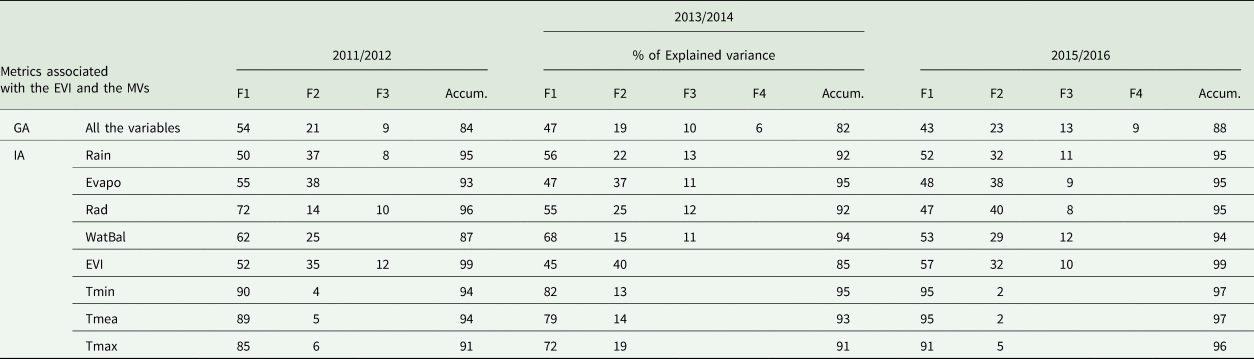
MVs, Meteorological Variables; GA, Global Analysis; IA, Individual Analysis; Rain, Rainfall; Evapo, Evapotranspiration; Rad, Radiation; WatBal, Water Balance; T, Temperature; min, Minimum; mea, Mean; max, Maximum; F, Factors; Accum., Accumulated.
The first factor (F1) of the global analysis has more than 54% of the total variance of the data set, representing the water deficit during growth until grain development in the 2011/2012 harvest year. For the 2013/2014 crop year, this factor represents the conditions of interference of photosynthetic activity in plant development, accounting for more than 47% of the total variance. In the 2015/2016 harvest year, more than 43% of the total variance was represented by this factor, indicating a change in land cover owing to thermal conditions.
The second factor (F2) of the global analysis explains 21, 19, and 23% of the total variance for the harvest years 2011/2012, 2013/2014, and 2015/2016, respectively (Table 2), representing the influence of the variable climate on potential evapotranspiration during plant maturation. Factors 3 and 4 presented values below 13% of the total variance in the three harvest years (Table 2).
In the individual analysis, in which each variable was evaluated separately, the minimum, average, and maximum temperatures were retained in the first factor (F1), with a percentage of total variance greater than 82, 79, and 72%, respectively. Thus, F1 represents the information on these temperatures from emergence to soybean grain-filling for the three harvest years (Table 2).
It is also worth highlighting solar radiation, which was best explained by F1 in the low precipitation scenario (harvest year 2011/2012), representing 72% of the total variability of information during the grain-filling stages until maturation. This suggests that, when solar radiation reaches extreme intensities, plants can tilt their leaves to reduce solar radiation interception, which reduces photosynthetic efficiency, especially if associated with low water availability (EMBRAPA, 2011), as occurred in this crop year.
Spatial regionalization of clusters
Considering both the individual analysis (Fig. 6) and the global analysis (Fig. 7), the profile of the clusters was created based on the factors obtained in the factor analysis, together with the metrics associated with the EVI and meteorological variables, during the phenological stages of soybean cultivation. Figures 6 and 7 describe the phenological stages of each group, as detailed in Fig. 3(b), as well as the respective high and low indicators. The high and low indicators were compared between the harvest years 2011/2012, 2013/2014 and 2015/2016 and within each group. Still, these variables had consistently high or low values in each crop year and in which phenological stage these values were observed.
In the individual analysis (Fig. 6), for the 2011/2012 harvest year, two groups were observed for potential evapotranspiration, solar radiation, water balance, and minimum and average temperature, and three groups for precipitation, EVI, and maximum temperature. In 2013/2014, there were two groups for precipitation, solar radiation, water balance, minimum temperature, and three groups for potential evapotranspiration, EVI, and average and maximum temperature. For the 2015/2016 crop year, two groups were identified for precipitation, water balance, and minimum temperature, and three groups were identified for potential evapotranspiration, solar radiation, EVI, average, and maximum temperature.
In the global analysis (Fig. 7), two groups were obtained for the harvest years 2011/2012 and 2013/2014 (Fig. 7(a, b)) and three groups for the harvest year 2015/2016 (Fig. 7(c)). Next, we describe the groupings according to mesoregions of the state of Paraná.
Individual analysis groupings
For the metrics associated with EVI, Group 1, from harvest years 2011/2012 and 2015/2016, presented high values throughout the crop cycle, indicating healthy plant development. However, Group 1, from the 2013/2014 harvest year, exhibited high values only during the sowing stages until grain filling, followed by lower values during the grain-filling stages until soybean maturation, possibly indicating a decline or stress during the final stages of the crop cycle.
Group 2, for all crop years, presented low EVI values during the sowing stages until grain filling (initial stages), and high values during the grain filling stages until soybean maturation (later soybean stages), suggesting slower growth or unfavourable conditions during the early stages, followed by a significant increase in later vegetative development. Group 3, for all crop years, had low EVI values throughout the soybean cycle, indicating possible growth problems or continuous stress over time.
Regarding metrics associated with precipitation, Group 1 demonstrated high values throughout the soybean crop cycle for all crop years, suggesting favourable precipitation conditions over time. Group 2, in turn, presented the opposite, indicating drought conditions or less water availability, potentially negatively affecting the plant growth and yield. Group 3 of the 2011/2012 crop year exhibited low values during the sowing stages until grain filling and high values during the grain-filling period until soybean maturation.
For metrics associated with potential evapotranspiration, Group 1 of the 2011/2012 harvest year presented high values during the initial stages and low values during the later stages, indicating a high initial water demand, followed by a reduction. The opposite pattern was observed in Group 2. Group 1 of the 2013/2014 crop year exhibited low potential evapotranspiration values throughout the cycle, possibly indicating lower humidity or lower water demand. In the 2015/2016 harvest year, Group 1 showed high values of potential evapotranspiration throughout the cycle, whereas Group 2 had low values initially and high values later.
Solar radiation, in turn, presented high values for Group 1 during the initial stages and low values during the later stages of the 2011/2012 and 2013/2014 harvest years. The characterization of this group indicates a greater availability of solar energy during the initial stages of growth, when plants are establishing themselves and actively growing, followed by a reduction in solar radiation during the stages of grain development and maturation. The opposite occurred for Group 2 during these crop years.
For the 2015/2016 harvest year, Group 1 had high values of metrics associated with solar radiation throughout the crop cycle. With this abundance of solar energy throughout the study period, it is possible to promote healthy plant growth during all phases of the crop. In contrast, Group 2 recorded low values during the sowing stages until grain filling, followed by an increase during grain filling until soybean maturation, indicating a variation in the availability of solar energy throughout the crop cycle. . The opposite pattern was observed for Group 3 in this crop year.
Metrics related to water balance showed high values throughout the soybean crop cycle for Group 1 during the harvest years of 2011/2012 and 2013/2014. This characterization suggests abundant availability of water in the soil throughout the period, which can be beneficial for plant growth and development. On the other hand, the opposite was observed for Group 2 during these harvest years as well as for Group 1 in the 2015/2016 harvest year. This situation may indicate drought conditions or reduced water availability in the soil, which can have negative impacts on plant growth and yield.
The minimum temperature metrics revealed distinct patterns between the groups throughout the harvest period. In the 2011/2012 harvest year, Group 1 recorded low values, and Group 2 recorded high values throughout the crop cycle. In the 2013/2014 and 2015/2016 harvest years, an inversion was observed: both Group 1 and Group 2 presented high values during the initial stages until grain filling and low values during filling until soybean maturation., with inversions occurring in Group 2 in 2013/2014 and Group 1 in 2015/2016.
The patterns varied with the average temperatures. In the 2011/2012 and 2015/2016 harvest years, Group 1 recorded low values throughout the cycle, Group 2 presented high values, and Group 3 recorded low values during the 2013/2014 harvest year. However, in the 2013/2014 and 2015/2016 harvest years, Group 1 and Group 2, respectively, exhibited high values during the initial stages until grain filling and low values during filling until soybean maturation, with inversions occurring for Group 2 in 2013/2014 and for Group 3 in 2015/2016.
The maximum temperatures exhibited different behaviours. For the 2011/2012 harvest years, Groups 2 and 3 presented high values throughout the cycle, whereas Group 1 recorded low values. However, in the 2013/2014 and 2015/2016 harvest years, the patterns were reversed: Groups 2 and 3 exhibited low values during the initial stages until grain filling and high values during filling until soybean maturation, with inversions occurring in Group 1 in 2013/2014. These temperature variations at different phenological stages can affect soybean development by subjecting the plants to thermal stress.
Global analysis groupings
Group 1
For all crop years, this group covered most of the North Pioneiro, Central Eastern, Metropolitan Curitiba, Southeast, and Central South mesoregions of the state of Paraná, Brazil (Fig. 7).
The values associated with precipitation and water balance were predominantly high during the 2011/2012 and 2013/2014 harvest years throughout the soybean cycle. The average precipitation ranged from 482 to 827 mm (with a coefficient of variation of 9%) and from 434 to 1062 mm (with a coefficient of variation of 14%) for the aforementioned crop years, respectively. However, in 2015/2016, precipitation varied between 769 and 1673 mm (with a coefficient of variation of 14%), which is considered relatively low compared to other groups of the same crop year (Supplementary Fig. 1).
Furthermore, negative values were observed in the water balance for 2011/2012 and 2013/2014, indicating a water deficit, and high values for metrics such as EVI, potential evapotranspiration, and solar radiation in 2015/2016, as well as for solar radiation in 2011/2012. The minimum, average, and maximum temperatures remained low throughout the soybean cycle, varying between 10°C and 30°C for the 2011/2012 and 2013/2014 harvest years and between 15°C and 29°C for 2015/2016 (Supplementary Fig. 1).
Group 2
Group 2 for all crop years comprised a large part of the West, Northwest, and Central-West mesoregions (Fig. 7). This group presented low values throughout the soybean crop cycle for metrics associated with precipitation and water balance in crop the 2011/2012 and 2013/2014. Average precipitation ranged from 399 to 720 mm (with a coefficient of variation of 13%) and from 352 to 833 mm (with a coefficient of variation of 16%) for these crop years, respectively, and the water balance showed negative values, indicating a water deficit, especially in the 2011/2012 harvest year. However, for the 2015/2016 crop year, high values were observed for metrics associated with precipitation throughout the soybean cycle, varying between 1073 and 1843 mm (10%) and a positive water balance (Supplementary Fig. 2).
Furthermore, the metrics associated with minimum, average, and maximum temperatures for Group 2 (Fig. 7) remained high throughout the soybean crop cycle, varying between 14°C and 33°C for the 2011/2012 harvest years and 2013/2014, and between 18°C and 32°C for the 2015/2016 harvest year (Supplementary Fig. 2).
On the other hand, during the sowing stages until grain filling, low values were observed for the metrics associated with EVI and solar radiation for the three crop years and for potential evapotranspiration in the 2011/2012 and 2015/2016 crop years, with high values of these metrics during the grain filling stages until soybean maturation.
Cluster 3
For the 2015/2016 harvest year, Group 3 was identified, mainly covering the North Central, Northwest and Central Western mesoregions (Fig. 7(c)).
Throughout the soybean crop cycle, Group 3 presented high values for metrics associated with minimum, average, and maximum temperatures, varying between 17 and 32°C (Supplementary Fig. 3), as well as for metrics associated with EVI.
During the sowing stages until grain filling, high values were observed for metrics associated with precipitation, potential evapotranspiration, solar radiation, and water balance, whereas low values were recorded for these metrics during the grain filling stages until grain maturation.
Differences between groups in the global analysis
One of the main distinctions between Groups 1 and 2 over the three crop years was, is related to the metrics associated with precipitation. Group 1 of the 2011/2012 and 2013/2014 harvest years presented high precipitation values throughout the soybean crop cycle, whereas the opposite was observed for Group 2 during these periods.
In the 2015/2016 harvest year, for Group 1, low values of metrics associated with precipitation were identified during the sowing stages until grain filling, in contrast with high values during the grain-filling stages until soybean maturation. This trend was reversed in Group 3. Group 2 had high precipitation throughout the soybean crop cycle.
Furthermore, during the reproductive phase from flowering to grain filling, where a minimum of 7 to 8 mm/day of water is required (EMBRAPA SOJA, 2011), Group 1 demonstrated metrics associated with average rainfall below this value, with average of 4.9 mm/day, 5.5 mm/day and 7.0 mm/day, (with coefficients of variation of 19, 13, and 22%) for the harvest years 2011/2012, 2013/ 2014, and 2015/2016, respectively. Only Group 1 of the 2015/2016 crop year achieved adequate precipitation values. However, there was greater variability in precipitation than in the crop years 2011/2012 and 2013/2014. These variations, together with the lack of adequate precipitation during the critical development phase, could have negative impacts on the productivity of the soybean crop Group 1, during the 2011/2012 and 2013/2014 harvest years.
For Group 2, the metrics associated with average rainfall were even lower, with a daily average of 3.4 mm, 5.7 mm and 18.1 mm (with a coefficient of variation of 30, 19 and 15%) for the harvest years 2011/2012, 2013/2014 and 2015/2016, respectively. These values indicate inadequacy and high variability in the 2011/2012 and 2013/2014 harvest years, respectively. Group 3 of the 2015/2016 crop year recorded an average of 7.7 mm/day, with a variation of 16%, considered adequate for precipitation during these stages. This disparity in precipitation values between harvest years was notable.
Other differences were found in the metrics associated with water balance, which were low for Group 2 in the 2011/2012 and 2013/2014 harvest years, and for Group 3 in the 2015/2016 harvest year. Low water balance values indicate a more severe water deficit in these harvest years, which can negatively affect the growth and development of the crop. In contrast, the other groups presented higher values, suggesting more favourable conditions of water availability throughout the crop cycle.
Regarding the metrics associated with the minimum, average, and maximum temperatures, Group 2 of the three harvest years and Group 3 of the 2015/2016 harvest year presented higher values throughout the entire soybean crop cycle. This is in contrast with Group 1, which had lower temperatures for all three crop years. These variations can influence plant development and soybean crop productivity.
Metrics associated with EVI, potential evapotranspiration, and solar radiation revealed distinct patterns between Groups 2 and 3 in the three crop years. While Group 2 demonstrated low values during the sowing stage until grain filling, followed by high values during the grain filling stage until soybean maturation, the opposite was observed for Group 3 in the 2015/2016 crop year. However, the metrics associated with EVI remained low throughout the soybean cycle. This reversal of patterns in Group 3 of the 2015/2016 harvest year suggests significant differences in the growing conditions between the groups. Increases in potential evapotranspiration, accompanied by an increase in temperature, tend to be harmful to agricultural activities by reducing the water available to plants in the soil (Andrade et al., Reference Andrade, Silva, Vieira, Silva, Santos and Silva2021).
These variations in meteorological variables and EVI have a direct impact on agricultural activities, and consequently, productivity. The groups, as defined by the metrics associated with meteorological variables and EVI, demonstrated different productivities. Group 1 presented productivity of 2.60 t/ha, 3.09 t/ha and 3.24 t/ha, for the harvest years 2011/2012, 2013/2014 and 2015/2016 respectively (IBGE, 2012, 2014, 2015) (Fig. 7). This tendency to increase productivity throughout the harvest period may be related to the more favourable climatic conditions.
Group 2 productivity was 2.53 t/ha and 2.98 t/ha for the harvest years 2011/2012 and 2013/2014, respectively (IBGE, 2012, 2014), increasing to 3.30 t/ha (IBGE, 2016) in the year −2015/2016 harvest. This increase may be related to more favourable environmental conditions. Group 3 reached approximately 2.58 t/ha in the 2015/2016 harvest year (IBGE, 2016) (Fig. 7).
These data highlight the variability in agricultural productivity over time and the different responses of groups influenced by climate variation and EVI. To obtain a better spatial understanding of productivity in the groups, a Moran scattering map was created (Fig. 7). The map results reveal differences in the distribution of agricultural productivity, especially in the High–High and Low–Low categories.
In the 2011/2012 crop year, around 32.3% of the agricultural areas were classified as High–High and 24.7% as Low–Low (Fig. 7(a)). In 2013/2014, these percentages changed to 26.5 and 21.2%, respectively (Fig. 7(b)). In the 2015/2016 crop year, areas classified as High–High represented approximately 27.2%, while those classified as Low-Low were approximately 24.2% (Fig. 7(c)).
In Group 2, throughout the three harvest years, subregions with low productivity were surrounded by others with equally low productivity. Group 1 had sub-regions with high productivity surrounded by others that were equally productive. This suggests uniformity of high productivity in Group 1 and low productivity in Group 3, characterized by sub-regions with low productivity surrounded by others with equally low productivity (Fig. 7).
These changes in the distribution of areas with different levels of productivity throughout the harvest years may reflect variations in climatic conditions, EVI, and other factors (not evaluated in this study) that affect agricultural productivity. These observations can be useful in understanding how these factors impact agriculture in different regions and periods.
Discussion
Soybean yield is influenced by a complex interaction of factors throughout the crop cycle, with an emphasis on climatic factors. These elements have a direct impact on the growth, development, and production of soybeans, and their interdependence can determine the success or failure of a crop.
Climate interactions can indicate the best periods to plant and harvest soybeans and the most suitable regions for cultivation. The spatial regionalization of Paraná identified areas with favourable climatic conditions for soybeans and those where climatic factors significantly impact productivity. In the three harvests analysed, the mesoregions of Group 1 (Norte Pioneiro, Central Oriental, Metropolitana de Curitiba, Sudeste and Centro-Sul) were more suitable, presenting better productivity (Santos et al., Reference Santos, Correia, Behling and Feiden2024). However, in the 2011/2012 and 2013/2014 harvests, Group 1 had below-ideal precipitation during the reproductive phase (R2 – R5), indicating a possible water deficit, which can reduce productivity due to smaller grain size and weight (Borrmann et al., Reference Borrmann, Junqueira, Sinnecker, Gomes, Castro and Marquez2009; Matzenauer et al., Reference Matzenauer, Radin and Maluf2017). Water deficit increases evaporative demand, leading to faster and more intense stress (Bergamaschi, Reference Bergamaschi, Bergamaschi and Bergonci2017).
It was also observed that the climatic and agronomic patterns of Groups 1 and 2 in the harvest years 2011/2012 and 2013/2014 were opposite, mainly in relation to precipitation and temperature. These discrepancies can have significant impacts on soybean productivity because the quantity and distribution of water, together with high temperatures, are crucial factors for plant development.
In contrast, Group 2 in the 2011/2012 and 2015/2016 harvest years only showed differences in precipitation and water balance. In 2011/2012, the precipitation and water balance values were below the recommended levels throughout the crop cycle, mainly during the soybean reproductive phase, negatively affecting productivity.
Other factors that may have contributed to the low productivity in Group 2 in 2011/2012 include the occurrence of summers, dry periods with intense heat, strong sunlight, and low relative humidity, which are associated with high temperatures during the soybean maturation phase (Figs 6 and 7), leading to earlier maturation, reduced grain weight and size, and negative effects on productivity (Yee-Shan et al., Reference Yee-Shan, Wan-Kin, Yuk-Lin, Man-Wah, Chao-Qing, Xueyi, Hon-Ming and Board2013).
Furthermore, temperatures within the ideal range are conducive to plant growth and productivity. However, even a small increase above threshold levels significantly reduces production yields (Schlenker and Roberts, Reference Schlenker and Roberts2009; Sharma et al., Reference Sharma, Kumar, Vatta, Bheemanahalli, Dhillon and Reddy2022).
In the 2011/2012 harvest year, Paraná faced a lack of rain and high temperatures, especially in the Group 2 mesoregions, owing to the influence of the La Niña phenomenon (CONAB 2012). In contrast, in 2015/2016, there was excess rainfall and low solar radiation due to the El Niño phenomenon, characterizing a wetter year that impacted the agricultural production of soybeans in Paraná. (CONAB 2016)
Variability in soybean productivity is generally accompanied by inter-annual variability in seasonal precipitation. Years with extreme negative precipitation anomalies can result in severe crop loss. This direct association did not occur in the analysis of positive precipitation values. However, excess rainfall during the growing season can have different impacts on yield depending on the stage at which it occurs (Podesta et al., Reference Podesta, Messina, Grondon and Magrin1999; Llano et al., Reference Llano, Vargas and Naumann2012; Cohen et al., Reference Cohen, Zandalinas, Huck, Fritschi and Mittler2021).
It is essential for producers to understand these weather patterns and closely monitor environmental conditions, especially during the soybean reproductive phase, to implement appropriate management strategies and minimize the negative impacts on future harvests. This may include irrigation practices, selection of soybean varieties that are more resistant to environmental stress, and adoption of cultivation techniques that promote plant health and development during this critical period.
The results of this study can still be used to define more appropriate strategies for soybean cultivation in Paraná, providing information on climatic risks for rural producers and responsible bodies, defining regions most suitable for soybean cultivation, and the periods of phenological stages that suffer greater impacts from climate variability. This can guide decision making related to participation in agricultural support programmes, such as rural insurance.
Conclusion
The analysis carried out using multivariate statistics such as EFA and clustering allowed for a deeper understanding of the regional conditions of the state of Paraná in relation to soybean cultivation. Observation of the results at both the individual and global levels revealed similar patterns, although the cartographic representations differed, which enriched our understanding of the variables under study. Regionalization revealed that the mesoregions grouped in Group 1 over the three harvest years showed more favourable climatic conditions for soybean cultivation. On the other hand, the mesoregions grouped in Group 2 during the 2011/2012 and 2013/2014 harvest years and in Group 3 during the 2015/2016 harvest year faced productivity losses due to unfavourable weather conditions, in addition to other factors that were not addressed in the study. It is essential to consider the impact of climate variability and EVI during the phenological stages of soybean cultivation, particularly during the critical phases of development.
Supplementary material
The supplementary material for this article can be found at https://doi.org/10.1017/S0021859624000340.
Authors’ contributions
P. P. G., L. P. C. G., and J. A. J. designed this study. P. P. G., E. M. S., W. R. B., and A. P. collected data. P. P. G. performed the statistical analyses. P. P. G., E. M. S., L. P. C. G. and J. A. J. drafted the manuscript.
Funding statement
This work was supported by the Federal Technological University of Paraná (UTFPR), Graduate Support Program–Proap of the Coordination for the Improvement of Higher Education Personnel (CAPES), and Applied Statistics Laboratory–Unioeste.
Competing interests
None.
Ethical standards
Not applicable.



