Not long after the 2006 midterm elections, the eminent congressional scholar Gary C. Jacobson noted their historical significance: “Democrats lost not a single seat in either body, the first election in U.S. history in which a party retained all of its congressional seats” (Jacobson Reference Jacobson2007, 1). Indeed, virtually every Democrat serving in the House of Representatives breezed to victory thanks to a stiff partisan wind at their backs. There were however, two Georgia Democrats, Jim Marshall (District 8) and John Barrow (District 12) who won reelection by the slimmest of margins. These congressmen, representing neighboring districts, barely survived another term in 2006 because of a redistricting that made their seats more competitive.
In 2005 the Republican-controlled General Assembly redrew Georgia's congressional districts in order to gain additional seats in the 2006 midterm election. In this article we present a case study of the effects of redistricting on turnout and vote choice in Georgia District 8 in the 2006 U.S. House election. It is apparent both from our findings and an elite interview that unlike the more aggressive strategy employed by Texas Republicans in 2003, Georgia Republicans tried to thread the needle in their goal of winning District 8. Conventional wisdom suggests that if a political party controls redistricting it will maximize its electoral opportunities. But this was not the case in Georgia. Ever since passage of the Democratic-drawn congressional map enacted for the 2002 elections, Republicans campaigned in favor of new, less convoluted boundaries. Ironically, by honoring their commitment to implement a map with smoother district lines that retained representatives' core voter populations, Georgia Republicans fell short in their attempt to defeat Democratic incumbent Jim Marshall.
First, we turn to a brief overview of the contemporary history of redistricting in Georgia from 1992 to 2002. We then present an account of the 2005 Georgia redistricting, relying on an interview with the designer of the Republican map. It is evident from this interview that Georgia Republicans adopted a strategy that embraced a priority that served to undermine their desire of defeating Jim Marshall and John Barrow. Finally, we present an empirical analysis of the effects of redistricting in Georgia District 8 to demonstrate just how it affected voter turnout and vote choice. The empirical findings illustrate that redistricting had the intended effect of reducing political support for Jim Marshall, but it was not quite enough to deny him another term.
REDISTRICTING IN GEORGIA, 1992–2002
In the 1990s, increasing mass partisanship translated into more partisan congressional voting, and thus a reduction in ticket splitting (Bartels Reference Bartels2000; Jacobson Reference Jacobson2004). This was especially true for southern whites (Bullock, Hoffman, and Gaddie Reference Bullock, Hoffman and Gaddie2005). Within the South, Georgia is notable for historically having been one of the most Democratic of the Democratic “Solid South” states (Bass and De Vries Reference Bass and De Vries1976; Clark Reference Clark, Appleton and Ward1997; Key Reference Key1996).Footnote 1 But since the 1990s, the growth of Republicanism in Georgia has been robust, particularly in U.S. House elections.
Heading into the 1992 House elections, Newt Gingrich was the only Republican in Georgia's 10-member delegation. Through reapportionment Georgia gained one seat. The Department of Justice, under its enforcement of redistricting preclearance (Section 5 of the Voting Rights Act), pressured the Democratic-controlled legislature to draw two new majority-black districts in addition to the existing majority-black District 5 (Bullock Reference Bullock, Bullock and Rozell1998). The concentration of African Americans in three of Georgia's 11 districts made surrounding districts whiter and thus more favorable to Republican candidates (Hill Reference Hill1995). After the 1994 elections, Republicans represented seven House districts and Democrats four, but with representative Nathan Deal's switch to the Republican Party in 1995, the Georgia House delegation then consisted of eight Republicans and three Democrats—all African Americans representing the state's majority-black districts.Footnote 2
Based on the evidence presented by Grofman and Brunell (Reference Grofman, Brunell and Galderisi2005; also see Hill Reference Hill1995), Georgia's Democratic-controlled legislature instituted the quintessential “dummymander” for the 1992 House elections: “A dummymander is a gerrymander by one party that, over the course of the decade, benefits the other party, and actually looks as if it was designed by that party rather than the party in power” (Grofman and Brunell Reference Grofman, Brunell and Galderisi2005, 184). Commenting on Georgia's dummymander, Hill (Reference Hill1995, 392) writes, “if Georgia drew those districts irregularly to elect not only two new African Americans but also to protect Democratic incumbents, they failed miserably in their latter attempt!”
In the next round of redistricting in 2001, Georgia Democrats still controlled the legislature and the governorship and this time the party did somewhat better in redrawing the congressional map. Georgia gained two seats through reapportionment and after the 2002 House elections, the Georgia delegation consisted of eight Republicans and five Democrats. The newly drawn District 12 was configured to elect an African American Democrat, but due to a scandal-plagued Democratic nominee, Republican Max Burns was the upset winner in 2002 (Barone, Cohen, and Ujifusa Reference Barone, Cohen and Ujifusa2003). In 2004, Max Burns lost to white Democrat John Barrow, making the delegation seven Republicans and six Democrats after the 2004 elections.
REPUBLICAN INTENTIONS IN 2005: AN ARTFUL GERRYMANDER
Although the 2005 Georgia redistricting did not garner the notoriety associated with Texas's 2003 “re-redistricting,” Georgia Republicans pursued a partisan gerrymander. But it was done with a peculiar self-imposed constraint. Unlike the Texas GOP, whose number-one objective was to steer clear of violating the Voting Rights Act (VRA) in its pursuit of sending several Anglo Democratic incumbents into involuntary retirement (McKee and Shaw Reference McKee, Shaw and Galderisi2005), the selling point for the Georgia re-map was to restore some geographic sanity to the Democratic-drawn congressional boundaries. As was the case in Texas in 2002, Georgia Republicans were able to win majority control of the state house in 2004, which gave the Republicans unified control of the legislature and governorship for the first time since Reconstruction. With surprisingly little resistance (especially compared to the spirited fight waged by Texas Democrats), Georgia Republicans enacted a new congressional map in 2005. What follows are the details of what Georgia Republicans expected to accomplish by implementing a new map for the 2006 U.S. House elections.
Bryan Tyson, a legislative assistant to Republican congressman Lynn Westmoreland (District 3), designed the map enacted for the 2006 midterm and he agreed to a telephone interview on March 20, 2008, to discuss intentions for the new plan.Footnote 3 We asked Tyson if he could rank the objectives for the redistricting plan. Tyson indicated first and foremost, in holding true to the GOP's sales pitch with Georgia voters, they would “eliminate the county splits and make the map make sense again.” The erstwhile Democratic map required a high-powered microscope to divine several of the district boundaries in the greater Atlanta metropolitan area. By contrast, the Republican map's dividing lines are visible to the naked eye—with 34 county splits out of a total of 159 counties reduced to 19. Figure 1 provides a visual comparison of the Democratic-drawn boundaries valid for the 2002 and 2004 elections on the left, and the most recent Republican-drawn plan on the right, valid for the 2006 contests (see also Barone, Cohen, and Ujifusa Reference Barone, Cohen and Ujifusa2005, 469–71).
Comparing the Old and New Congressional Boundaries for Georgia U.S. House Elections
Note: Figure created by the authors with maps from the U.S. Census Bureau.

As is generally the case throughout the South, for Georgia Democrats to maximize their political opportunities and comply with the VRA, they had to draw an “ugly” map with numerous tentacles that capture pockets of black voters and liberal-to-moderate whites. Thus, by smoothing out district boundaries while maintaining their core populations, the Republican map would naturally improve Republican chances. According to Tyson, “the 2001 plan was basically a ‘max Democratic plan,’ so any change to it was going to help Republicans.”
Second, the primary beneficiary of a more aesthetically appealing map was Republican Phil Gingrey (District 11), the most electorally vulnerable member of the Georgia delegation. In 2004, under the Democratic-drawn map, Gingrey won his initial reelection with 57% of the vote and in 2006, under the Republican plan he took 71% (Barone, Cohen, and Ujifusa Reference Barone, Cohen and Ujifusa2005, Reference Barone, Cohen and Ujifusa2007). Following an overhaul of Gingrey's district the redrawn voting-age population stood at 55.3%.Footnote 4 But more importantly, the 2004 presidential vote for George W. Bush in the district went from 55% to 71% (Barone, Cohen, and Ujifusa Reference Barone, Cohen and Ujifusa2005, Reference Barone, Cohen and Ujifusa2007).
Third, even with their emphasis on giving the Democratic-drawn plan a facelift, Georgia Republicans expected to net one or two districts: District 8 and District 12. In the case of District 12, which neighbors District 8 to the east, the Democratic incumbent John Barrow lost his liberal stronghold of Athens-Clarke County—home to the University of Georgia. Although the overall African American population slightly increased, this was offset by removing moderate-to-liberal metropolitan whites and replacing them with many more conservative rural whites (for details see Hood and McKee Reference Hood and McKee2008). Barrow ended up having a rematch with Republican Max Burns, the unlikely former incumbent whom Barrow defeated in the previous election under the old district lines. This was in fact the closest contest in the nation for an incumbent Democrat in 2006; however, because both candidates represented the same voters in the old portion of the district, an analysis of the effects of redistricting is greatly complicated.
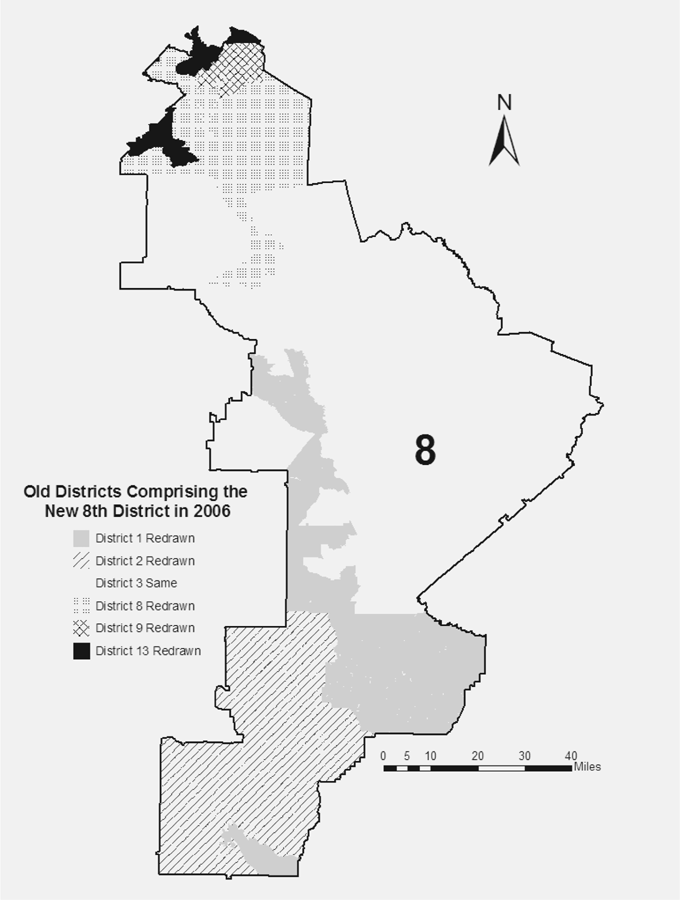
District 8, on the other hand, speaks to our characterization that the GOP tried to thread the needle in its intention to defeat congressman Jim Marshall. Unlike District 12, where a major constraint on its reconfiguration was to avoid committing retrogression by reducing the minority population because it was considered a “minority influence” district (at over 40% black), there seemed to be no hard limit for substantially reducing the African American population in District 8. And to some extent the new district did have its black population reduced, going from 39.8% to 32.4% (Barone, Cohen, and Ujifusa Reference Barone, Cohen and Ujifusa2005, Reference Barone, Cohen and Ujifusa2007). The 2004 Republican presidential vote in the district went from 55% to 61% (Barone, Cohen, and Ujifusa Reference Barone, Cohen and Ujifusa2005, Reference Barone, Cohen and Ujifusa2007). Transforming a horizontally shaped district (District 3 in 2002–2004) into a vertically shaped district (District 8 in 2006) substantially increased the percentage of voters new to Marshall. Figure 2 displays a map of District 8, indicating the redrawn sections (and their previous district numbers) and the same portion of the district represented by Marshall (District 3) before redistricting. Finally, as Tyson confirmed, by adding his home county (Butts County) to District 8, it was expected that former congressman Mac Collins might emerge to challenge Marshall, and he did.Footnote 5
Georgia's 8th Congressional District in the 2006 Midterm Election
Source: Figure produced by the authors using block-level data from Geolytics (CensusCD 2000/Redistricting Blocks) and maps from the U.S. Census Bureau

Despite all this empirical evidence that Marshall's congressional tenure was threatened by redistricting, it could have been worse and Tyson explained why. An earlier version of the plan was more aggressive in weakening Marshall's reelection bid. The initial incarnation of District 8 was slightly more Republican according to previous vote returns (i.e., the district percentage of the Republican presidential vote). Second, the original reconfiguration of the district removed Laurens County, where Marshall had a district office. According to Tyson, the final version of the district put Laurens County back because Georgia Republicans did not want to appear too blatant in their desire to unseat Marshall. Marshall carried Laurens County with 52% of the vote—not much, but certainly a welcome county since he won reelection with 50.5% (Barone, Cohen, and Ujifusa Reference Barone, Cohen and Ujifusa2007).
Like their fellow partisans in the Lone Star State, Georgia Republicans substantially altered the constituency in District 8 with the expectation that redrawn residents would provide the necessary votes to elect a Republican. Specifically, the GOP strategy of reducing black residents and increasing white residents was supposed to result in enough Republican votes to oust Democratic representative Marshall. But in one very important respect the Georgia case is very different from Texas. As Tyson made clear, the number-one priority was to draw a more geographically palatable map, a constraint that impinged on the competing goal of defeating two Democratic incumbents. Indeed, it is apparent from our interview with Tyson that there was a degree of ambivalence in the Republican goal of defeating Marshall. To be sure, they wanted to win District 8, but they chose to reconfigure the district so that Marshall had a fighting chance. In short, the Georgia GOP attempted to thread the needle.
DATA AND METHODS
This section discusses in detail the models we constructed to assess the effects of redistricting on political participation and voter preferences in District 8. We start with the turnout model and then present analyses of congressional vote choice. The empirical evidence shows that redistricting served to reduce Representative Marshall's electoral support, but it also indicates that Georgia Republicans did not go far enough to be successful in their effort to remove this endangered Democrat.
Voter-Turnout Model
The data for this part of the analysis came from the voter-registration and history databases maintained by the Georgia secretary of state. The state-registration and history databases gave us some degree of leverage for studying the effects of redistricting on voter turnout. First, these data sources provided information on the population of registrants and voters in District 8. Second, we did not have to worry about questions relating to the inflation of self-reported voting since turnout was validated at the polls when a registrant cast a ballot.
From these two primary data sources we estimated an individual-level voter-turnout model for Georgia's Eighth Congressional District in the 2006 general election. Our dependent variable, turnout, is a binary measure with a value of 1 indicating that a registrant cast a ballot in the 2006 general election.Footnote 6 Given the nature of the dependent variable, we used logistic regression to evaluate turnout.
From the voter-registration database we included several independent variables expected to influence the likelihood of voting. Using white registrants as the comparison category, we included a series of dummy variables to denote black, Hispanic, Asian, and registrants of other race/ethnicity in our models.Footnote 7 A dummy variable for gender (1 = female; 0 = male) and a continuous measure for the age (18–106) of a registrant, calculated from the recorded date of birth, were also included in the analysis.
In addition to a registrant's race, our other primary variable of interest is district residency. Registrants whose voting precinct was redrawn into the reconfigured District 8 as a consequence of the Georgia 2005 redistricting plan were coded 1 (redrawn-district resident) while the remaining residents were coded 0, indicating their precinct of residence was represented by the Democratic incumbent (Marshall) before and after the 2005 redistricting.Footnote 8 Since redrawn residents should have been less familiar with the incumbent, we expected them to be less likely to vote (i.e., higher information costs for redrawn registrants lowers their turnout). In order to separate the effects of redistricting and turnout by a registrant's race, we included a set of interactive terms in which each indicator variable of race/ethnicity was multiplied by redrawn-district resident.
Two other variables derived directly from the voter-registration and history files relate to a registrant's history of political participation. New registrant, calculated from a field in the registration database, is a dummy variable indicating the length of time a resident has been registered to vote. Those individuals registered to vote since the 2004 election cycle (two years or less) were coded 1, with the remainder coded 0. In addition, we included a dummy variable for registrants who participated in the 2004 general election. This variable, like the dependent variable, was calculated from information collected in the voter-history database. Voted 2004 was coded 1 for those registrants who voted in the 2004 general election and 0 for those who abstained.
Several additional controls were included in the models to capture contextual effects in District 8. The first two variables account for variations in income and education. We could not measure these factors at the individual level, but the registration database includes a registrant's zip code. With this information we could place individuals within a particular geographic context in terms of average income level by including an indicator of per capita income in 2006 measured at the zip-code level.Footnote 9 Likewise, at the zip-code level we included a measure of the percentage of residents with at least a bachelors degree (% with bachelors degree). We expected both income and education measured at the zip-code level to be positively related to voter turnout.Footnote 10
A set of variables designed to measure campaign-related effects were also included in the models. Advertising relating to the candidates' campaigns could have varied by media buys, so we included a set of n − 1 dummies to denote the media market in which a registrant resided. For District 8, the included media markets are Macon and Albany, with Atlanta serving as the excluded category. Competitive races stimulate interest and, as a consequence, increase voter turnout. Competitiveness of down-ticket elections, however, can vary greatly across an area comprising a congressional district. In order to measure electoral competitiveness below the congressional level, a set of dummy variables were created to measure competition in state legislative contests. State senate—contested election and state house—contested election are contextual measures that indicate whether a registrant resided in a legislative district experiencing one or both forms of this type of electoral competition. State house—open seat measures the presence of an open-seat race for a state house seat (all of the races for state-senate seats in areas overlapping District 8 contained an incumbent).
Vote-Choice Models
A second set of models examined vote choice. Although we knew whether a particular registrant voted, we had no way of knowing which candidate they supported. In order to model vote choice, we had to move above the individual level and rely on precinct-level data. For these models, our dependent variable was measured as the percentage of the two-party vote cast in District 8 for Democratic incumbent Jim Marshall.Footnote 11 We modeled vote choice using weighted least squares.Footnote 12 The predictor variables included % black turnout, % female, and % 65 and over—all of which were expected to be positively related to Democratic vote choice.Footnote 13 These variables were calculated by aggregating the number of black voters, female voters, and voters who were 65 years of age or older and dividing by the total 2006 turnout in a given precinct. Although these models relied on aggregate-level data, calculations were based on characteristics of individuals who actually voted, as opposed to registrants or the voting-age population. The data sources for these variables were the same as those utilized for the voter-turnout models, namely the voter-registration and history files.
Redrawn precinct is a dummy variable coded 1 for precincts newly incorporated into District 8, and coded 0 for precincts that Marshall represented prior to the 2005 redistricting. The variable of interest is an interactive term created by multiplying % black turnout by redrawn precinct. Using this approach we could determine how voting patterns changed for same and redrawn precincts as the precinct percentage of African American voters shifted from one extreme to another (from 0% black turnout to 100% black turnout). We ran two interactive models—the first included all of the aforementioned controls, whereas the second included one additional variable—the Democratic percentage of the 2006 Georgia gubernatorial vote (% Democratic gubernatorial vote).Footnote 14
FINDINGS
Voter-Turnout Model
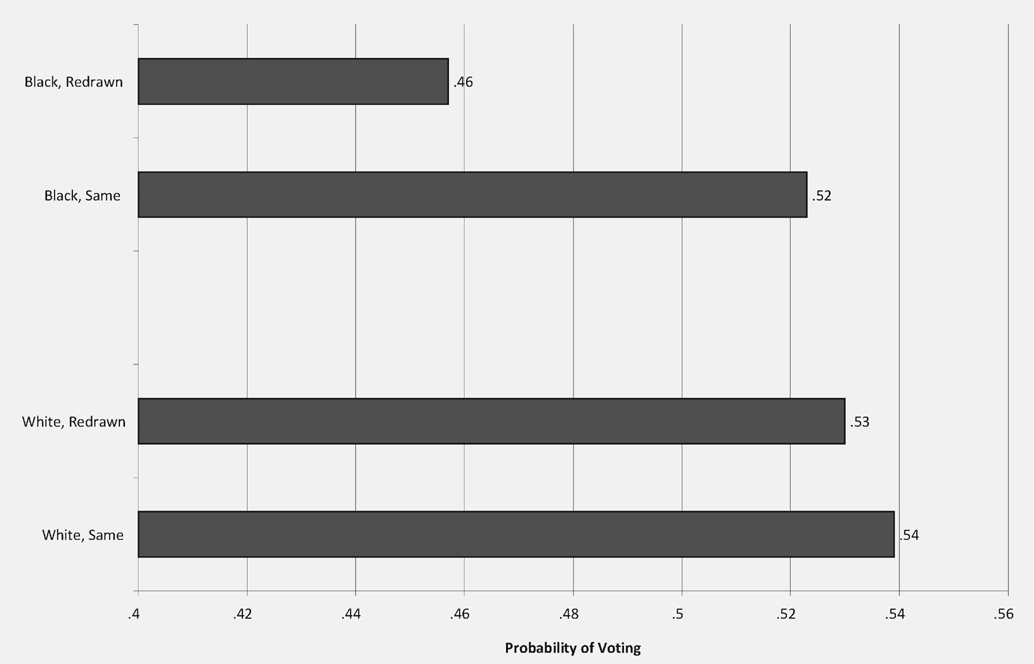
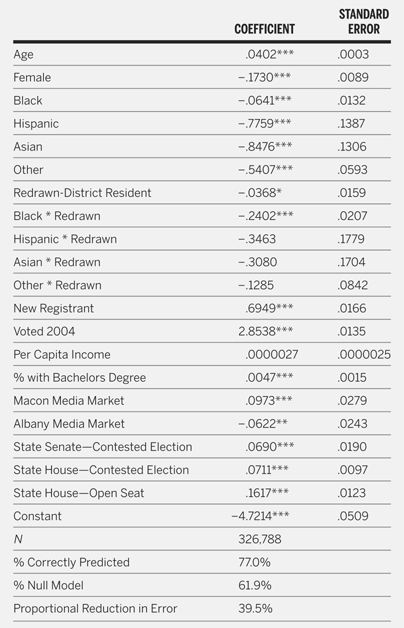
Our primary emphasis centers on the intersection of redistricting and race as these factors relate to voter turnout. The full set of results for the voter turnout model for Georgia District 8 is presented in Table A.1 in the appendix. For ease of interpretation, we translated the parameter estimates from our turnout model into probabilities.Footnote 15 We limited our exploration of turnout to black and white registrants, the two primary racial groups in District 8.Footnote 16 In Figure 3 the estimated probability of voting for District 8 registrants is decomposed by race and district residency status (same vs. redrawn).
Georgia District 8 Turnout Probabilities by Race and Redistricting Status in 2006
Note: For blacks and whites the intra-racial probability difference is significant at p < .05 (two tailed).

As shown, both same blacks (.52 vs. .46) and same whites (.54 vs. .53) were more likely to vote compared to their redrawn counterparts. While statistically significant (p < .05), the intra-racial probability difference for white registrants at .01 is substantively negligible. By contrast, the turnout differential between same and redrawn black voters in District 8, at .07, is both sizable and significant. We find that redistricting dampens turnout in the subsequent election cycle, especially among black registrants. Given the propensity for black registrants to vote Democratic, the drop in overall turnout among this group attributed to redistricting can produce sizable electoral effects. Finally, at .06, the interracial difference (or the difference of the differences) is also fairly large and statistically significant.Footnote 17 This calculation shows that even after accounting for a registrant's race and residency status, there remains a statistically significant participation gap between black and white registrants of District 8.
Other factors associated with a greater probability of voting in the 2006 general election include being older, a male, a new registrant, or someone who voted in the previous election. In addition, the model predicted that down-ticket electoral competition buoyed turnout in District 8. Those registrants living in contested state-senate or house districts or districts with a state-house seat hosting an open race were significantly more likely to turn out to vote compared to residents living in legislative districts lacking electoral competition. In the absence of competitive up-ticket races, especially the gubernatorial contest, it makes sense that a subset of the electorate might be especially interested in casting a ballot in a contested legislative election where they reside. Finally, campaign exposure also exerted differential effects on voter turnout. Compared with registrants living in the Atlanta media market (the excluded category), District 8 registrants living in the Macon media market were more likely to have voted in the 2006 general election. Conversely, those living in the Albany media market were less likely to have cast a ballot.
Vote-Choice Models
The results of the District 8 race indicate that Marshall received approximately 57.8% of the two-party vote in areas denoted as same, compared to 42.5% in the redrawn portions of the district.Footnote 18 This pattern is displayed graphically in Figure 4, which plots the Democratic vote share in District 8 using precincts as the unit of analysis. Figure 4 allows one to visually differentiate redrawn precincts (which are overlaid by a cross-hatch pattern) from same precincts. The vote percentages by precinct type in Figure 4 indicate that the voting patterns for same and redrawn precincts were widely divergent. In order to more fully examine this possibility, we turn to the multivariate models that evaluated precinct-level vote choice in District 8.
Precinct-Level Vote Returns for Georgia District 8 in the 2006 U.S. House Election
SOURCE: Figure produced by the authors with maps from Georgia's Legislative Reapportionment Services Office and election returns from the Georgia secretary of state's web site.

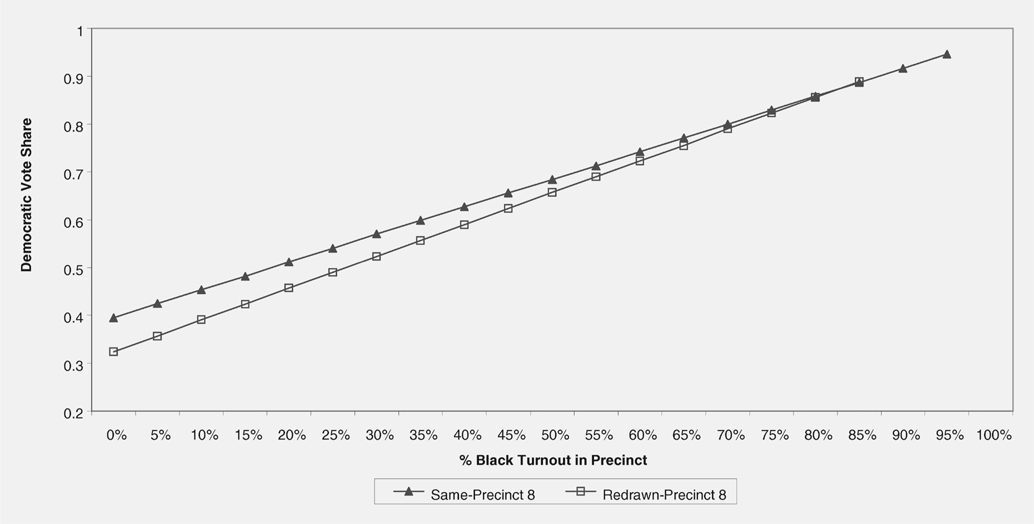
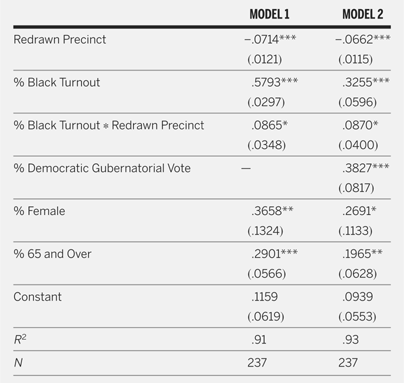
The full results of the precinct-level models used to predict the District 8 congressional vote are presented in appendix Table A.2. Figure 5 provides a graphical presentation of the first vote-choice model displayed in Table A.2. We used ClarifyFootnote 19 to produce a set of predicted precinct-level Democratic vote percentages holding the variables % 65 and older and % female at their mean values. The percentage of the two-party vote for Democratic representative Marshall in District 8 is plotted against precinct racial composition and residency status (same vs. redrawn).
Precinct-Level Vote Predictions for Georgia District 8 in the 2006 U.S. House Election

As evident by the steep positive slopes, as the percentage of African American voters within a precinct increases, so does the Democratic vote percentage. The predicted Democratic vote share for precincts with very high black turnout percentages is essentially the same regardless of whether the precinct was previously a part of Marshall's constituency. For precincts composed of 85% black voters, the model predicted the Democratic vote for same precincts to be 88.7%, compared to 88.9% for redrawn precincts.Footnote 20 As the percentage of black voters in a precinct decreased (and conversely the percentage of white voters increased), the gap between same and redrawn precincts in terms of the predicted Democratic vote share widened. The estimated Democratic vote for precincts with no black voters is 39.5% for same precincts compared to 32.4% for redrawn precincts—a statistically significant difference of 7.1%. Clearly, district-residency status impacted the voting patterns of non-black registrants in District 8, but not black registrants.
As a further check on the role of race and redistricting in predicting vote choice, we also ran a series of estimates based on the ecological inference (EI) technique (King Reference King1997). Using white and black turnout percentages (grouped by same and redrawn precincts) and the percentage of the Democratic vote, we were able to estimate the extent to which each of these groups voted for the Democratic incumbent. Our estimates approximate the findings displayed in Figure 5. Both redrawn and same black voters were predicted to have voted overwhelmingly for Marshall, and at essentially the same rates (97.8% vs. 98.6%, respectively).
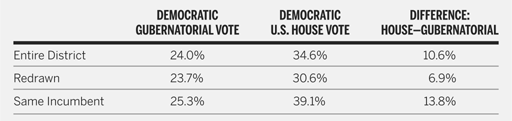
Given the nearly universal African American support for Representative Marshall, Table 1 is presented specifically for the purpose of illustrating the influence of redistricting on the vote choice of white residents in District 8. Because we have already demonstrated that the redrawn population was more supportive of Republican Mac Collins, we have included estimates of the white vote for governor in order to establish a baseline for determining the extent to which redistricting affected the white vote for Congress.
Estimated White Percentage of the Two-Party Vote for Governor and U.S. House in Georgia District 8

Note: Estimates of the white vote in Georgia District 8 were calculated based on King's EI program.
Table 1 makes it clear that redistricting exhibited an independent effect on white voting behavior, with redrawn whites significantly less supportive of Congressman Marshall. The gubernatorial vote, which is not contextually sensitive, shows that redrawn whites were somewhat less likely to have supported the Democratic gubernatorial candidate than same-incumbent white registrants (23.7% compared with 25.3%, respectively). But the U.S. House vote, which is contextually dependent upon the incumbency advantage, demonstrates that redrawn whites were much less supportive of Representative Marshall. The EI estimates predicted that 30.6% of whites in redrawn precincts voted for Marshall, compared with 39.1% for whites residing in same precincts. Also, the difference between the vote for governor and the vote for Congressman Marshall is twice as large for same whites (13.8%) versus redrawn whites (6.9%)—another telling indicator of the incumbency effect in the U.S. House contest. The 8.5 percentage point gap in the congressional vote between same and redrawn white registrants is just slightly larger than that produced from the regression estimates (Table A.2).
CONCLUSION
Two fundamental components of any election are turnout and vote choice. Redistricting makes victory less certain because residents drawn into the district may or may not exhibit preferences and participation rates similar to those of inhabitants who retain the same incumbent. As shown in this study, redistricting endangered the reelection bid of Democrat Jim Marshall in Georgia District 8. On both counts, turnout and vote choice, redistricting harmed Marshall. First, turnout disproportionately reduced the likelihood of voting among redrawn blacks, whereas it had no substantive effect on redrawn white participation. Second, as expected, redistricting did nothing to alter the voting preferences of African American populations, but redrawn white precincts were significantly more supportive of Republican Mac Collins. Our findings make it apparent that if Republicans had either reduced the African American constituency by a slightly larger amount or somewhat increased the redrawn district percentage while holding the racial composition constant, then Mac Collins would have won. So why did Georgia Republicans try to thread the needle? We think the recent history of redistricting in southern congressional elections provides an answer.
Since the 1992 U.S. House elections, as is true across the South, the Republican Party in Georgia has witnessed tremendous growth. White Republican support in congressional elections has increased markedly (Bullock, Hoffman, and Gaddie Reference Bullock, Hoffman and Gaddie2005) and racial redistricting has accelerated GOP gains in House contests (Hill and Rae Reference Hill and Rae2000). Particularly in the Deep South (Alabama, Georgia, Louisiana, Mississippi, and South Carolina), where racially polarized voting is more pronounced (see Key Reference Key1996; Black and Black Reference Black and Black1992; Valentino and Sears Reference Valentino and Sears2005), it is possible to draw congressional districts with high black percentages (over 30%) that are still won by Republicans. But in order for Republicans to win these districts, they must capitalize on a higher white turnout that is decidedly Republican in vote choice (Black and Black Reference Black and Black2002).
Indeed, the recent past indicates that District 8 could be won by a Republican. After all, in the Deep South there were instances where Republicans won districts with substantial black populations (e.g., Mississippi District 4 in 1996). Furthermore, the 2003 Texas redistricting presented clear evidence that redrawn constituents would vote overwhelmingly Republican. In sum, given a strong and essentially unbroken Republican trend that commenced in the early 1990s, Georgia Republicans had reasons to believe that they could defeat Jim Marshall in a close contest. In 2005 they were confident enough to think that they could draw a cleaner map, fortify a vulnerable Republican, and still knock off one, or perhaps both, targeted Democratic representatives. They accomplished the first two objectives, but came within a whisker of wresting away Districts 8 and 12—the closest two contests for incumbent Democrats in the 2006 congressional elections.
Smoothing out district boundaries by adhering to county lines where possible and preserving core voter populations proved a considerable constraint on the goal of defeating Marshall (on this point see Winburn Reference Winburn2008). There is no stronger evidence for this than the fact that Marshall's core constituency is found in the city of Macon in District 8's most populous county (Bibb County). Marshall grew up in Macon, was once the mayor of Macon, and he won his most lopsided margin (69% Democratic in 2006) in Bibb County. Nonetheless, by saddling Marshall with a very high percentage of new, largely white constituents, Georgia Republicans expected to be able to defeat the incumbent. They were almost right and this is all the more remarkable considering that these redrawn whites were more likely to vote Republican (Hood and McKee Reference Hood and McKee2008) in a short-term national climate that greatly favored the Democratic Party. The 2005 Georgia redistricting must be painfully ironic for Republicans. The selling point for redrawing the congressional map was to restore geographic order to district boundaries, but this also explains why they failed to unseat Congressman Marshall.
Compared to the 2003 Texas redistricting, the 2005 Georgia redistricting has received little scholarly attention. This is unfortunate because the circumstances surrounding this case make it noteworthy for what it reveals about intentions versus actual outcomes. Unlike Texas, where Republicans gave their Democratic opponents no quarter, the incident in Georgia is atypical because the GOP chose not to maximize their electoral opportunities. In fact, we know of no other contemporary examples that compare to the Georgia situation. To be sure, there are many notable instances where the intentions of a gerrymander go terribly awry (see Grofman and Brunell Reference Grofman, Brunell and Galderisi2005), but we are unable to cite a single cognate to this study where a political party had complete control of redistricting and elevated a self-imposed constraint above the goal of defeating the opposition.
We are left to conjecture that the robust GOP gains in recent elections bred a sense of overconfidence, and under these conditions Georgia Republicans granted their opponents an honest fight by making a more aesthetically appealing map their foremost priority. But because this prevented the Georgia GOP from defeating representatives Barrow and Marshall, we do not anticipate that this scenario will be repeated. In fact, it is highly doubtful that the “artful gerrymander” will ever be revisited. Consider it an aberration, a unique failed experiment, and hence the reason why this episode is so intriguing.
APPENDIX
Individual-Level Model of Voter Turnout in Georgia District 8

Notes: Entries are logistic regression coefficients with robust standard errors in parentheses.
*** p < .001; **p < .01; *p < .05 (two tailed).
Precinct-Level Models of Democratic Vote Choice in Georgia District 8

Notes: Entries are regression coefficients with robust standard errors in parentheses.
Models are weighted by precinct voter turnout.
*** p < .001;
** p < .01;
* p < .05 (two tailed).