I. INTRODUCTION
Irradiation of materials with very energetic ions can create a variety of structural modifications, including the formation of ion tracks, which are cylindrical zones of damage along the ion trajectory caused by electronic excitation. The ion-track structure depends critically on the physical and chemical properties of the material, as well as irradiation conditions, including temperature, pressure, and ion energy. Recent studies on pyrochlore oxides, A2B2O7,Reference Jozwik-Biala, Jagielski, Arey, Kovarik, Sattonnay, Debelle, Mylonas, Monnet and Thomé1–Reference Lang, Lian, Zhang, Zhang, Weber, Trautmann and Ewing3 have revealed a concentric, multi-zone track structure consisting of an amorphous core surrounded by a disordered structure. These oxides are important materials for inert matrix fuels, nuclear waste forms, and fast ionic conductors.Reference Subramanian, Aravamudan and Subba Rao4–Reference Ewing7 The use of ion beams to manipulate the nano-scale properties of solids with the formation of unique core–shell, ion-track structures coupled with atomic-scale simulation of the phase behavior far from equilibrium conditions, paves the way for the exploration of new structure types with novel properties.Reference Lang, Lian, Zhang, Zhang, Weber, Trautmann and Ewing3,Reference Lang, Zhang, Zhang, Wang, Schuster, Trautmann, Neumann, Becker and Ewing8,Reference Dammak, Dunlop, Lesueur, Brunelle, Della-Negra and Beyec9
Isometric pyrochlore is of particular interest for ion irradiation studies because the induced structural transformations depend strongly on the local atomic bonding environments. Irradiation with low energy (LE) ions (keV–MeV), where nuclear collisions dominate the damage process, causes either crystalline-to-amorphous or order-to-disorder transitions, depending on the cation ionic ratio (r A/r B).Reference Sickafus, Minervini, Grimes, Valdez, Ishimaru, Li, McClellan and Hartmann5,Reference Sickafus, Grimes, Valdez, Cleave, Tang, Ishimaru, Corish, Stanek and Uberuaga10 Recently, studies using swift heavy ions (GeV), where electronic energy loss dominates the damage process, showed concentric zones within a single track (i.e., Gd2Ti2Zr2−xO7 binary), which consisted of an amorphous core surrounded by a shell of disordered, defect fluorite. The relative amounts of each concentric zone depend on the composition. The resistance to irradiation-induced amorphization significantly increases with the Zr-content in the Gd2Ti2Zr2−xO7 binary.Reference Jozwik-Biala, Jagielski, Arey, Kovarik, Sattonnay, Debelle, Mylonas, Monnet and Thomé1,Reference Lang, Lian, Zhang, Zhang, Weber, Trautmann and Ewing3,Reference Zhang, Lang, Lian, Liu, Trautmann, Della-Negra, Toulemonde and Ewing11,Reference Sattonnay, Grygiel, Monnet, Legros, Herbst-Ghysel and Thomé12 Also, the composition-dependent ion-track morphology has also been observed in other complex oxides, i.e., orthorhombic Ln2TiO5 (Pnam).Reference Tracy, Lang, Zhang, Zhang, Wang and Ewing13
In this study, we have investigated the nano-scale phase transformation in different pyrochlore compositions that results from C60 clusters (MeV). These ions, which have a relatively low kinetic energy, create an energy loss that is comparable to that of fast, monatomic heavy ions (GeV), but they differ significantly with respect to the induced energy density (“velocity effect”).Reference Dammak, Dunlop, Lesueur, Brunelle, Della-Negra and Beyec9,Reference Dunlop, Jaskierowicz and Della-Negra14,Reference Dunlop, Jaskierowicz, Ossi and Della-Negra15 Ions of a few MeV per nucleon deposit their energy in the material mainly via inelastic collisions with the target electrons, leading to electronic excitation and ionization. For cluster ions, C60, the initial radial energy deposition is limited to a diameter of a few nanometers around the ion path. In contrast, the energy deposited by swift heavy (monoatomic) ion, with a similar dE/dx, is smeared out over a micrometer-sized region around the ion path. While details of the energy deposition process from projectile to the target remain unclear, two mechanisms have been used to explain ion-track formation from the ionization process. The Coulomb explosion model proposes that the ionization of atoms in the proximity of the ion path results in interatomic electrostatic repulsion, causing a radial pressure wave that destroys the crystalline structure.Reference Bringa and Johnson16 In contrast, the thermal spike model explains the energy transfer from excited electrons to the target atoms by electron–phonon coupling, which leads to intense local heating in the target material along the ion path.Reference Toulemonde, Dufour, Meftah and Paumier17,Reference Trautmann, Klaumünzer and Trinkaus18 Molecular dynamic simulations have shown that the resulting structure within the ion track depends critically on a competition of rapid quenching and recrystallization.Reference Zhang, Lang, Ewing, Devanathan, Weber and Toulemonde2,Reference Wang, Lang, Ewing and Becker19 The purpose of the present study is to investigate the complex track structure in tracks created by C60 irradiation. Because the ion track is larger and has distinct boundaries, it can provide unique perspective into the energetics of track formation in different pyrochlore compositions. By comparison to the track structure created by swift heavy ions, the experimental results can be used for comparison with the results calculated using the inelastic thermal spike model.Reference Toulemonde, Dufour, Meftah and Paumier17
II. EXPERIMENTAL METHODS
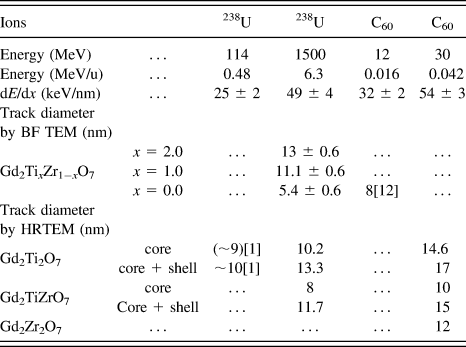
Polycrystalline pyrochlore samples (Gd2Ti2O7, Gd2TiZr2O7, and Gd2Zr2O7) were synthesized by solid-state reaction with a grain size on the order of a few microns.Reference Zhang, Wang, Lian, Lang, Becker and Ewing20 Irradiation with C60+ ions was completed at the IPN Orsay tandem accelerator at room temperatures and under normal incidence. The energy of the C60+ ions was 30 MeV, which leads to a penetration depth in pyrochlore of more than 1 μm (calculated by SRIM 2008).21 The applied fluence was between 5 × 10¹⁰ ions/cm2 and 1 × 10¹¹ ions/cm2, which is sufficiently low to avoid the overlap of tracks. The beam conditions for the cluster and monoatomic ions, including electronic energy loss, dE/dx, and specific energy, are summarized in Table I. Before the irradiation of C60+ ions, small amounts of the pyrochlore samples were ground and dispersed on carbon-coated TEM grids, which make direct TEM characterization possible after radiation. Thin edges of small grains were characterized by TEM observation, which has a thickness thinner than that of the ion range. Thus, the ions penetrated completely the thin regions, and the damage structure shown in top-view TEM images represents the accumulated ion-track morphology throughout the entire grain thickness without overlap of the undamaged matrix.
Diameters of tracks in pyrochlore Gd2TixZr1−xO7 observed by TEM and irradiated by U ions and C60 clusters. The comparison of dE/dx of all ions is calculated from SRIM 2008.

Monoatomic 1.5 GeV 238U ions were provided from the beamline X0 of the UNILAC linear accelerator at the GSI Helmholtz Center (Darmstadt, Germany). Irradiation was done at room temperature and under normal incidence, with a fluence at 5 × 10¹⁰ ions/cm2. Pyrochlore samples were pre-polished down to a thickness of ∼40 µm such that the ions penetrated the entire thickness. After irradiation with uranium ions, the samples were prepared either by crushing the irradiated crystals into fine powders or by conventional TEM-specimen preparation, including polishing and ion milling. This allowed the imaging of damage tracks along their length or in cross section, depending on the relative directions of the electron beam and ion tracks. Bright-field TEM and high-resolution TEM characterization were completed using a JEOL 3011.
III. TEM CHARACTERIZATION OF ION TRACKS
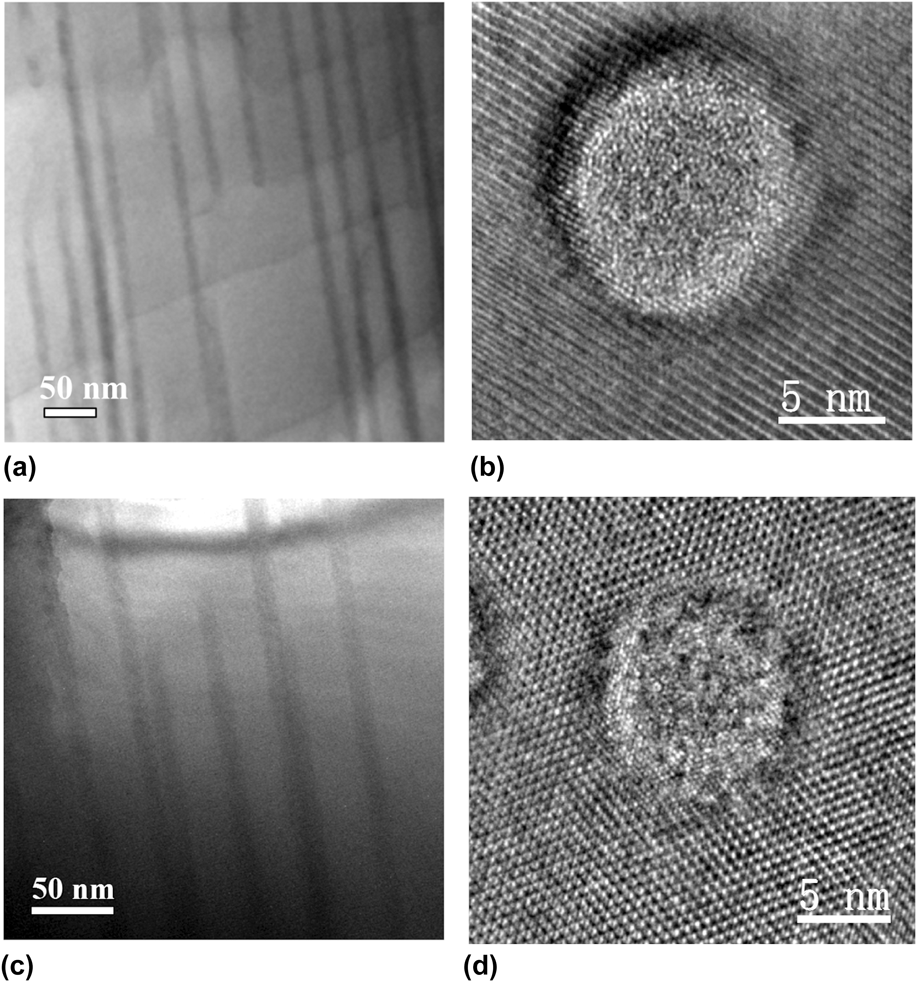
Because the C60+ cluster irradiation experiment was conducted through the thin pyrochlore samples under normal incidence, the tracks size and damage morphology could be directly investigated by HRTEM images. Figure 1 shows HRTEM images of C60+ cluster-induced ion tracks in pyrochlore with different compositions (Gd2Ti2O7, Gd2TiZrO7, and Gd2Zr2O7). The amorphous phase is the dominant track feature in Gd2Ti2O7 [Fig. 1(a)] with a limited shell of disordered interfacial structure between the amorphous and undamaged pyrochlore matrix. The overall track diameter is ∼17 nm with a width of the amorphous core of 14.6 nm. For Gd2TiZrO7, the relative amount of amorphous phase within an ion track is noticeably reduced as compared with Gd2Ti2O7 [Fig. 1(b)]. With a total track diameter of ∼15 nm, the amorphous core has extended to a diameter of 10 nm. Due to the limited size of the disordered shell [Figs. 1(a) and 1(b)], a fast Fourier transform (FFT) analysis was not feasible for this region of the HRTEM images. The intensity profiles [Figs. 1(d) and 1(e)] across selected lattice fringes [Figs. 1(a) and 1(b)] provide additional structural detail of the track zone between the amorphous core and the undamaged pyrochlore matrix in Gd2Ti2O7 and Gd2TiZrO7. The width of this shell-type structure is ∼1.2 nm for Gd2Ti2O7 and ∼2.8 nm for Gd2TiZrO7, as illustrated by the evolution of the corresponding intensity profiles. No amorphous core was evident in Gd2Zr2O7 [Fig. 1(c)] after irradiation, and the ion track consists entirely of the disordered, defect-fluorite structure (diameter: 12 nm). Gd2Zr2O7 has the largest diameter track of disordered, defected fluorite structure, and this is consistent with the observation that this composition is extremely radiation resistant, remaining crystalline to a high dose of ion irradiation with energies ranging from keV to GeV.Reference Sickafus, Minervini, Grimes, Valdez, Ishimaru, Li, McClellan and Hartmann5,Reference Ewing, Weber and Lian6,Reference Lian, Wang, Wang, Chen, Boatner and Ewing22–Reference Lian, Wang, Chen, Sun, Ewing, Matt Farmer and Boatner24 Fig. 2 shows 1.5 GeV U ions tracks in the pyrochlore samples (Gd2Ti2O7 and Gd2TiZrO7) along the track length and in cross-section. The ion track diameter measured from cross-sectional view (with BF TEM images) is 13 ± 0.6 nm for Gd2Ti2O7 and 11.1 ± 0.6 nm for Gd2TiZrO7 (Table I). The measured sizes are consistent when compared with the size of “core + shell” from the atomic resolution HRTEM images showing the ion tracks [Figs. 2(b) and 2(d)]. Similar to the C60+ track morphology, there is less of the amorphous core in the Gd2TiZrO7 as compared with Gd2Ti2O7 in the U ion tracks.
HRTEM images of C60+ cluster-created ion tracks in pyrochlore with varied compositions (a) Gd2Ti2O7, (b) Gd2TiZrO7, and (c) Gd2Zr2O7 (FFTs are included and noted as P for pyrochlore, F for fluorite) from top view. The total diameter (core + shell) of the ion tracks in the compounds is 17, 15, and 12 nm, respectively (d), and (e) shows the intensity profiles of lattice fringes across the white line illustrated in (a) and (b). The shell structure is ∼1.2 nm wide in (d), illustrated in the left ranging 4 lattice spaces, that is different from the right section in the profile showing the periodic strong and weak peak variation due to the 2 × 2 ordered pyrochlore structure. Similarly, the shell structure is ∼2.8 nm wide in (e), illustrated in the left ranging 9 lattice spaces.
Bright-field and high-resolution TEM images of ion tracks in Gd2Ti2O7 [(a) and (b)] and Gd2TiZrO7 [(c) and (d)] irradiated by 1.5 GeV U ions.
To compare the dimensions of the tracks due to irradiations by C60+ with U ions, the diameters of “core” and “core + shell” were measured (Table I). For Gd2Ti2O7, the “core” size from C60+ is 14.6 nm, 43% larger than the “core” size from U ions (10.2 nm), while the “core + shell” size from C60+ is 17 nm, 28% larger than the core size from U ions (13.3 nm). The amorphous portion is different, with 86% for C60+ track and 77% for U ion track. For Gd2TiZrO7, the “core” size from C60+ is 10 nm, 25% larger than the “core” size from U ions (8 nm), while the “core + shell” size from C60+ is 15 nm, 28% larger than the “core + shell” size from U ions (11.7 nm). The amorphous portion is similar, with 68% for C60+ track and 67% for U ion track. A recent study focusing on the ion-track morphology for a range of monoatomic ions with different energy loss revealed that the mean track diameter increases significantly with dE/dx.Reference Lang, Toulemonde, Zhang, Zhang, Tracy, Lian, Wang, Weber, Severin, Bender, Trautmann and Ewing25 This study focuses on the velocity effect by using C60 cluster and monoatomic 238U ions of similar dE/dx but very different kinetic energy (54 keV/nm for 30 MeV C60 cluster and 49 keV/nm for 1.5 GeV 238U). The projectile velocity, v, of the cluster ions is about 1 order of magnitude lower than that of the U ions. Thus, the energy distribution of the δ electrons emitted during the ionization process is significantly different, and this affects the energy density.
The concentric nano-scale zones, as revealed by HRTEM of crystalline and amorphous domains, are present in both the tracks of cluster and monoatomic ions. They provide unique evidence of the extreme environment induced by the highly ionizing ion irradiation, which serves as basis for the interpretation of the energy distribution, temperature variation, and quenching kinetics. The shell of the defect-fluorite structures in Gd2Ti2O7 has a limited thickness of 1–2 nm, and this is consistently observed over a wide dE/dx regime.Reference Lang, Toulemonde, Zhang, Zhang, Tracy, Lian, Wang, Weber, Severin, Bender, Trautmann and Ewing25 Both the C60 cluster and 238U ions with the maximum dE/dx agree with this observation. The fluorite-structured track shell, which is observed in all Ti-containing pyrochlore compositions (the tracks consist entirely of the disordered, fluorite structure of Gd2Zr2O7), has been explained by molecular dynamic calculations, as being the result of damage recovery and epitaxial recrystallization at the interface of the molten track core and the surrounding pyrochlore matrix.Reference Zhang, Lang, Ewing, Devanathan, Weber and Toulemonde2 The recrystallization proceeds inward from the track boundary to the central region during the cooling process. If the crystallization front moves at a constant velocity for the different projectiles, a similar shell thickness can be expected. This may provide an indication of local temperature variation, which is supported by the thermal spike model. In addition to the kinetic limitation, the defect-fluorite structure forms a thin shell of relatively constant thickness (1–2 nm) due to thermodynamic constraints. The disordered, defect-fluorite structure for Gd2Ti2O7 pyrochlore is a non-equilibrium phase that is not energetically favored because of the large difference of the A-site and B-site cation ionic radii.Reference Lian, Wang, Chen, Sun, Ewing, Matt Farmer and Boatner24 Within the extreme environment of the nano-scale ion tracks, this non-equilibrium phase exists metastably as a thin shell surrounding the amorphous core. This is supported by the morphology of isolated damage domains Gd2Ti2O7 induced by Ni ions of low dE/dx below the critical threshold for track formation, which exists as nano-sized defect-fluorite structured islands within the pyrochlore matrix.Reference Lang, Toulemonde, Zhang, Zhang, Tracy, Lian, Wang, Weber, Severin, Bender, Trautmann and Ewing25 At higher fluences, the fluorite domains overlap and gradually transform into the amorphous phase.
Gd2Zr2O7 is known to have an extremely high resistance to radiation-induced amorphization. The binary system Gd2TixZr2−xO7 (x = 0 to 2) has been the subject of systematic investigations of the radiation response to LE ions (keV–MeV).Reference Wang, Wang, Ewing, Was and Lumpkin26–Reference Lian, Zu, Kutty, Chen, Wang and Ewing28 The Ti-rich compositions are susceptible to ion-induced amorphization, while the Zr-rich compositions are increasingly radiation resistant. Only the Gd2Zr2O7 end-member retains its crystallinity up to 100 dpa without any evidence of amorphization.Reference Wang, Wang, Ewing, Was and Lumpkin26–Reference Lian, Zu, Kutty, Chen, Wang and Ewing28 Instead, the ordered pyrochlore structure was transformed into the disordered, defect-fluorite structure. The same trend has been observed for the different pyrochlore compositions irradiated by swift heavy ions.Reference Zhang, Lang, Ewing, Devanathan, Weber and Toulemonde2,Reference Lang, Lian, Zhang, Zhang, Weber, Trautmann and Ewing3,Reference Lang, Zhang, Ewing, Lian, Trautmann and Wang29 While ion tracks created by monoatomic ions are difficult to analyze in detail because the boundary between disordered fluorite and pyrochlore matrix is less distinct, the present study shows, for the first time, a clearly resolved ion track with completely crystalline, disordered, defect-fluorite structure present, but without any amorphization being observed. However, a previous cross-sectional TEM study on the Gd2Zr2O7 irradiated with 12 MeV C60 cluster ions showed amorphization in near-surface regions, accompanied by the formation of nanocrystals of a disordered, defect-fluorite structure.Reference Zhang, Lang, Lian, Liu, Trautmann, Della-Negra, Toulemonde and Ewing11 Multi-structured hillocks were observed on the surface of the sample, including fully-amorphous, fully-disordered, defect-fluorite structure, as well as a mixture of both phases. Thus, the amorphization observed near the Gd2Zr2O7 surface from cross-sectional TEM characterization may originate from the accumulation of the hillocks with amorphous structure.
IV. TRACK DESCRIPTION BY THE INELASTIC THERMAL SPIKE MODEL
A. The inelastic thermal spike model
In this model, the electron and the lattice subsystems are correlated as two coupled systems. The kinetic energy of the ionizing ion irradiation is deposited into the electron system of the target, where thermalization occurs within about 10−15 s. The hot electrons then transfer their energy by electron–phonon coupling to the cold lattice in which thermal equilibrium is reached after about 10−13 s (typical time for lattice vibrations). The heat diffusion between the electron and lattice subsystems is described by classical heat equations with the electronic energy loss being the heat source term. The energy exchange term is given by the product g × (T e − T a) with g being the coupling constant and (T e − T a) the temperature difference between the two subsystems. Due to the cylindrical geometry of the ion–matter interactions, the two differential heat equations are expressed in cylindrical coordinates as follows:
 $${C_{\rm{e}}}\left( {{T_{\rm{e}}}} \right){{\partial {T_{\rm{e}}}} \over {\partial t}} = {1 \over r}{\partial \over {\partial r}}\left[ {r{K_{\rm{e}}}\left( {{T_{\rm{e}}}} \right){{\partial {T_{\rm{e}}}} \over {\partial r}}} \right] - g\left( {{T_{\rm{e}}} - {T_{\rm{a}}}} \right) + A\left( {r,t} \right)\quad ,$$
 $${C_{\rm{a}}}\left( {{T_{\rm{a}}}} \right){{\partial {T_{\rm{a}}}} \over {\partial t}} = {1 \over r}{\partial \over {\partial r}}\left[ {r{K_{\rm{a}}}\left( {{T_{\rm{a}}}} \right){{\partial {T_{\rm{a}}}} \over {\partial r}}} \right] + g\left( {{T_{\rm{e}}} - {T_{\rm{a}}}} \right)\quad ,$$
where T e,a, C e,a, and K e,a are, respectively, the temperatures, the specific heat coefficients, and the thermal conductivities of the electronic (index e) and lattice subsystems (index a).
A(r,t) denotes the spatiotemporal energy deposition of the projectile to the electron subsystem described by a Gaussian time distribution and a radial distribution D(r) of the delta-electrons according to the Katz modelReference Waligórski, Hamm and Katz30
 $$A\left( {r,t} \right) = b\;{S_{\rm{e}}}\;{e^{ - {{{{\left( {t - {t_0}} \right)}^2}} \mathord{\left/ {\vphantom {{{{\left( {t - {t_0}} \right)}^2}} {2\,{{\rm{s}}^2}}}} \right. \kern-\nulldelimiterspace} {2\,{{\rm{s}}^2}}}}}\;D\left( r \right)\quad .$$
The majority of the electrons deposit their energy close to the ion path within t o = 10−15 s.Reference Gervais and Bouffard31 The normalization factor b ensures that the integration of A(r,t) over space and time is equal to the total electronic energy loss dE/dx.Reference Dufour, Audouard, Beuneu, Dural, Girard, Hairie, Levalois, Paumier and Toulemonde32 The fraction F(r) of the deposited energy into a radius r is calculated as
 $$F\left( r \right) = {{\left( {\int_0^\infty {{\rm{d}}t} \int_0^r {A\left( {r,t} \right)2\pi r{\rm{d}}r} } \right)} \mathord{\left/ {\vphantom {{\left( {\int_0^\infty {{\rm{d}}t} \int_0^r {A\left( {r,t} \right)2\pi r{\rm{d}}r} } \right)} {\left( {\int_0^\infty {{\rm{d}}t} \int_0^\infty {A\left( {r,t} \right)2\pi r{\rm{d}}r} } \right)}}} \right. \kern-\nulldelimiterspace} {\left( {\int_0^\infty {{\rm{d}}t} \int_0^\infty {A\left( {r,t} \right)2\pi r{\rm{d}}r} } \right)}}\quad ,$$
and is plotted versus r in Fig. 3 for LE ions of ∼0.1 MeV/u and high energy (HE) ions of 7 MeV/u. As previously defined,Reference Baranov, Martynenko, Tsepelevich and Yavlinskiĭ33 a cylinder radius, in which 66% of S e is deposited, characterizes the initial energy distribution on the electrons due to the beam energy and is equal to 0.41 and 4.9 nm for 0.1 and 7 MeV/u, respectively. This means that for the same electronic energy loss, the energy density deposited into the electron system is one order of magnitude larger for the cluster ions. The velocity effect is illustrated in the discussion of the measured track size by the inelastic thermal spike model in Y3Fe5O12,Reference Lang, Zhang, Ewing, Lian, Trautmann and Wang29,Reference Meftah, Brisard, Costantini, Hage-Ali, Stoquert, Studer and Toulemonde34 in Fe,Reference Dunlop, Lesueur, Legrand, Dammak and Dural35–Reference Toulemonde, Assmann, Dufour, Meftah and Trautmann37 and recently in CaF2.Reference Toulemonde, Costantini, Dufour, Meftah, Paumier and Studer38
Initial energy distribution on the electrons versus radial distance from the ion path for C60 cluster at 0.1 MeV/u and U ion at 7 MeV/u.
The exact values of the thermal parameters in the electronic subsystem, C e and K e = C e × D e, (D e is the electron diffusivity), are difficult to define in insulators, since there are no free electrons as in metals. However, according to Baranov et al.,Reference Baranov, Martynenko, Tsepelevich and Yavlinskiĭ33 one can assume that the hot electrons in the conduction band of an insulator will behave similarly to hot and free electrons in a metal with C e ∼ 1.5 × k B × n e (∼1 J/cm3 × K) where k B is the Boltzmann constant and n e is the number of excited electrons per atom (∼1). D e is equal to the product of the electron Fermi velocity and the inter-atomic distance (∼2 cm2/s).Reference Toulemonde, Dufour, Meftah and Paumier17 The electron–phonon coupling constant, g, of insulators is correlated to the electron–phonon mean free path, λ, by the relation λ2 = C e × D e/g. A systematic study with several insulators has shown that λ decreases with the optical band gap, independently, whether the insulator can be amorphized by the ion beam (e.g., SiO2) or not (e.g., LiF).Reference Toulemonde, Dufour, Meftah and Paumier17,Reference Toulemonde, Assmann, Dufour, Meftah, Studer and Trautmann39 Based on such empirical correlation, λ has been determined for Gd2Ti2O7, Gd2TiZrO7, and Gd2Zr2O7 to be equal to 4.9, 4.3, and 3.8 nm, corresponding to a calculated band gap of 3.3, 7.4, and 11.5 eV, respectively,Reference Wilde and Catlow40 since the optical band gap is not experimentally known. When the electronic temperature has cooled down below T a, electrons are assumed to be trapped at the lattice, and consequently the lattice cooling by free electrons is inhibited.Reference Dufour, Audouard, Beuneu, Dural, Girard, Hairie, Levalois, Paumier and Toulemonde32 The thermodynamic parameters, such as specific heat, thermal conductivity, solid and liquid mass density, and melting temperature are used from experimental data in the literature for this study.Reference Sattonnay, Grygiel, Monnet, Legros, Herbst-Ghysel and Thomé12 The thermal conductivity of Gd2(TixZr1−x)2O7 is within the range of 1.33–2.86 W m−1 K−1 from room temperature to 1600 K.Reference Liu, Ouyang, Zhou and Xia41 Moreover, all the calculations were performed assuming a superheating scenario,Reference Toulemonde, Assmann, Trautmann and Gruner42 i.e., the increase in temperature never stops at the melting (vaporization) temperature, but the energy necessary to create a track does take into account the energy required to make the phase change from solid to liquid.Reference Toulemonde, Assmann, Dufour, Meftah, Studer and Trautmann39 However, for pyrochlore compositions in this study, the latent heat is unknown and will be a parameter required to be determined in the present track description by the inelastic thermal spike model.
B. Analysis of total track size: “core + shell”
Such an analysis has been previously completed in the paper of Lang et al.Reference Lang, Toulemonde, Zhang, Zhang, Tracy, Lian, Wang, Weber, Severin, Bender, Trautmann and Ewing25 to explain the diameter evolution of ion tracks in Gd2Ti2O7 as a function of energy loss. The basis for these thermal-spike calculations was high-resolution TEM images of ∼7 MeV/u ion tracks consisting of an amorphous core surrounded by a defect-fluorite shell (“core + shell” track). Using λ = 4.9 nm, the energy density deposited to the lattice is plotted versus time in Fig. 4 for U ions at 7 MeV/u. The energy density required to reach a track size (core + shell) with a diameter of 13 nm (Table I) is 0.9 eV/at, in quite good agreement with Lang et al.Reference Lang, Toulemonde, Zhang, Zhang, Tracy, Lian, Wang, Weber, Severin, Bender, Trautmann and Ewing25 The dE/dx threshold and track sizes [Fig. 5(a)] measured are very well described [Fig. 5(a)] by extending the i-TS model for all the values of dE/dx with a beam energy of 7 MeV/u using the same value of λ (4.9 nm) and energy density (0.9 eV/at). This energy density is associated with the critical energy to induce nano-scale melting in Gd2Ti2O7 (E m) (Table II).Reference Lang, Toulemonde, Zhang, Zhang, Tracy, Lian, Wang, Weber, Severin, Bender, Trautmann and Ewing25 To show that this empirical λ value deduced from the calculated optical band gap is sound, two other calculations were performed with λ = 4.5 and 7 nm. Using the experimental threshold for track formation (11 keV/nm)Reference Waligórski, Hamm and Katz30 to determine the energy density required to create a track, equal to 0.56 and 1.21 eV/at for λ = 7 and 4.5 nm, respectively, these calculations were extended to larger values of dE/dx [Fig. 5(a)]. The best fit is clearly for λ = 4.9 nm and E = 0.9 eV/at, confirming that the λ value deduced from the calculated optical band gap is the only value associated with E m = 0.9 eV/at to describe the track sizes in Gd2Ti2O7.
Energy versus time for U ions at 7 MeV/u and C60 at 0.1 MeV/u deduced from the thermal spike model. The dotted line (quoted E a) corresponds to the energy density of the atoms for the diameter of the amorphous core while the continuous line (quoted E m) to the diameter of the total track, amorphous core + defect-fluorite shell.
(a) Fit of the track radii observed by HREM and created by ion irradiation at 7 MeV/u (HE) within the framework of the i-TS model. The best fit is given by a unique couple of values of the electron–phonon mean free path (λ ∼ 4.9 nm) and energy to melt the Gd2Ti2O7 of E m ∼ 0.9 eV/at. (b) Description of the track radii (core + shell) with different ion beam energy observed by HREM and BFM. Open points correspond to beam energy of ∼7 MeV/u (HE) and full points to ∼0.1 MeV/u (LE).
Energy density to create a track (core + shell) in Gd2TixZr2−xO7. C s is the specific heat, T m the melting temperature, E Tm the energy to reach the melting temperature, λ the electron–phonon mean free path, and E m the energy to create a track, i.e., to create a molten phase.
a By interpolation.
Extending the i-TS calculations for low beam energy (∼0.1 MeV/u) by changing the initial energy distribution on the electrons as shown in Fig. 3, the energy density deposited on the atoms versus time is plotted in Fig. 4 for C60 cluster, using λ = 4.9 nm. For a diameter of 17 nm, the deposited energy density is ∼0.85 eV/at, in agreement with the one deduced from the analysis of track measured at 7 MeV/u within the experimental errors. The calculation is extended successfully [Fig. 5(b)] for all track diameters measured at low beam energy as a function of dE/dx using λ = 4.9 nm and E m = 0.9 eV/at. The diameter behavior from calculations based on the present analysis of U and C60 tracks is very consistent with a wide range of experimental electron microscopy results using high-resolution electron microscopy (HREM) or bright-field microscopy (BFM) from Lang et al.,Reference Lang, Toulemonde, Zhang, Zhang, Tracy, Lian, Wang, Weber, Severin, Bender, Trautmann and Ewing25 Sattonnay et al.,Reference Sattonnay, Moll, Thomé, Decorse, Legros, Simon, Jagielski, Jozwik and Monnet43 and Jozwik-Biala et al.,Reference Jozwik-Biala, Jagielski, Arey, Kovarik, Sattonnay, Debelle, Mylonas, Monnet and Thomé1,Reference Jozwik-Biala, Jagielski, Thomé, Arey, Kovarik, Sattonnay, Debelle and Monnet44 independent of the ion energy. The thermal-spike calculations predict a critical electronic energy loss threshold for track formation of 3 keV/nm for low energies (0.1 MeV/u).
For Gd2TiZrO7 with λ = 4.3 nm as deduced from the calculated optical band gap,Reference Toulemonde, Dufour, Meftah and Paumier17,Reference Wilde and Catlow40 E m was determined based on thermal-spike calculations using the experimental track size (core + shell) of the C60 (at ∼0.05 MeV/u) and U ion (at 6.3 MeV/u) tracks (core + shell). The E m parameter was determined from the experimental results (Table I) following the same procedure as for Gd2Ti2O7. The mean value of E m is equal to 1.05 eV/at and is larger than the one determined for Gd2Ti2O7. The track size is calculated for a large range of electronic energy loss for two beam energies (0.05 and 6.3 MeV/u) (Fig. 6) using E m = 1.05 eV/at as the criterion to create a track. Within the experimental errors, the calculated diameter versus energy loss behavior is in good agreement with other experimental results from bright-field and high-resolution TEM.Reference Moll, Sattonnay, Thomé, Jagielski, Legros and Monnet45 In addition, the energy loss threshold determined by Moll et al.Reference Moll, Sattonnay, Thomé, Jagielski, Legros and Monnet45 is also described by the i-TS model.
Fit of the track radii created by cluster and ions at ∼0.1 MeV/u (LE) observed by HREM within the framework of the i-TS model for (a) Gd2TiZrO7 and (b) Gd2Zr2O7. The best fits are given by a unique couple of values of electron–phonon mean free path of λ (4.3 and 3.8 nm) and energy E m to melt the material (1.05 and 1.5 eV/at) for Gd2TiZrO7 and Gd2Zr2O7, respectively. Extrapolation to high beam energy (HE) for track observed by BFM is performed. Open points correspond to beam energy of ∼7 MeV/u (HE) and full points to ∼0.1 MeV/u (LE).
The same calculations have been performed for Gd2Zr2O7 (λ = 3.8 nm and E m = 1.5 eV/at) deduced from the fit of the track created by C60 clusters and U ions at LE [Fig. 6(b)].Reference Zhang, Lang, Lian, Liu, Trautmann, Della-Negra, Toulemonde and Ewing11 Again, E m becomes even larger than for the two other pyrochlores. There is a good agreement between the model and the tracks measured at LE (0.1 MeV/u). However, for HE ions at ∼7 MeV/u, the size of tracks measured from BFM or HREM seems to be systematically below the thermal-spike calculations, which may come from the difficulty of measuring the track size in the Gd2Zr2O7 with less distinct boundary of the track morphology. This can be also seen from another Zr-rich pyrochlore (Gd2Ti0.5Zr1.5O7) in Fig. 7(b), which shows a similar discrepancy in experimental measurement and calculation, while consistency between the model and the track size measurements is shown in Fig. 7(a), Ti-rich composition (Gd2Zr0.5Ti1.5O7).
i-TS model prediction for the intermediate composition Gd2Ti1.5Zr0.5O7 (λ = 4.6 nm and E m = 0.97 eV/at) (b) and Gd2Ti0.5Zr1.5O7 (λ = 4.1 nm and E m = 1.25 eV/at) (a). Comparison with track radii observed by BFM at HE created by a beam at 7 MeV/u.
The E m values (Table II) are compared with the energy necessary to reach the melting temperature (E Tm) using the specific heat from the Dulong–Petit law. Since within the i-TS model, E m is related with the energy to reach a molten phase within the tracks, the difference with E Tm can be associated to the latent heat of fusion, for which the calculated values in kJ/mole are given in Table II. Since the difference between 0.54 and 0.9 eV/at for Gd2Ti2O7 corresponds to a latent heat of 380 kJ/mol in good agreement with ∼350 kJ/mol, the latent heat is determined experimentally for La2Zr2O7 pyrochlore.Reference Radha, Ushakov and Navrotsky46 So, it is expected that it is possible to determine the latent heat of fusion of such insulators by analyzing track size with the i-TS model.
C. Analysis of the radial structure: Core and shell
Following the same procedure as discussed in the section above, the minimum energy density deposited to the atoms in order to create an amorphous core (E a) was determined for Gd2Ti2O7 and Gd2TiZrO7 irradiated with C60 cluster and U ions. These values are plotted in Fig. 8(a) together with the corresponding E m data and completed by the E m and E a deduced from a previous study.Reference Lang, Toulemonde, Zhang, Zhang, Tracy, Lian, Wang, Weber, Severin, Bender, Trautmann and Ewing25 For irradiation performed at ∼7 MeV/u, and in contrast to the constant behavior of E m as function of dE/dx, the E a values vary over the studied range of electronic energy loss [Fig. 8(a)]. It appears that E a is equal to ∼1.55 eV/at from 21 to 32 keV/nm and then decreases to 1.06 eV/at reached for dE/dx larger than 40 keV/nm, the transition being at ∼37 keV/nm [Fig. 8(a)]. For dE/dx larger than 37 keV/nm, the energy density in the center of the track becomes larger than 2.5 eV/at (Fig. 4). Surprisingly, the E a values deduced from irradiation experiments at ∼0.45 MeV/u (dE/dx = 25 keV/nm) are 0.95 eV/at (Fig. 9) lower than the determined value with ions at 7 MeV/u (Fig. 9) but in agreement with the values extracted from 7 MeV/u ions for an electronic energy loss larger than 40 keV/nm in Gd2Ti2O7 within the experimental errors [Fig. 8(a)]. It may be possible that the low value of E a for S e = 25 keV/nm with U beam at 0.45 MeV/u is a result of the called “velocity effect”.Reference Meftah, Brisard, Costantini, Hage-Ali, Stoquert, Studer and Toulemonde34 The maximum energy density deposited on the atoms calculated with the thermal spike is plotted versus dE/dx for two beam energies 0.5 and 7 MeV/u (Fig. 10). This energy density is larger than 2.8 eV/at either for dE/dx larger than 37 keV/nm with beam energy of 7 MeV/u or for dE/dx > 15 keV/nm with beam energy of 0.5 MeV/u (Fig. 10). This figure defines also the different energy density range needed to create a track: for E a > 0.9 eV/at creation of a defect-fluorite track till 1.6 eV/at, then small amorphous core + defect-fluorite shell between 1.6 and 2.8 eV/at, and for >2.8 eV/at a large amorphous core + defect-fluorite shell. Such correlation between energy density and radial morphology of the track should be confirmed by irradiation at low beam energy (0.5 MeV/u) for dE/dx between 5 and 15 keV/nm.
Energy density on the atoms to create an amorphous core or to create a total track (core + shell). The lines are there to guide the eyes.
Energy versus time for U ions at 0.45 MeV/u and Xe at 7 MeV/u deduced from the thermal spike model. The dotted line (quoted E a) corresponds to the energy density of the atoms for the diameter of the amorphous core while the continuous line (quoted E m) to the diameter of the total track, amorphous core + defect-fluorite shell.
Maximum energy density versus electronic energy loss calculated by the i-TS model. The different ranges describe the track structure. “A” stands for amorphous and “DF” for defect-fluorite crystal.
Applying the same analysis for Gd2TiZrO7, the values of E m and E a are plotted in Fig. 8(b). The larger E a values in Gd2TiZrO7 than in Gd2Ti2O7 for the same range of electronic energy loss support that such a material is more difficult to amorphize, since r A/r B is smaller (Table II).Reference Sickafus, Minervini, Grimes, Valdez, Ishimaru, Li, McClellan and Hartmann5
V. CONCLUSIONS
We present an atomic-scale characterization of ion tracks in the binary system of Gd2TixZr2−xO7 (x = 0, 1, and 2) that result from the extremely ionizing radiation of energetic C60 cluster and monoatomic 238U ions. The morphology of the ion tracks from both ion beams is complex, forming concentric zones of different structures: an amorphous track core surrounded by a disordered, defect-fluorite structured shell. An increasing ratio of defect-fluorite/amorphous structure results with increasing Zr-content, as was evident for both types of irradiation, in agreement with previous ion-beam studies of this pyrochlore binary. In terms of the dimension of the tracks for C60+ and U ions, for Gd2Ti2O7, the “core” and “core + shell” sizes from C60+ are 14.6 nm and 17 nm, larger than those from U ions (10.2 and 13.3 nm). For Gd2TiZrO7, the “core” and “core + shell” sizes from C60+ are 10 and 15 nm, larger than the size of the tracks created by U ions (8 and 11.7 nm). Inelastic thermal-spike calculations have been used to describe the track size in terms of the velocity effect, since the present irradiation studies comprise two very different kinetic energies but with a very similar energy loss. To apply this model, two parameters are needed: the electron–phonon mean free path, λ, and the energy to melt, E m, of the considered material. They are determined by fitting the total track size (amorphous core if it exists + defect-fluorite shell). The deduced electron–phonon mean free paths and the energy to melt the material used to fit the tracks are equal to λ = 4.9, 4.3, 3.8 nm with E m = 0.9, 1.05 and 1.5 eV/at for Gd2Ti2O7, Gd2TiZrO7, and Gd2Zr2O7, respectively. The unique C60 cluster, with higher deposited energy density compared to the monoatomic ions, can create larger tracks and generate distinct boundaries in the pyrochlores. The correlation of experimental results and inelastic thermal-spike calculations can provide unique insights for interpretation of the energetics of track formation in solids.
ACKNOWLEDGMENTS
This work was supported as part of the Materials Science of Actinides, an Energy Frontier Research Center funded by the U.S. Department of Energy, Office of Science, Office of Basic Energy Sciences under Award #DE-SC0001089.