Implications
In countries with less-favourable socio-economic conditions and small dairy herds, genetic evaluation for longevity traits is important to keep milk production profitable. Longevity traits for dairy cows in small herds require careful modelling because of their specific culling policy, which affects breeding value prediction. Functional and true longevity are commonly used for genetic evaluations. The correlation between these two traits underlines the impact of voluntary culling on breeding value evaluation.
Introduction
Sustainability of milk production systems relies on economical, societal and environmental benefits. Increasing survival and longevity is the first solution for reduction in replacement costs (Boichard and Brochard, Reference Boichard and Brochard2012). Routine genetic evaluation for longevity (or length of productive life) of dairy cows is carried out in most developed countries now. In August 2011, 19 countries with different numbers of breeds were involved in the multiple across-country evaluation (MACE) on longevity (Interbull, 2011). Out of these 19 countries, 10 were using survival analysis assuming a sire or sire–maternal grand sire model to predict the breeding values for functional or true longevity (Forabosco et al., Reference Forabosco, Jakobsen and Fikse2009). Survival analysis usually models a longevity measure through a hazard function, which describes the limiting probability for a cow to die or to be culled at a specific time, given she was alive in the same herd just before it. All survival analysis models currently used for genetic evaluations are proportional hazard models (Kalbfleisch and Prentice, Reference Kalbfleisch and Prentice1980). One of the reasons for not applying survival analysis to the remaining nine countries might be the more complex and demanding computations required compared with linear mixed models. Countries where it is considered that an animal model must be applied, mixed models may be preferred because computation time and memory requirements are lower, although some approximate animal model evaluations have been proposed (Ducrocq, Reference Ducrocq2001).
For genetic evaluation, different definitions of longevity have been used: stayability (e.g. Van Doormaal et al., Reference Van Doormaal, Schaeffer and Kennedy1985), survival to the next lactation (e.g. Jairath et al., Reference Jairath, Dekkers, Schaeffer, Liu, Burnside and Kolstad1998), number of lactations (e.g. Yazdi et al., Reference Yazdi, Thompson, Ducrocq and Visscher1999) and so on; however, length of production life (e.g. Chirinos et al., Reference Chirinos, Carabaño and Hernández2007) is the most popular way of defining longevity. Moreover, it is also possible to distinguish between genetic effects resulting in a voluntary or involuntary culling. Voluntary culling occurs when cows are not profitable and can be replaced by more profitable cows, whereas involuntary culling occurs when cows have health or reproductive problems and must be disposed of, regardless of their production. For this reason, Ducrocq (Reference Ducrocq1987) proposed defining two different traits: true and functional stayability. True stayability is the ability to delay any culling, whereas functional stayability is defined as the ability to delay involuntary culling only. As there is no direct measure of functional stayability, an approximation can be obtained by correcting length of production life for the main criteria on which breeders take the decision to voluntarily cull the cow.
Inclusion of time-dependent covariates and stratification are approaches to accommodate situations for which the proportional hazard assumption is not valid for all effects or throughout the whole time interval studied. Piecewise Weibull baselines accommodate the cyclic pattern of the hazard function over lactations in the cow's life (Ducrocq, Reference Ducrocq2005; Terawaki et al., Reference Terawaki, Katsumi and Ducrocq2006). Therefore, application of a piecewise Weibull baseline proportional hazard model is a natural step forward to evaluate longevity breeding values for populations such as Slovenian Brown cattle. In addition, for accurate evaluation of breeding values, all known factors (e.g. effect of age at first calving, of change in herd size) need to be accounted for if they have a significant effect on the hazard function.
Longevity genetic evaluation for the Brown dairy cattle population in Slovenia was first implemented by Potočnik et al. (Reference Potočnik, Gantner, Krsnik, Štepec, Logar and Gorjanc2011). Breeding values were estimated using a unique baseline hazard for the whole period considered. A sire–maternal grand sire model was applied because of its computing feasibility. Slovenia is currently not included in the MACE for longevity carried out by Interbull (2011).
The objectives of this study were to develop a piecewise proportional hazard model to estimate the breeding values for longevity of Slovenian Brown cattle breed and to compare breeding values obtained from models with or without correction for milk production. As the commonly used approach for the definition of within herd milk production classes is not applicable in small herds, an alternative, on the basis of milk production classes within group of herds with similar number of cows, was tested. Model validations in populations characterised by small herd size are scarce in the literature and are of interest for practical application.
Material and methods
Data
All the data necessary for the creation of productive life records were obtained from the central cattle database GOVEDO, maintained by the Agricultural Institute of Slovenia. Records from milk recorded Brown cows with at least one of their first five calvings occurring between 1 January 1998 and 31 December 2008 were considered in the creation of the data set. The cows were included in the data set as soon as at least one milk recording existed. Where only second and/or later lactations were observed in the period analysed, truncation was performed on the day of first calving after 1 January 1998, that is, the period before the truncation point was ignored in the analysis. Cows younger than 20 (142 cows) or older than 48 months (352 cows) at first calving, and cows with missing date of first calving (2696 cows), were excluded. In total, lifetime records of 42 120 cows from 2401 herds were included in the data set. Out of them, 10% (4212) of the second-crop daughters of bulls with >50 progeny were randomly selected from bigger herds (>10 cows) to create a validation data set. The rest (90%, i.e., 37 908) formed a training set to estimate sire breeding values. Actual survival curves of the cows in the validation set were compared with these estimated breeding values.
With the model constraint that the genetic effect is time independent – that is, the sire effect does not change during the lifetime – and our focus on the ability to avoid early culling, only the first five lactations were taken into account: records of cows with more than five lactations were censored on the day of their sixth calving, whereas those that were still alive at the end of the study and had less than six calvings were censored on 31 December 2008. For lactations longer than 800 days, the cow lifetime was considered as censored on the 800th day after calving of that lactation: these long lactations might have been related to abortions or poor recording of culling date. In case a cow was sold to another herd, her record was considered as censored on the day of last milk recording in the initial herd because she may have been treated differently in her new herd. Whenever a reliably recorded culling date existed, it was used as a terminal date. For the cases when it was missing and the cow was recorded as dead, the last known day of milk recording or dry day was considered as her culling date. Because the number of animals with a calving in 1998 was small, only one calving year class was created for those with calvings in 1998 and 1999.
Altogether, 20.4% of the cows had their first calving before 1 January 1998 and their records were truncated in our analysis. This means that only calvings occurring after 1 January were included and the date of first calving was kept only as starting point of length of productive life. Out of the 20 963 cows with censored records, 38.2% were censored because they reached their 6th calving, 48.2% because they were still alive at the end of the study period and the rest (13.6%) for other reasons such as lactations longer than 800 days, herd change or the herd was no longer in milk recording system. Out of the 21 157 disposed cows, 72% had their culling date recorded. Small herd size is an important feature of the data set, although a slight increase in herd size was apparent over the years, going from 6.7 in 1999 to 8.7 Brown cows per herd in 2008.
Cows with records were progeny of 590 sires and 612 maternal grand sires. Some bulls were present as both sire and maternal grand sire of recorded cows. The pedigree was traced back for bulls only. At most, five generations of male ancestors were built and those that did not contribute to the relationships between cows with records were discarded. Finally, the complete pedigree file consisted of 886 bulls. For the validation data set, progeny of 63 bulls were included.
Models
As in some previous studies (Ducrocq, Reference Ducrocq2005; Terawaki et al., Reference Terawaki, Katsumi and Ducrocq2006), the hazard function (λ(t)) at time t was modelled with a piecewise Weibull baseline hazard function of general form λ 0,cp(t) = λρ(λτ)ρ − 1 with scale parameter λ and shape parameter ρ. Different baselines (i.e. different scale and shape parameters) were defined for each combination of lactation c (1 to 5), stage of lactation p (1 to 5), leading to 25 different baseline hazard functions. Changes of hazard function were assumed to occur at τ = 0, 60, 270, 380 and dry day of each consecutive lactation, where τ denotes the days since the last calving. The τ time scale is needed here because the values of t at the second and later calvings differ between cows. Times of change in the lactation stage were chosen according to the variation of the raw estimate of the hazard derived from the Kaplan–Meier estimate of the survivor function (Kaplan and Meier, Reference Kaplan and Meier1958) within lactations as in a study by Ducrocq (Reference Ducrocq2005) and Terawaki et al. (Reference Terawaki, Katsumi and Ducrocq2006).
Genetic and nongenetic effects on length of productive life were estimated with two proportional hazard models. Model 1 estimated breeding values for true longevity, whereas in model 2 the effect of milk yield was included to correct for low milk production (i.e. the main source for voluntary culling), hence revealing functional longevity. Differences in culling policies for increasing and decreasing herds were explained with a fixed effect of change in herd size (di(t′)) with i (1 to 6) classes and changes occurring at t′ = 1 January of each year. Classes of change in herd size were defined according to the change in maximum number of recorded cows during the first three milk recordings of each year. Class i = 1 defined a decrease in herd size by >30%, i = 2 a decrease from 10% to 30%, i = 3 stable herd size (change from −10% to 10%), i = 4 an increase from 10% to 30%, i = 5 an increase by >30% and i = 6 ‘unclassified’ herds with fewer than five cows in a year. The fixed effect of region within year of production (ryjk(t′)) with j (1, 2, 3) for three different regions defined for Brown cattle breed by productive year k (1999 to 2008) and changes occurring at t′ = 1 January of each year, accounted for systematic differences in culling policies due to various environmental conditions for dairy cow breeding. Region 1 (Supplementary Figure S1) represented the subpannonial Slovenia with some Prealpine Hills; region 2 represented the Prealpine Hills with Dinaric Karst of inner Slovenia; and region 3 represented the sub-Mediterranean Slovenia with also a small portion of other previously mentioned landscape types. The environment conditions for production of high quality fodder are the least favourable in region 3. As a consequence, production of replacement heifers is more costly and animals with good morphological aptitudes (better legs, udder) are looked for. The fixed effect of year of production by season interaction (yskl(t′′)) with k (1999 to 2008) years and l (1, 2, 3, 4) seasons accounted for the differences in culling policies within different year-seasons. Changes for the four seasons occurred at t′′ = 1 January, 1 April, 1 July and 1 October of each year.
The fixed effect of milk yield (mn(ç)) within lactation number (1, 2+) and stage of lactation (1 to 5), on which farmers base their voluntary culling decision for low productivity, was similar to the definition of Beaudeau et al. (Reference Beaudeau, Ducrocq, Fourichon and Seegers1995). Peak lactation yield was estimated from the first two milk recordings within 120 days after calving. Normal distribution was assumed for peak yield. Mean, standard deviation and deciles of milk yield were calculated within a year of calving, different herd size groups, and for the first and later lactations separately. As the number of records within herds was small, the deviation from the mean milk yield was done within different herd size groups rather than at the herd level, which is the general practice in other studies. The problem of small herds is the low number of cows available to form a comparison. For that reason, the within-herd rank for production, which is usually used in large herds to assess whether a cow is at higher risk of being culled, is no longer valid. Consider, for example, a herd with five cows with respective peak yields of 30, 29, 28, 20 and 20 kg. The within-herd rank will consider the third and fourth cows as ‘relatively close’, whereas the use of deviation within different herd size groups will better identify the third cow as a good cow (unlikely to be culled for low production) and the last two as bad. Therefore, a population partition according to the herd group size on production seems more appropriate to model the effect of milk yield on risk of culling in small herds than the standard within-herd classification. Herd size groups were formed differently for cows in first and later lactations. The four classes for primiparous cows were: 1 to 3, 4 to 6, 7 to 9 and >9 cows in first lactation in the herd, whereas the four classes for multiparous cows were: 1 to 5, 6 to 10, 11 to 15 and >15 cows in later lactations in the herd. According to peak yield, cows were grouped in different deciles (n = 1 – best milk producers to 10 – worst milk producers) with changes occurring on the milk test recording day (ç) of the maximum milk yield, after each calving. All primiparous cows were considered as unclassified (n = 0) until the date of first lactation peak yield. Altogether, 11 classes were created. The random effect part included a log-gamma (with shape and scale parameters both equal to γ in order to force its mean to be 1) distributed herd-year effect (hyo(t′)) with o classes (o = 1 to 18 684) and changes occurring at t′ = 1 January of each year, and a multinormally distributed additive genetic effect su + 0.5 mgsv with sire u (u = 1 to 590) and maternal grand sire v (v = 1 to 612). Note that the maternal grand sire effect equals half the sire effect.
In summary, the two models used can be written as
 $$no{\lambda {\rm{(}}t{\rm{)}}\,{\rm{ = }}\,{{\lambda }_{{\rm{0,}}cp}}\,{\rm{(}}T{\rm{)}}\,{\rm{exp}}\, \left\{ {{{d}_i}(t^{\prime}) \,+\, r{{y}_{jk}}(t^{\prime}) \,+\, y{{s}_{kl}}(t^{\prime\prime}) }\right \, \cr \quad+\, \left h{{y}_o}(t^{\prime}) \,+\, {{s}_u} \,+\, {\rm{0}}{\rm{.5}}\,mg{{s}_v}} \right\Big\}$$
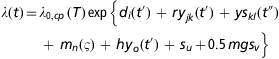 $$no{\lambda {\rm{(}}t{\rm{)}}\, {\rm{ = }}\,{{\lambda }_{{\rm{0,}}cp}}\,{\rm{(}}T{\rm{)}}\,{\rm{exp}}\,\left\{ {{{d}_i}(t')\, + \,r{{y}_{jk}}(t^{\prime})\, + \,y{{s}_{kl}}(t^{\prime\prime}) }\right \, \cr \quad+ \,{{m}_n}(\varsigma )\, + \,h{{y}_o}(t')\, + \,{{s}_u}\,{\rm{ + }}\,{\rm{0}}{\rm{.5}}\,mg{{s}_v}\right\Big\}$$
Heritability (h 2) was calculated from the sire variance (σ s2), and the variance of the log-gamma herd-year effect, which is equal to the trigamma function ψ (1)(γ) of the γ parameter. The trigamma function is the second derivative of the log-gamma function (Abramowitz and Stegun, Reference Abramowitz and Stegun1964):
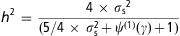 $${{h}^{\rm{2}}} \, = \,\frac{{{\rm{4}}\,\times \,{{\sigma }_{\rm{s}}}^{{\rm{2}}} }}{{{\rm{(5/4}}\,\times \,\sigma _{{\rm{s}}}^{{\rm{2}}} \,{\rm{ + }}\,\psi {\pre}^{{{\rm{(1)}}}}{\rm{(}}\gamma {\rm{)}}\,{\rm{ + }}\,{\rm{1)}}}}$$
This formula was derived from the sire–maternal grand sire equivalent heritability equation by Mèszáros et al. (Reference Mèszáros, Pálos, Ducrocq and Sölkner2010) and is known as the effective heritability, as the amount of censoring in the data is not taken into account (see Yazdi et al., Reference Yazdi, Visscher, Ducrocq and Thompson2002, for details).
The estimated breeding values (ât) were averaged by year of birth to estimate genetic trend. They were standardised (EBV), dividing them by the estimated sire genetic standard deviation (σ s). Higher genetic values of ât are associated with a higher risk of culling. In addition, they were multiplied by −1 to be easier to interpret: a positive EBV is related to a better longevity:
 $${\rm{EBV}}\,{\rm{ = }}\,{\rm{ - }}a{\rm{/}}{{\sigma }_{\rm{s}}}$$
For the estimation of reliability (R), the following equation for a sire model on the basis of the number of uncensored daughters of a sire (n) and the effective heritability (h 2) was applied (Yazdi et al., Reference Yazdi, Thompson, Ducrocq and Visscher1999):
 $$ R\,{\rm{ = }}\,n{\rm{/(}}n\,{\rm{ + }}\,{\rm{(4}}\,{\rm{ - }}\,{{h}^2} {\rm{)/}}{{h}^2} {\rm{)}} $$
The analyses were performed with the survival kit package, version 6 (Mèszáros et al., Reference Mèszáros, Sölkner and Ducrocq2013). The survival kit enables inclusion of time-dependent and random effects with strata in Weibull proportional hazard models. The gamma parameter of the herd-year effect distribution was estimated jointly with the other effects, after exact algebraic integration of the log-gamma herd-year random effect (Ducrocq and Casella, Reference Ducrocq and Casella1996). The sire variance was estimated as the mode of its approximate marginal posterior density obtained after Laplacian integration of the other parameters (Ducrocq and Casella, Reference Ducrocq and Casella1996).
Results
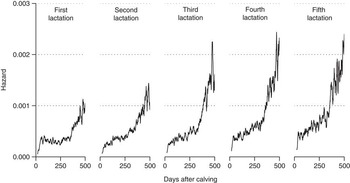
Median length of productive life for cows in the training data set was 1192 days (Supplementary Table S1). Half of the uncensored cows were in production for <1035 days, whereas half of the censored cows were in the herd for <1501 days. Median length of productive life for cows in the validation data set was 1131 days (1020 and 1346 days for uncensored and censored records, respectively). The empirical hazard function derived from the Kaplan–Meier estimate (Figure 1) shows that after a slight rise in the first 60 days, the hazard function was relatively stable until about 270 days for the first lactation, whereas it clearly increased during this period in the next four lactations. Later, a more rapid increase of hazard rate for all lactations was observed up to 380 days of lactation. Because the number of animals with lactations longer than 380 days was small, estimates oscillated with larger amplitude, whereas the increasing trend of hazard rate was still evident. In general, the hazard was lower in the first two lactations. However, it was similar in the first few days for all lactations considered.
Empirical hazard function derived from the Kaplan–Meier estimator of survival function for the first five lactations.

Graphical test of proportional hazard assumptions for the first three lactations (Supplementary Figure S2) showed that the lines in graph of (ln(−ln S 0,s(t)) against ln(t) were nearly parallel throughout the lactation period and a unique Weibull baseline could be used. When comparing the curve slopes between lactation stages, a relatively different slope was recognised, especially in the first three lactation stages and also some crossings between curves were evident. Thus, it was decided not to use a common baseline across lactations and lactation stages.
Fixed effects of the model
The initial effects included in the proportional hazard model were the effects of class of change in herd size, region by year of production, year of production by season, class of peak yield, age at first calving and the interaction between year of production and peak yield class. This last interaction corrects for the phenotypic trends in milk production over the years. When the effects were tested using sequential likelihood ratio tests, the latter two effects were found to be non-significant (Supplementary Table S2). All the other effects (change in herd size, region by year of production, year of production by season, milk yield class) were highly significant and were kept in the final proportional hazard model 2, whereas in model 1 peak yield class effect was excluded to estimate true longevity breeding values.
The Weibull shape parameter ρ describes the decreasing (ρ < 1) or increasing (ρ > 1) shape of the baseline hazard function. Estimates of Weibull shape parameters during the first stage of all five lactations, was between 1.68 and 1.93 and in the second stage it was between 1.26 and 1.67. In the third and fourth lactation stage it was similar, ranging from 2.72 to 3.51. Cows were at a much higher risk of being culled at the end of lactation than at the beginning. Only lactations resulting in a later calving are allowed to enter the fifth (the last) stage of lactation (from day when dried to the day of next calving). As a consequence, no culling could occur and the risk of being culled was equal to 0 during this period.
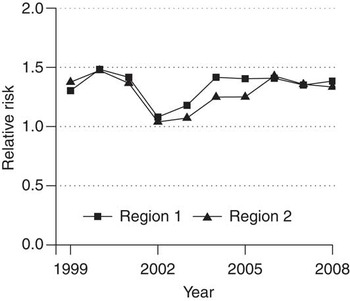
Changes in herd size between consecutive years modified the relative risk of cow culling. Cows in herds decreasing in size by >30% or between 10% and 30% had a 1.4 and 1.1 higher relative risk of being culled, compared with cows in stable herds. Cows in herds where an increase in size occurred had a relative risk of being culled between 0.8 and 0.9 compared with stable herd size. Relative risk of cows being culled in small herds (unspecified class) was similar to herds increasing in size. For the estimation of the region by year of production effect, three regions of origin were defined. The differences in relative risk of culling presented in Figure 2 show that, except for year 2002, differences were important between regions, and that this effect needed to be accounted for in the model.
Relative risk of culling for regions 1 and 2 by year (1999 to 2008) compared with region 3 as a reference (relative risk = 1).

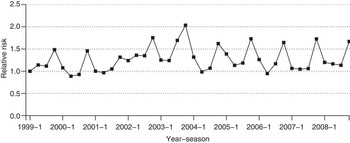
Within different years of production, the highest risk of culling occurred in the fourth season (Figure 3). Compared with the first season of 1999, the relative risk of culling ranged from 1.32 to 2.04 for this last season. This cyclic pattern was changed between the last seasons of 2001 and 2003.
Relative risk of culling for different year-seasons compared with season 1 in year 1999 as a reference (relative risk = 1).

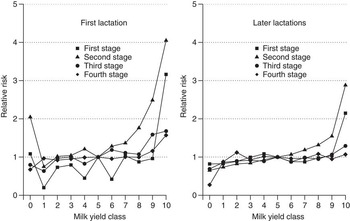
The effect of peak yield on the relative risk of culling is presented in Figure 4. Average milk production represented with class 5 was used as a reference for all stages within lactations. Results for stage 5 (dry period) in which cows cannot be culled (no risk) are not presented. If the cow production in the first stage of lactation was estimated to be among the best 10% (class 1), then her relative risk of being culled was 0.2 for the first lactation and 0.8 for later lactations. This means that chances of being culled for a cow in class 1 were 0.2 (0.8) times the chances of being culled of a cow with an average milk production (class 5). On the other hand, if the cow production in the first stage of lactation was estimated to be among the worst 10% (class 10), then the relative risk (i.e. compared with an average cow) of a cow being culled was 3.2 in the first and 2.1 in later lactations. Relative risk of a cow being culled in the second stage was 0.7 for class 1, regardless of the lactation number, and 4.0 for primiparous and 2.1 for multiparous cows in class 10. For the third and fourth lactation stages, differences in culling risk between peak yield classes were smaller. Relative culling risk for primiparous Brown dairy cows in the third stage was 0.6 for class 1 and 1.7 for class 10, whereas for multiparous it was 0.9 for class 1 and 1.3 for class 10. For the fourth lactation stage, it was 1.0 for class 1 and 1.6 for class 10 for primiparous and 0.9 for class 1 and 1.1 for class 10 for multiparous cows.
Estimates of relative risk of culling for 11 milk yield classes (0 – unclassified, 1 – best, 10 – worst) in the first (left) and later (right) lactations on the first four lactation stages with the average milk production class (class 5) as reference.

Estimation of genetic parameters and variance of random effects
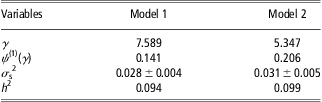
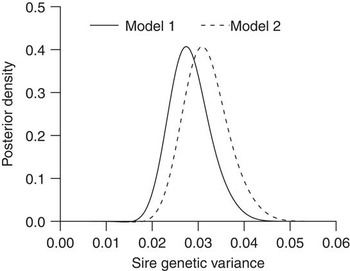
Estimates of genetic parameters are presented in Table 1. The variance of the log-gamma herd-year random effect as well as the sire genetic variance and the heritability were higher in model 2, that is, the model for functional longevity: in particular, the variance of herd-year random effect was 42% higher. This shows that the correction for milk production reduces the within-herd year variance. The difference between sire genetic variances was much smaller (11%) reflecting the fact that part of the differences in milk production had a genetic origin. More evidence of smaller differences in sire genetic variance is shown in Figure 5 where the approximate posterior densities of the sire genetic variance are presented for both models. The shape of the posterior density is similar between the models, and as the difference in mean value of sire genetic variance is small the overlap is relatively large.
Estimates of genetic and nongenetic random effect parameters for the estimation of true (model 1) and functional (model 2) longevity
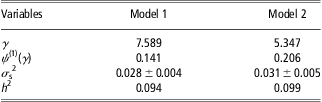
γ = shape and scale parameters (assumed to be equal) and ψ (1) (γ) =variance of the log-gamma herd-year random effect; σ s2 = sire genetic variance; h 2 = heritability.
Approximate posterior densities of the sire genetic variance for the estimation of true (model 1) and functional (model 2) longevity.

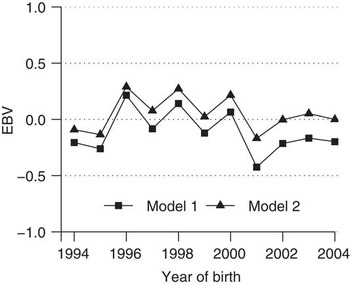
Rank correlations between sire breeding values obtained from models were high for all restrictions in reliability. They were 0.94, 0.96, 0.97, 0.96 and 0.93 for no restriction to reliability or a restriction to reliability of ⩾20%, ⩾40%, ⩾60% or ⩾80%, respectively. The genetic trends on a standardised scale (expressed as genetic standard deviations) are presented in Figure 6. They were almost flat for model 1 (0.003) and slightly negative for model 2 (−0.011). However, they were not found significantly different from 0. In general, differences in mean breeding values between models were increasing over the years.
Estimates of genetic trends using true (model 1) and functional (model 2) longevity for sires born between years 1994 and 2004.

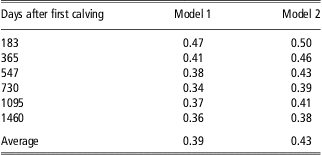
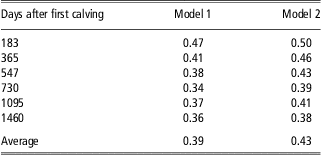
The predictive ability of the two models was assessed on the validation data set after 183, 365, 547, 730, 1095 and 1460 days after first calving (Table 2). On average, the correlation between the predicted breeding values obtained from the training data set and the survival of the cows from the validation data set was 0.39 for model 1 and 0.43 for model 2. The highest correlations 0.47 for model 1 and 0.50 for model 2 were obtained for the early survival (183 days after the first calving). Later on, they dropped and ranged between 0.34 and 0.41 for model 1 and between 0.38 and 0.46 for model 2. The raw survivor curve for second-crop daughters from the validation data set (Supplementary Figure S3) showed the range between the extreme groups is 0.15 in terms of survival, five years after first calving. Clearly, the differences were the smallest between the top two quartiles for both true and functional longevity.
Correlation coefficient between the sire estimated breeding values and the survival rate of new second crop daughters after different number of days since the first calving for true (model 1) and functional (model 2) longevity
Discussion
A piecewise Weibull hazard model was applied with time-dependent covariates (class of change in herd size, region by year of production, year of production by season and milk yield class) to cope with changes in hazard rate within and between lactations, and to correct breeding values for systematic environmental factors. It was shown as, in the study by Roxström et al. (Reference Roxström, Ducrocq and Strandberg2003), that different slopes exist within lactation segments and that the stratification on stages of lactation should be included. Cut-off points for setting up the baseline within lactation were chosen on the basis of the nonparametric estimates of the within lactation hazards, as in other studies (Ducrocq, Reference Ducrocq2005; Terawaki et al., Reference Terawaki, Katsumi and Ducrocq2006). The first two cut-off points (0 and 60 days after calving) were defined on the same day as the earliest in the model with the best fit described by Terawaki et al. (Reference Terawaki, Katsumi and Ducrocq2006), whereas the last three (270 and 380 days after calving and drying-off day) matched with those specified by Ducrocq (Reference Ducrocq2005). Finally, different baselines were defined for each combination of parity and lactation stage.
Comparing culling risks between lactations, the lowest hazard was found in the first lactation, as in French Holstein (Ducrocq, Reference Ducrocq2005) and Japanese Holstein cattle (Terawaki et al., Reference Terawaki, Katsumi and Ducrocq2006; Terawaki and Ducrocq, Reference Terawaki and Ducrocq2009) using a similar approach. The differences between shape parameters were small for the third and fourth stages, and the two stages could have been merged; however, as the number of records was large enough, five different lactation stages were retained. The lowest Weibull parameters ρ were found in the first and the second stage of lactation, which is consistent with some other studies (Ducrocq, Reference Ducrocq2005; Terawaki et al., Reference Terawaki, Katsumi and Ducrocq2006).
Similar to some studies on dual purpose cattle breed (e.g. Ducrocq, Reference Ducrocq1994), our analysis also revealed that age at first calving did not have a significant effect on culling. Many other studies, mainly in the Holstein breed (e.g. Dürr et al., Reference Dürr, Monardes and Cue1999) and some other breeds, for example, Pintzgau (Mèszáros et al., Reference Mèszáros, Fuerst, Fuerst-Waltl, Kadlečík, Kasarda and Sölkner2008), Braunvieh and Simmental (Vukasinovic et al., Reference Vukasinovic, Moll and Casanova2001), found that the age at first calving had an impact on productive life. One explanation for these differences might be given by Bielfeldt et al. (Reference Bielfeldt, Tölle, Badertscher and Krieter2006), who found out that the target age at first calving significantly differed between herd management systems. Wathes et al. (Reference Wathes, Brickell, Bourne, Swali and Cheng2008) concluded from a review that the main factor when heifers conceive is the pre-pubertal growth rate, which is under both environmental and genetic effect.
Hazards of extreme changes in herd size are not in complete agreement with previous studies. Some authors (Ducrocq, Reference Ducrocq1994 and Reference Ducrocq2005; Mészáros et al., Reference Mèszáros, Fuerst, Fuerst-Waltl, Kadlečík, Kasarda and Sölkner2008) reported an increase in culling rate for decreasing herd size between 1.4 and 2, and on the other hand a decrease between 0.5 and 0.8 for expanding herds. These findings are in accordance with our results. In contrast, some others (Dürr et al., Reference Dürr, Monardes and Cue1999; Sewalem et al., Reference Sewalem, Kistemaker, Ducrocq and Van Doormaal2005) obtained higher culling risk for decreasing as well as increasing herd sizes, with a relatively low effect on changes in culling risk. The considerably lower risk of cows being culled in the ‘unspecified class’ for changes in herd size might be a result of a ‘preferential treatment’ of less-productive cows in small herds.
Seasonal changes of relative hazard revealed that the highest risk of culling was observed in the last quarter of each year and not at the end of a milk quota year (30 April). The reason for a change in hazard within a year could be justified with the feed shortage during the winter time. Change in culling policy between the last seasons of 2001 and 2003 can be explained with the planned introduction of the milk quota system (Vlada Republike Slovenije, 2004) and the lack of fodder because of drought in 2003, when there was only between 40% and 70% of the expected average yearly rainfall (Ceglar and Kajfež-Bogataj, Reference Ceglar and Kajfež-Bogataj2008). The region by year of production effect revealed that the cows from region 3, where conditions for cattle breeding are tough, had a lower culling risk. However, the differences were small in years 2002 and 2003, showing that the expectations of the milk quota system implementation and the lack of fodder had different effects between regions. Breeders tried to increase their milk quotas by reducing culling, which as seen from the graph, was not an alternative in region 3 characterised by an already low culling rate, small herds and lower average milk production in standard lactation (Sadar et al., Reference Sadar, Opara, Perpar, Jeretina, Logar, Podgoršek, Žabjek, Glad and Ivanovič2010). If only increases in herd size occurred, this would already be accounted with the effect of change in herd size; however, a change in culling reasons also happened.
To limit possible confusion with estimation of milk yield from records in progress, the correction for voluntary culling on production was included, considering the peak yield from the first two milk recordings as an indicator of milk yield potential (Beaudeau et al., Reference Beaudeau, Ducrocq, Fourichon and Seegers1995; Roxström and Strandberg, Reference Roxström and Strandberg2002). The other common approach would be the extrapolation from incomplete lactation records to a standard lactation milk yield (Dürr et al., Reference Dürr, Monardes and Cue1999; Ducrocq, Reference Ducrocq2005). When the dry date occurs before the 305th day of lactation or only a few milk yield records are known within lactation, inclusion of peak milk yield is believed to account better for voluntary culling. Because of small herd sizes, production levels were not compared within the herd, as is usual practice in most longevity studies. The number of milk yield classes was in the range of those defined by Beaudeau et al. (Reference Beaudeau, Ducrocq, Fourichon and Seegers1995), Ducrocq (Reference Ducrocq2005) and Chirinos et al. (Reference Chirinos, Carabaño and Hernández2007) with 19, 10 and 8 categories, respectively. Smaller differences in risk of being culled in later stages of first and later lactations could be the result of disposal of very low-producing cows early in the first and second lactation stages and disposal of high-producing cows because of fertility problems and sterility in the last stages. As in all other studies, including a milk yield effect, the relative risk of being culled was higher for low- than for high-producing cows (e.g. Chirinos et al., Reference Chirinos, Carabaño and Hernández2007). Cows with an extremely low milk yield were mainly culled in the first lactation, which is in agreement with the studies by Vukasinovic et al. (Reference Vukasinovic, Moll and Casanova2001), Roxström and Strandberg (Reference Roxström and Strandberg2002) and Ducrocq (Reference Ducrocq2005). These similarities with other studies show that creating milk yield classes as a function of herd size group and at a population level is not detrimental and can be applied in practice for the estimation of functional longevity in small herds.
Heritability values for length of productive life were slightly lower with model 1. This is in disagreement with the studies by Vollema and Groen (Reference Vollema and Groen1996) and van der Linde et al. (Reference van der Linde, Harbers and de Jong2007), where a slight increase in heritability was noticed when the correction for milk yield was excluded. Rank correlation (0.94) between breeding values for the herd life obtained with the two models are considerably higher than the one reported by van der Linde et al. (Reference van der Linde, Harbers and de Jong2007) for the Dutch Holstein population (0.80), and even higher than the one reported by Vollema and Groen (Reference Vollema and Groen1996) where it was about 0.90. Rank correlation for all bulls in the evaluation was lower because some sire breeding values had low reliability, whereas with the restriction to reliability >80%, the correlation was lower because too few bulls were considered. The variability of the nongenetic random herd-year effect was considerably different between the two models. With model 2, the variability of nongenetic random effect was higher (+42%) than with model 1. These results were unexpected and in disagreement with the study by Buenger et al. (Reference Buenger, Ducrocq and Swalve2001), where a decrease of 53% was observed, and the study by van der Linde et al. (Reference van der Linde, Harbers and de Jong2007), where a slight reduction in herd-year variance was found (from 0.229 to 0.224). Correction for milk production reduced the variability between herd-year quite importantly, whereas the change in total variability was not as large.
The genetic trend for model 2 was slightly unfavourable. This is not surprising, given the negative genetic correlation between functional longevity and milk production traits for which selection has been intensively practised in the past years. However, when breeding values were not corrected for milk yield, the genetic trend was almost flat. The correlation between the estimated breeding values and the realised survival of the second-crop daughters were lower than the one obtained from the study by Holtsmark et al. (Reference Holtsmark, Heringstad and Ødegård2009). What most farmers are interested in is functional longevity, as a measure of the ability of the cow to delay involuntary culling: this information is approximated by making longevity independent from milk yield, which is the main underlying reason for voluntary culling. Hence, model 2 should be favoured when estimation of (functional) longevity breeding value is desired. Most countries, but not all, are taking advantage of survival analysis to analyse functional longevity.
Acknowledgements
The work was conducted during the stay of the first author at l'Unitè Mixte de Recherche of Gènètique Animale et Biologie Intègrative of the Institut National de la Recherche Agronomique in Jouy-en-Josas, France. The authors thank B. Ivanovič, J. Jeretina, T. Perpar and G. Gorjanc for their assistance and helpful collaboration. Comments of two anonymous reviewers substantially improved the manuscript.