1. INTRODUCTION
The use of electronic charts can release navigators from chart work, so they can focus on navigation monitoring and ship manoeuvring. With the increase in channel congestion and the emergence of high-speed ships, safety of navigation is attracting attention. Therefore, Electronic Chart Display and Information Systems (ECDIS) are playing an increasingly important role in shipping.
The Electronic Navigational Chart (ENC) is the core of an ECDIS. Essentially, the ENC is an abstraction and generalisation of the real world, which focuses on sea data, with less emphasis on land information such as terrain, wharves, port structures, buildings and other objects. However, this type of data organisation model limits users' ability to obtain more real and rich spatial information of the navigation environment. Users have to generate a mental model of a map, rotate it and match it with the real world and relate the symbols and map features to real features. This explains why so many people have difficulties with the interpretation and understanding of two-dimensional (2D) maps, which often results in errors and sometimes even leads to fatal mistakes. This is true even for experienced navigators, especially when they are tired or stressed. High levels of stress and mental overload are often encountered in marine navigation (Goralski et al., Reference Goralski, Ray and Gold2011).
Many researchers in this area have researched three-dimensional (3D) charts to provide chart display systems which are more visually efficient, quicker and easier to understand based on cartographic 3D visualisation, aimed to reduce the amount of marine accidents caused by fatigue, mental overload and limited awareness of the navigational situation. Kreuseler (Reference Kreuseler2000) studied the 3D display of the 2D map and 3D riverbed. Ford (Reference Ford2002) was the first to propose 3D navigational charts with the conclusion that the 3D chart had the potential to be an informative decision support tool that could reduce vessel navigation risks. Arsenault et al. (Reference Arsenault, Plumlee, Smith, Ware, Brennan and Mayer2003) presented a prototype 3D visualisation system that overlaid a scanned paper navigational chart over a 3D bathymetry. Gold et al. (Reference Gold, Chau, Dzieszko and Goralski2005) proposed a prototype of an interactive 3D “pilot-book” with 3D model (map) derived from ENC. Musliman et al. (Reference Musliman, Rahman and Coors2006) stated that 3D views stimulated more neurons and hence would be processed more quickly. Porathe (Reference Porathe2006) proved that compared with traditional 2D charts, 3D charts could dramatically reduce the number of human errors and improve the accuracy and efficiency of manoeuvrings. Also, he proposed a prototype charting system which worked on a manually prepared 3D model of the selected area. Goralski and Gold (Reference Goralski and Gold2008) proposed a type of “3D ECDIS” based on a 3D visualisation engine. Ternes et al. (Reference Ternes, Knight, Moore and Regenbrecht2008) proposed a type of 3D visualisation system that worked with manually prepared 3D models, for the support of navigation during hydrographic surveys. Ray et al. (Reference Ray, Goralski, Claramunt and Gold2011) presented a 3D virtual environment based on an interactive 3D chart.
However, most of the prototype systems listed above only focused on their local areas, or they lost artificial 2D navigation chart features in the water such as depth areas, anchor zones and prohibited areas, or their data service mode was still local. Unlike 2D cartography, 3D cartography is relatively new and lacks sufficient available research.
Since 1998, when “Digital Earth” was issued (Gore, Reference Gore1998), the relative theories and technologies have been quickly developed. As a result, advanced spatial information technology and network sharing technology have been widely used in marine scientific investigations and research (Wang et al., Reference Wang, Su, Li, Li, Li, Lei and Li2012). This has resulted in the rise of a digital earth data-sharing platform for marine usage. A number of marine geoscience databases and data centres have been established, such as the U.S. Marine Geology and Geophysics Data, the Library of the Scott Polar Research Institute (SPRILIB) ice and snow database, and so on. Digital earth can provide rich spatial information from global scale to local detail. This will be very helpful for marine navigation, especially for warship navigation. The space information technology and high-performance computing technology of digital earth can be used to improve the performance of electronic chart systems and change the application mode of chart data. Further, digital earth can be a new platform for marine navigation.
In this article, we propose a new complete solution for future ECDIS based on digital earth technology. We design a new model for future ECDIS, and based on this new model, we develop a prototype system called “AIC 3D ECDIS”. This model merges 2D vector ENCs with a 3D navigation environment in a unified framework. The system can support global spatial data and 3D visualisation by using digital earth technologies such as the digital earth grid model, level of detail (LOD) technology, pyramid model technology, and so on, and it is also published on the web to provide application and data service through the network. It generates a 3D depiction for a future ECDIS. Here the 3D depiction means a three-stage process: use intuitive 3D models to describe entities, fuse artificial spatial objects into the 3D environment and use 3D graphics to visualise data on the computer screen. And 3D means 3D coordinate space. This new system will be significant for inland navigation, entering and leaving port, coastal navigation, etc.
2. SYSTEM DESIGN
2.1. Model for future ECDIS
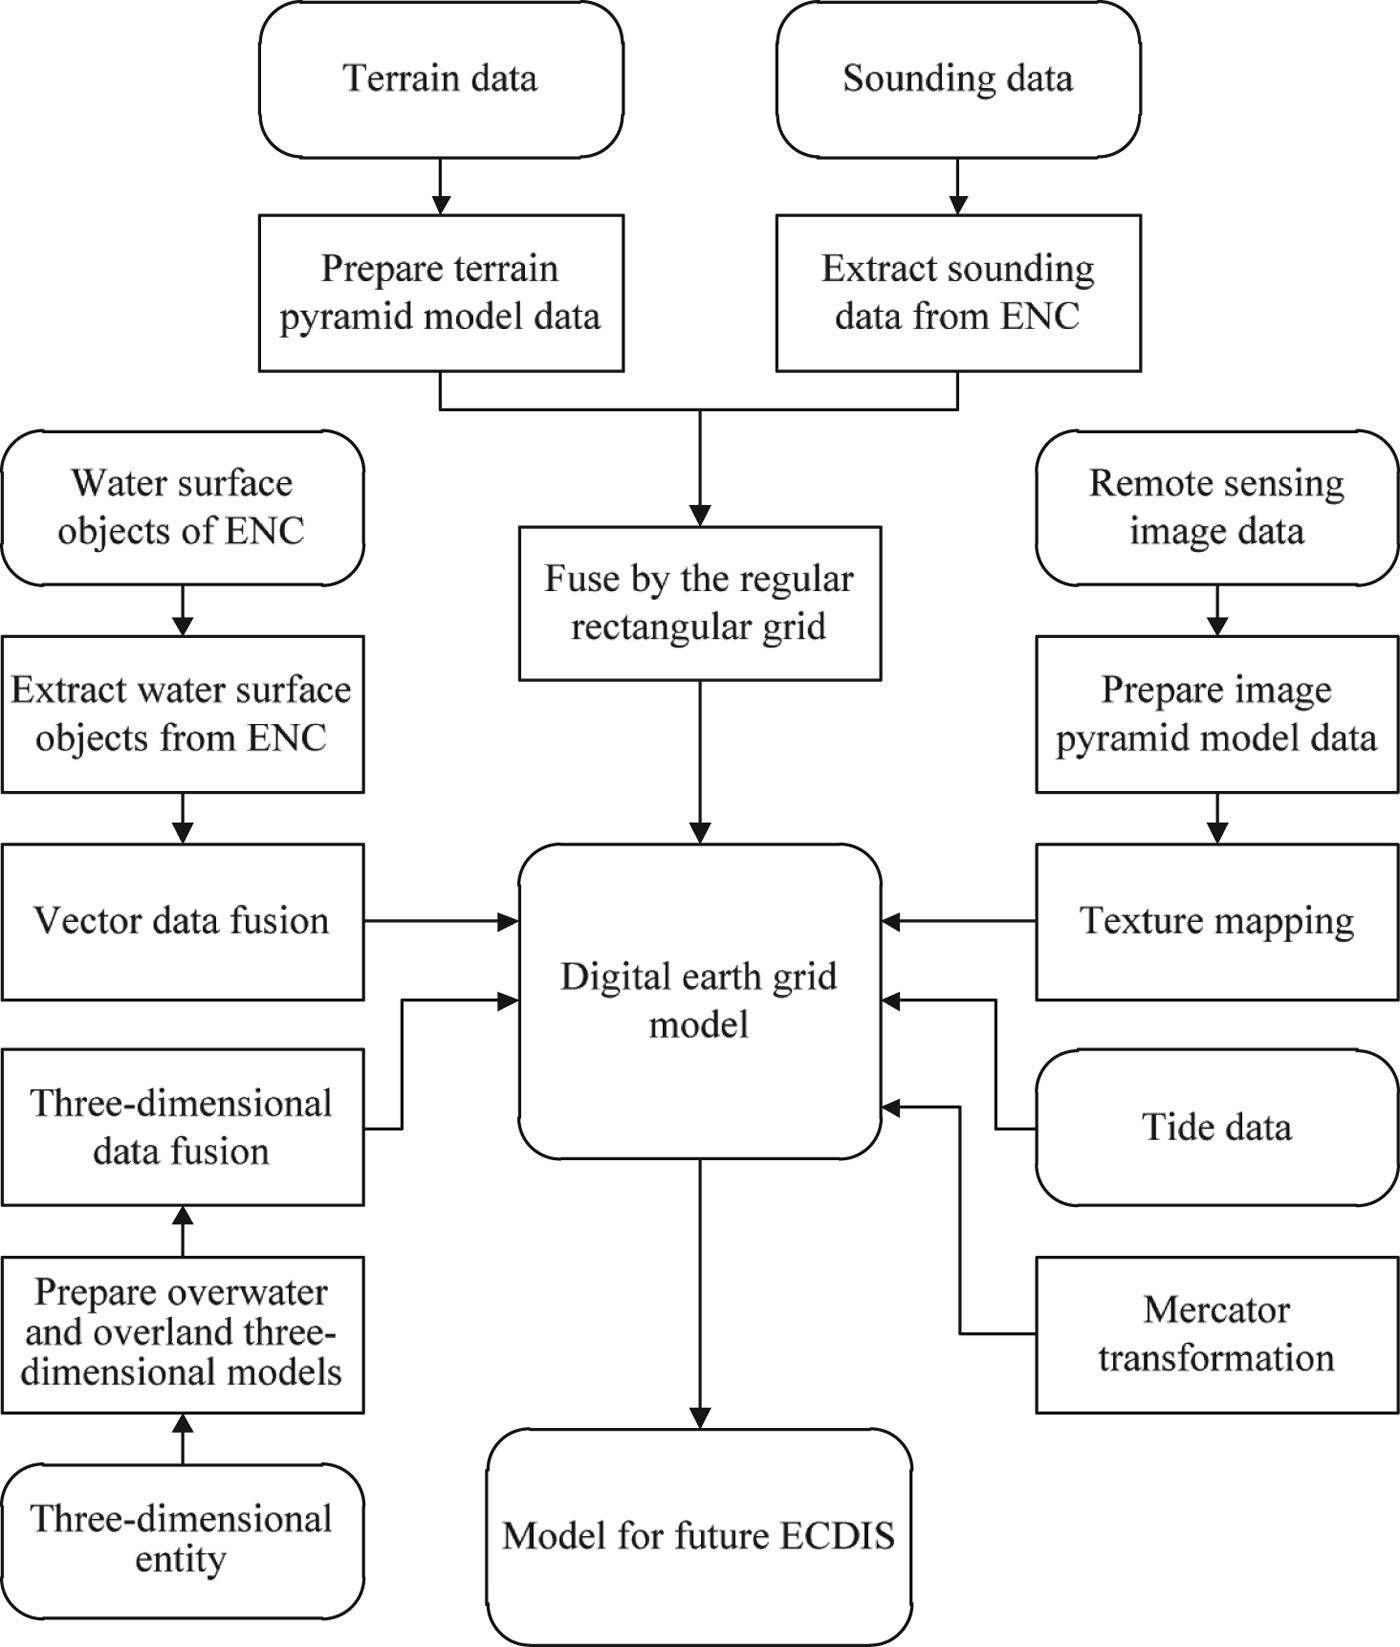
In order to provide more real and rich spatial information for navigation, we design a new model for future ECDIS. Model data are mainly divided into six categories: terrain data, sounding data, artificial ENC water surface objects, tide data, remote sensing image data, 3D entity, which are based on the entity modelling method and digital earth theory. Terrain data and remote sensing image data are used to simulate the real environment, which are organised by multi-resolution pyramid model; 3D models are used to describe entities in the navigation environment such as buoys, buildings, wharves, bridges, etc. Navigators therefore can see a 3D navigation reference; artificial water surface objects of ENC are virtual spatial objects which are created artificially for navigation or other marine activities, such as depth contours, depth areas, prohibited areas, anchor zones, etc., and these objects are the main content of ENC which are of great importance for cross track error (XTE) alarm, collision detection, accident analysis, etc. Sounding data are used to provide riverbed terrain visualisation. All data are fused together in the digital earth grid model.
The following steps describe the data fusion process of the model. The fusion flow is shown in Figure 1 and effects of the model are shown in Figures 9 and 10.
(1) We use the regular latitude-longitude grid model to construct the digital earth model. The model has the characteristics of simple and intuitive calculation, easy texture coordinate calculation and coordinate transformation (between geographical coordinate and 3D Cartesian coordinate). Compared with other grid models, the workload of adding geographical data to the model is the smallest (Sahr et al., Reference Sahr, White and Kimerling2003).
(2) We use a multi-resolution pyramid model to organise the terrain data. The pyramid model should be designed according to the initial terrain data. The exact sampling interval of the initial terrain data we have is 0·46875 arc seconds, or 1 in 150 of 0·01953125°. The pyramid model we design contains 11 levels, the top of which is the zero level tile of 20°×20° extent, the lower level tile has a quarter scope and double resolution of the parent tile, and each level tile is divided into 150×150 partitions. Each level is the resampling result of the original data. So the tenth level tile has the exact size of 0·01953125°×0·01953125°, and the width of each partition is 0·46875 arc seconds (the sampling interval of the initial terrain data). The size of the zero level tile is a suitable value for global use. Then, we extract sounding data from ENCs and fuse the data with the terrain pyramid model, which will be described in Section 3.1. In this way, a new multi-resolution terrain model containing the riverbed is constructed. It provides elevation data for the digital earth model.
(3) The multi-resolution pyramid model is used to organise remote sensing image data. The pyramid model has 12 levels, the top of which is the zero level tile with the size of 36°×36°. The lower level tile has the quarter scope and double resolution of the parent tile, and each level tile has 512×512 pixels. Then, view-dependent LOD technology and texture mapping are used to map the image tiles to the digital earth grid model.
(4) Artificial water surface objects from ENCs such as depth contours, coastline, depth areas, anchor zones, prohibited areas, and so on are extracted. Then we use multi-layer technology, as described in Section 3.2, to fuse the vector data with the 3D environment of the digital earth.
(5) We use the 3DS Max software (Murdock, Reference Murdock2007) to build overwater and overland 3D entity models according to the 2D vector outlines extracted from the remote sensing image by AutoCAD. Then we use 3D geometric transformation to fuse models with the 3D environment of the digital earth.
(6) Mercator transformation, as described in Section 3.3, is constructed for the model to meet operation requirements of the chart work and practices of navigators, which transforms the model between spherical coordinates and Mercator projection scene coordinates.
(7) Finally, we will get a new model for future ECDIS. This model provides more rich and intuitive spatial information for navigation; it can support more spatial calculations and analyses such as XTE alarm, visibility analysis, bridge collision avoidance, etc. This model can support global data visualisation.
The data fusion flow. The sharp-cornered rectangles represent the operations; the round-cornered rectangles represent models or data; the arrow lines denote the operation flows.

2.2. System Architecture
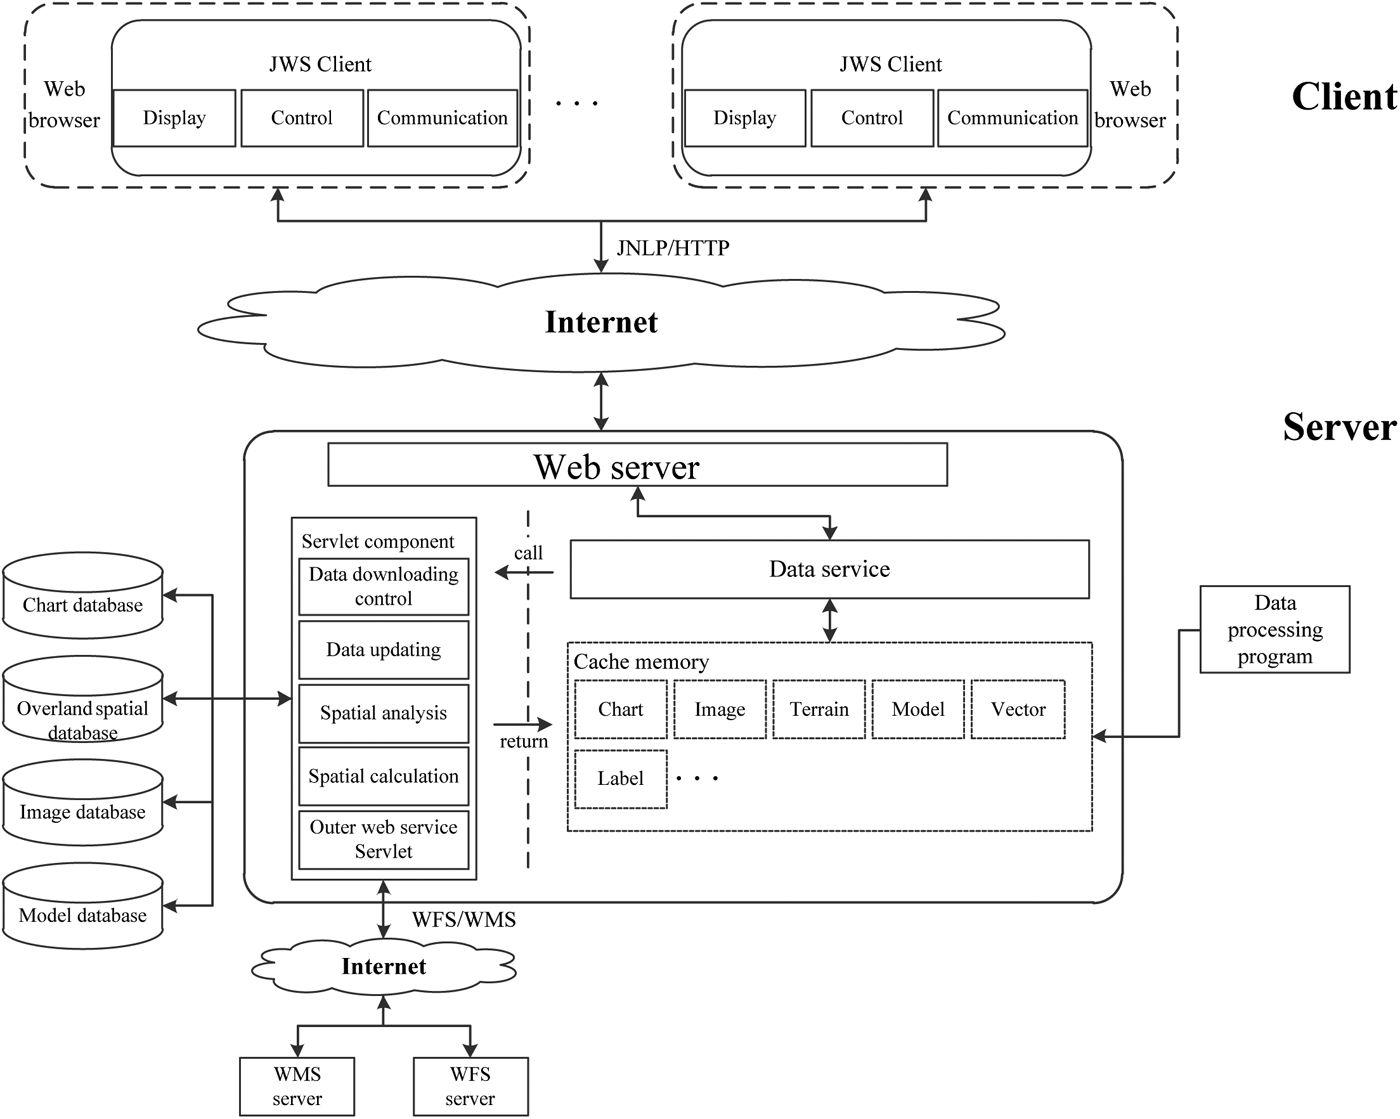
The system architecture of AIC 3D ECDIS (see Figure 2) is designed to satisfy the requirements of convenient web publishing, high quality user experience, efficient data service and security. The system is divided into client and server. The client is responsible for the functions of display, control, server communication, navigation sensor communication, navigation alarms, and so on. The server is used for data storage, data service, spatial calculation and analysis, etc.
AIC 3D ECDIS architecture. On the client side, the dashed round-cornered rectangles represent the access environments; the solid round-cornered rectangles represent the client programs; and the sharp-cornered rectangles represent the function modules. On the server side, the round-cornered rectangle represents the Web Server; the dashed sharp-cornered rectangles represent the data caches; the solid sharp-cornered rectangles represent the function components. The arrow lines denote the data flows in this diagram.
2.2.1. The client side
The client is built on Java Web Start (JWS) (Marinilli, Reference Marinilli2002) and component technology, mainly including three modules: display, control and communication. The display module is responsible for the construction and display of the digital earth and other data. The control module is responsible for view control and user interaction. The communication module is responsible for server communication, serial port communication, parsing sensor data, etc.
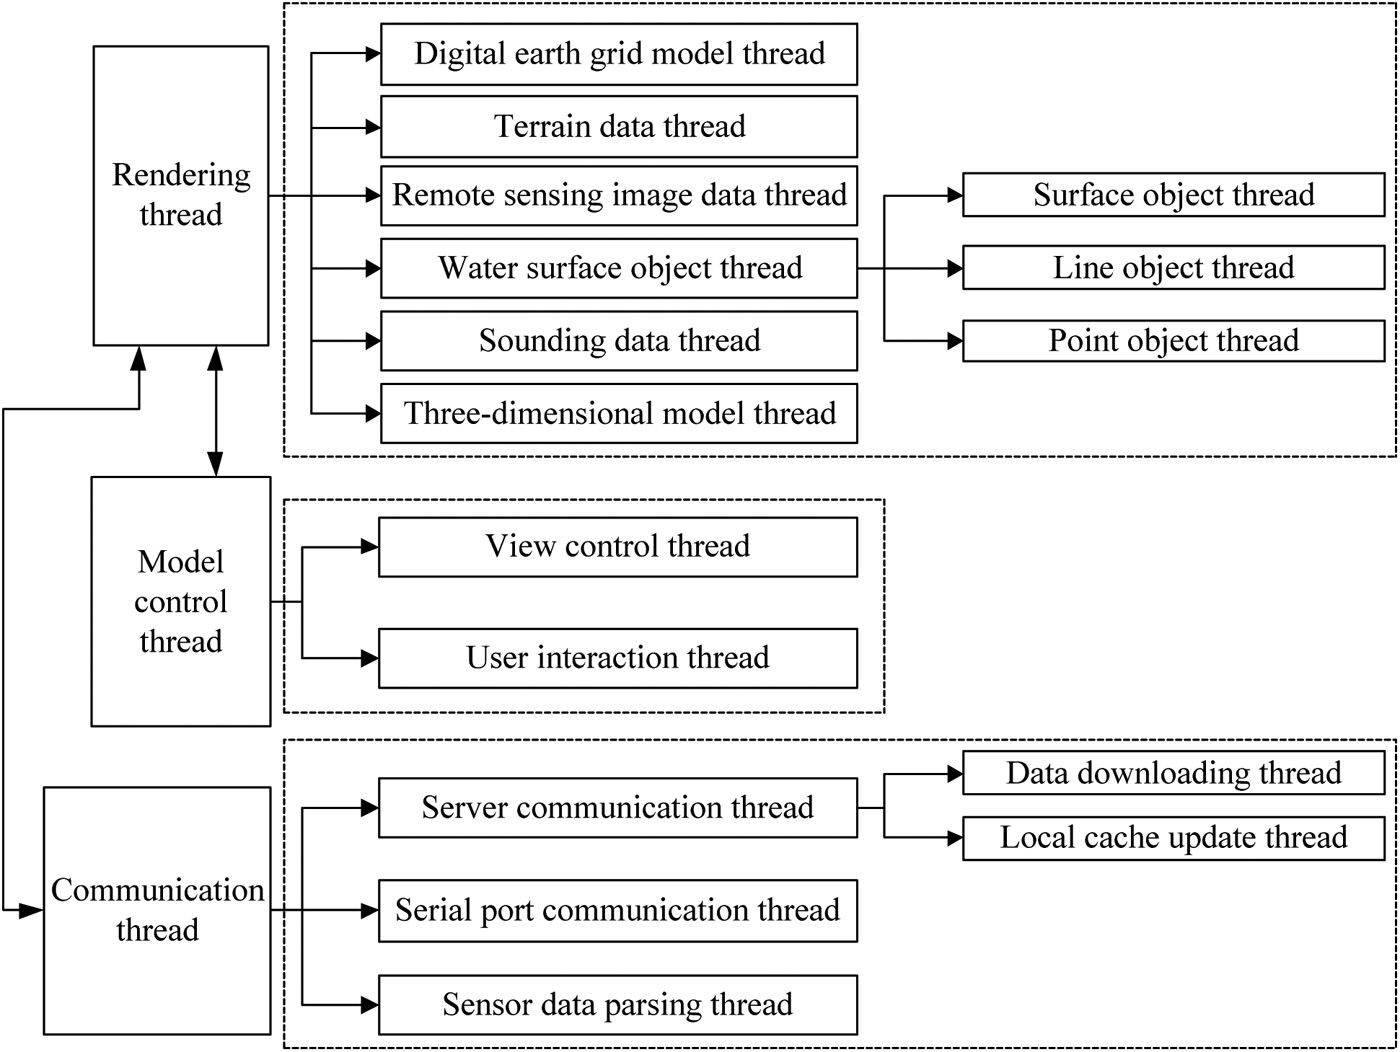
In order to guarantee high rendering speed and improve the adaptability to the network environment, the client adopts asynchronous multithread methods to realize all the components and uses local cache to cache the system data. To be specific, if the data required by a user has already existed in the local cache, the rendering thread will render the view with the data directly, otherwise the data downloading thread will be awakened by the rendering thread to download and cache the data, then the rendering thread will complete the rendering with the data stored in the cache. When a data update happens on the server, the local cache update thread will notify the data downloading thread to download the latest data, and then notify the rendering thread to refresh the scene. The thread structure of the client is shown in Figure 3. Based on the mechanism discussed above, navigators can store all the data for the next voyage in the local cache and use the web to receive data updates.
The client thread structure. The sharp-cornered rectangles represent the thread; double-headed arrows denote communications between threads; unidirectional arrows depict the thread divisions. Threads are divided into three categories: rendering thread, model control thread and communication thread.
2.2.2. The server side
The server is based on a standard web server. Tomcat (Chopra et al., Reference Chopra, Li and Genender2007) is used as the web server, and servlet (Hunter and Crawford, Reference Hunter and Crawford2001) is used to develop function components. The server communicates with clients through the JAVA Network Launching Protocol (JNLP) (Marinilli, Reference Marinilli2002) and Hypertext Transfer Protocol (HTTP). It is composed of a servlet component module, data processing module and other function modules. Servlet components connect with chart database, overland spatial database, image database, 3D model database and other web servers, and are responsible for data downloading control, data updating, spatial analysis, etc. The data processing module is used to process static geographic information data (with long update cycles), for example, constructing terrain and image pyramid models. Cache memory is used to cache data for the data service.
2.3. Benefits and Potential
Based on this system, navigators and marine pilots can get navigation support from ENCs, rich overland spatial information, and underwater information intuitively and directly. This system can decrease mental overload, minimize fatigue, and provide more intuitive spatial analysis. This should lead to a reduction of human error that is the main cause of marine accidents. Also, this system is published on the web to provide convenient application and data services through the network.
This system can dramatically improve the level of situational awareness of ship navigators compared with traditional ECDIS. 3D symbols, such as buoys, bridges, port structures and buildings can be recognized very quickly from any viewpoint. When the ship crosses under the bridge, this system will provide more detailed visualisations and spatial calculations. The modelling of underwater terrain, port structures and buildings will be very useful for berthing or un-berthing. The visualisation of underwater terrain will be very helpful for entering and leaving port, especially for large ships. Wrecks, underwater rocks, etc, can be better visualised using this system; moreover, this system can provide more spatial calculations and analyses such as visibility analysis, bridge collision avoidance, etc.
This system uses the web to provide convenient application downloading and installation, data downloading service and data update service. The client program can be installed automatically and data can be automatically downloaded, cached, and updated. This helps in reduction of the users' workload, and decreases the number of operation errors.
Based on the fusion model, this system could be used in navigation, pilotage and traffic monitoring. We believe it will replace traditional ECDIS in the near future.
3. KEY TECHNOLOGY
The most commonly used regular latitude-longitude grid model is employed to construct the digital earth model. Sahr et al. (Reference Sahr, White and Kimerling2003) introduced the construction of a discrete global grid model in detail. Therefore, this article will focus on the technologies that we propose and apply to construct AIC 3D ECDIS. Multi-resolution riverbed construction technology described in Section 3.1 is used to merge sounding data with the terrain pyramid model to construct a multi-resolution riverbed in the future ECDIS model; multi-layer technology is the data fusion method for spatial objects; Mercator transformation is used to transform the model between spherical coordinates and Mercator projection scene coordinates; view dependent LOD technology based on network quadtree breaks through the limitation of data amounts; and finally, web publishing methods are used to publish the system on the web to provide convenient application downloading and installing, data downloading services and data update services.
3.1. Multi-resolution Riverbed Construction Technology
In order to give a detailed introduction to the construction technology, this section first introduces our fusion method for the sounding data and terrain pyramid model.
The power-of-two pyramid model that we use has 11 levels, the top of which is the zero level tile of 20°×20° extent and each level tile is divided into 150×150 partitions, and the lower level tile has a quarter scope and double resolution of the parent tile. Thus, the ninth level tile has the exact size of 0·0390625°×0·0390625° with 22 500 partitions, and the width of each partition is almost 29 metres. The width of each partition of the tile in the tenth level is about 14·5 metres. However, the distance between each sounding point is usually larger than 100 metres (larger than 100 metres in scan line and larger than 300 metres between scan lines) in small scale charts and middle scale (1:20 000) harbour charts; even in large scale (1:2000) berthing charts, the distance is larger than 30 metres between scan lines. In the case of some special large scale charts, we can extend the level of pyramid model or increase the partition of each tile to fit the data density.
In consideration of the ENCs we have (usually the harbour chart) and the pyramid model we construct, if the hybrid data structure (Baumann et al., Reference Baumann, Dollner, Hinrichs and Kersting1999) is used to fuse sounding data with the terrain pyramid model, it will import larger approximation errors to the terrain model. This is because the density of pyramid grid in some levels is greater than that of the sounding data Triangulated Irregular Network (TIN). The TIN based on the sparse sounding data will cause sharp, even false appearance (see Figure 4).
TINs of sounding data. The two examples are constructed in ArcScene 10·0, and the data sources are harbour charts of Yangtze River China.
Based on the analysis above, we propose a method of hierarchical distance-weighted averaging to fuse the sounding data with terrain pyramid model. The method is mainly divided into three parts: terrain pyramid construction, threshold value calculation and data fusion.
3.1.1. Terrain pyramid construction
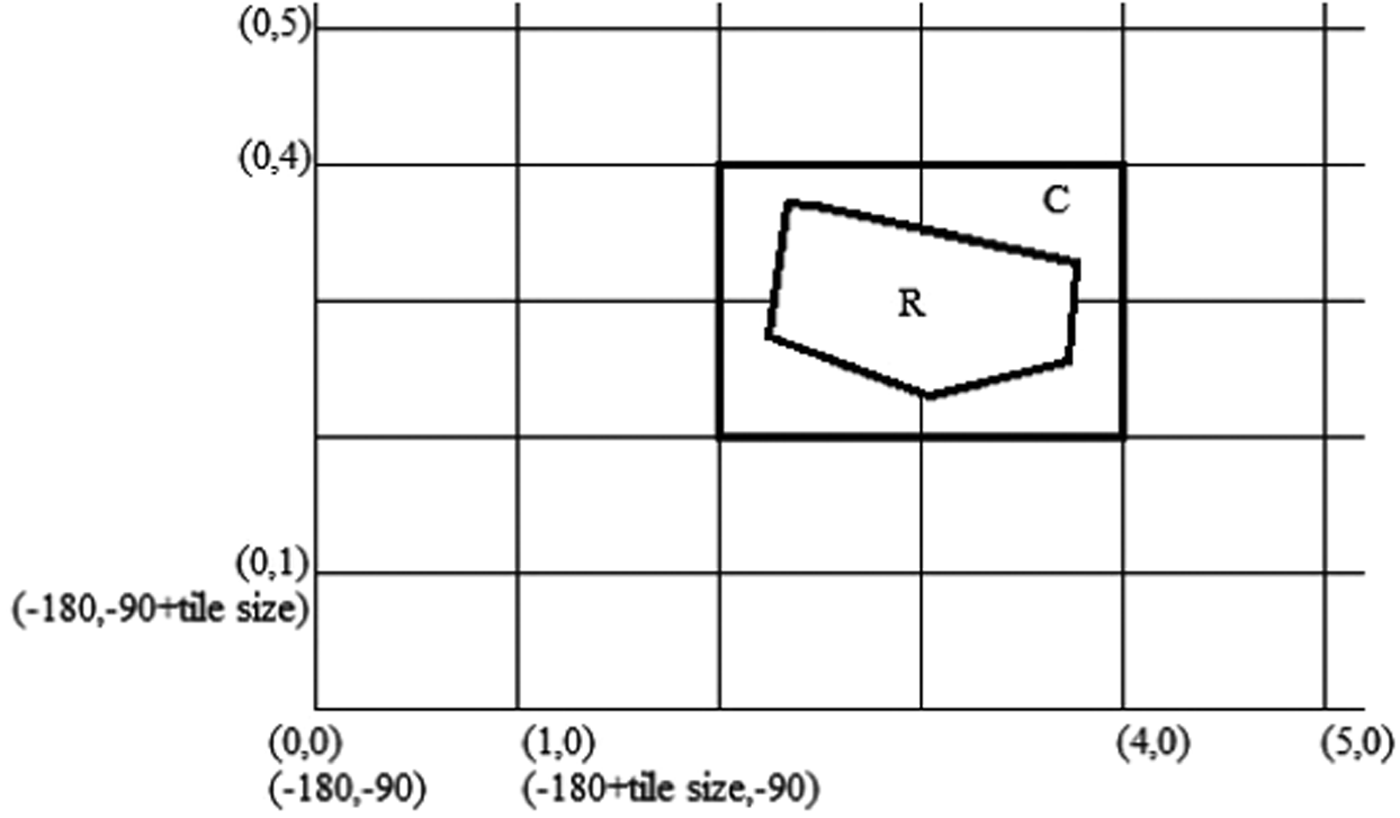
A regular square grid is used to create a terrain pyramid by sampling the original terrain data into coarser levels through a linear filter (Losasso and Hoppe, Reference Losasso and Hoppe2004). Each grid level divides the earth into a tile set. For simplicity, integer keys are used to index the tile (see Figure 5), and the side length (in degrees) of each tile needs to satisfy the requirement that 180 must be divisible by it. For example, the lower-left corner tile is indexed as (0, 0). If we only have the terrain data of R in Figure 5, we will just have to use grid C to sample the terrain data in the current level. C denotes the minimum bounding rectangle of R in the current level. In order to refine the sampling, each tile is divided into 150×150 pieces, so the sampling step is 1 in 150 of the tile width.
The schematic diagram for the grid, where the horizontal position represents the longitude, the longitudinal position represents the latitude, and each cell denotes one tile.
Then, each tile sampling datum is saved into a binary data file. To retrieve the file directly in the application, the index keys of the tile are used to name the file. Files at the same levels are stored in the same folders named after the level numbers. Files in the same rows are stored in the same subfolders, which are named after the row numbers, and all data files are named as “row number_column number”.
3.1.2. Threshold value calculation
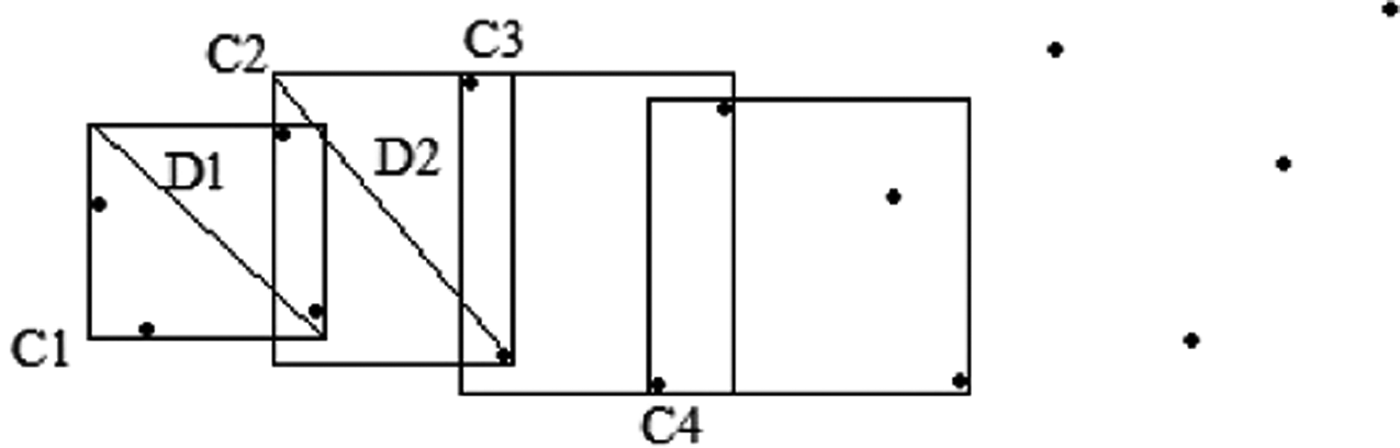
The threshold value is a limit on the distance in distance-weighted averaging. It represents the size of the action scope of each sounding data point. We design and propose the method of adaptive sliding window to calculate this value. In order to fit the characteristics of spatial distribution, we use the minimum bounding rectangle of every four points as the adaptive sliding window and slide two points for each step (see Figure 6). The maximum geographic distance of all sliding windows' diagonals is the threshold value. This value represents the dispersion property of the sounding data, and is the minimum value that will not cause missing interpolation inside the data grid. If a greater value is required, the only thing that should be done is to increase the number of sounding points that form the sliding window. This method is easy and quick, because it only has to do geographic distance calculation once for each sliding window. The detailed steps are as follows:
(1) Extract the sounding data from ENCs and sort the data points according to their geographic coordinates from lower-left to upper-right.
(2) Use the minimum bounding rectangle of every four points as the adaptive sliding window and slide two points in each step.
(3) Calculate the geographic distance of the diagonal for each sliding window and use the maximum value as the threshold.
The schematic diagram for the calculation of threshold value. The black points denote the sounding points and the rectangles depict the minimum bounding rectangles.
3.1.3. Data fusion
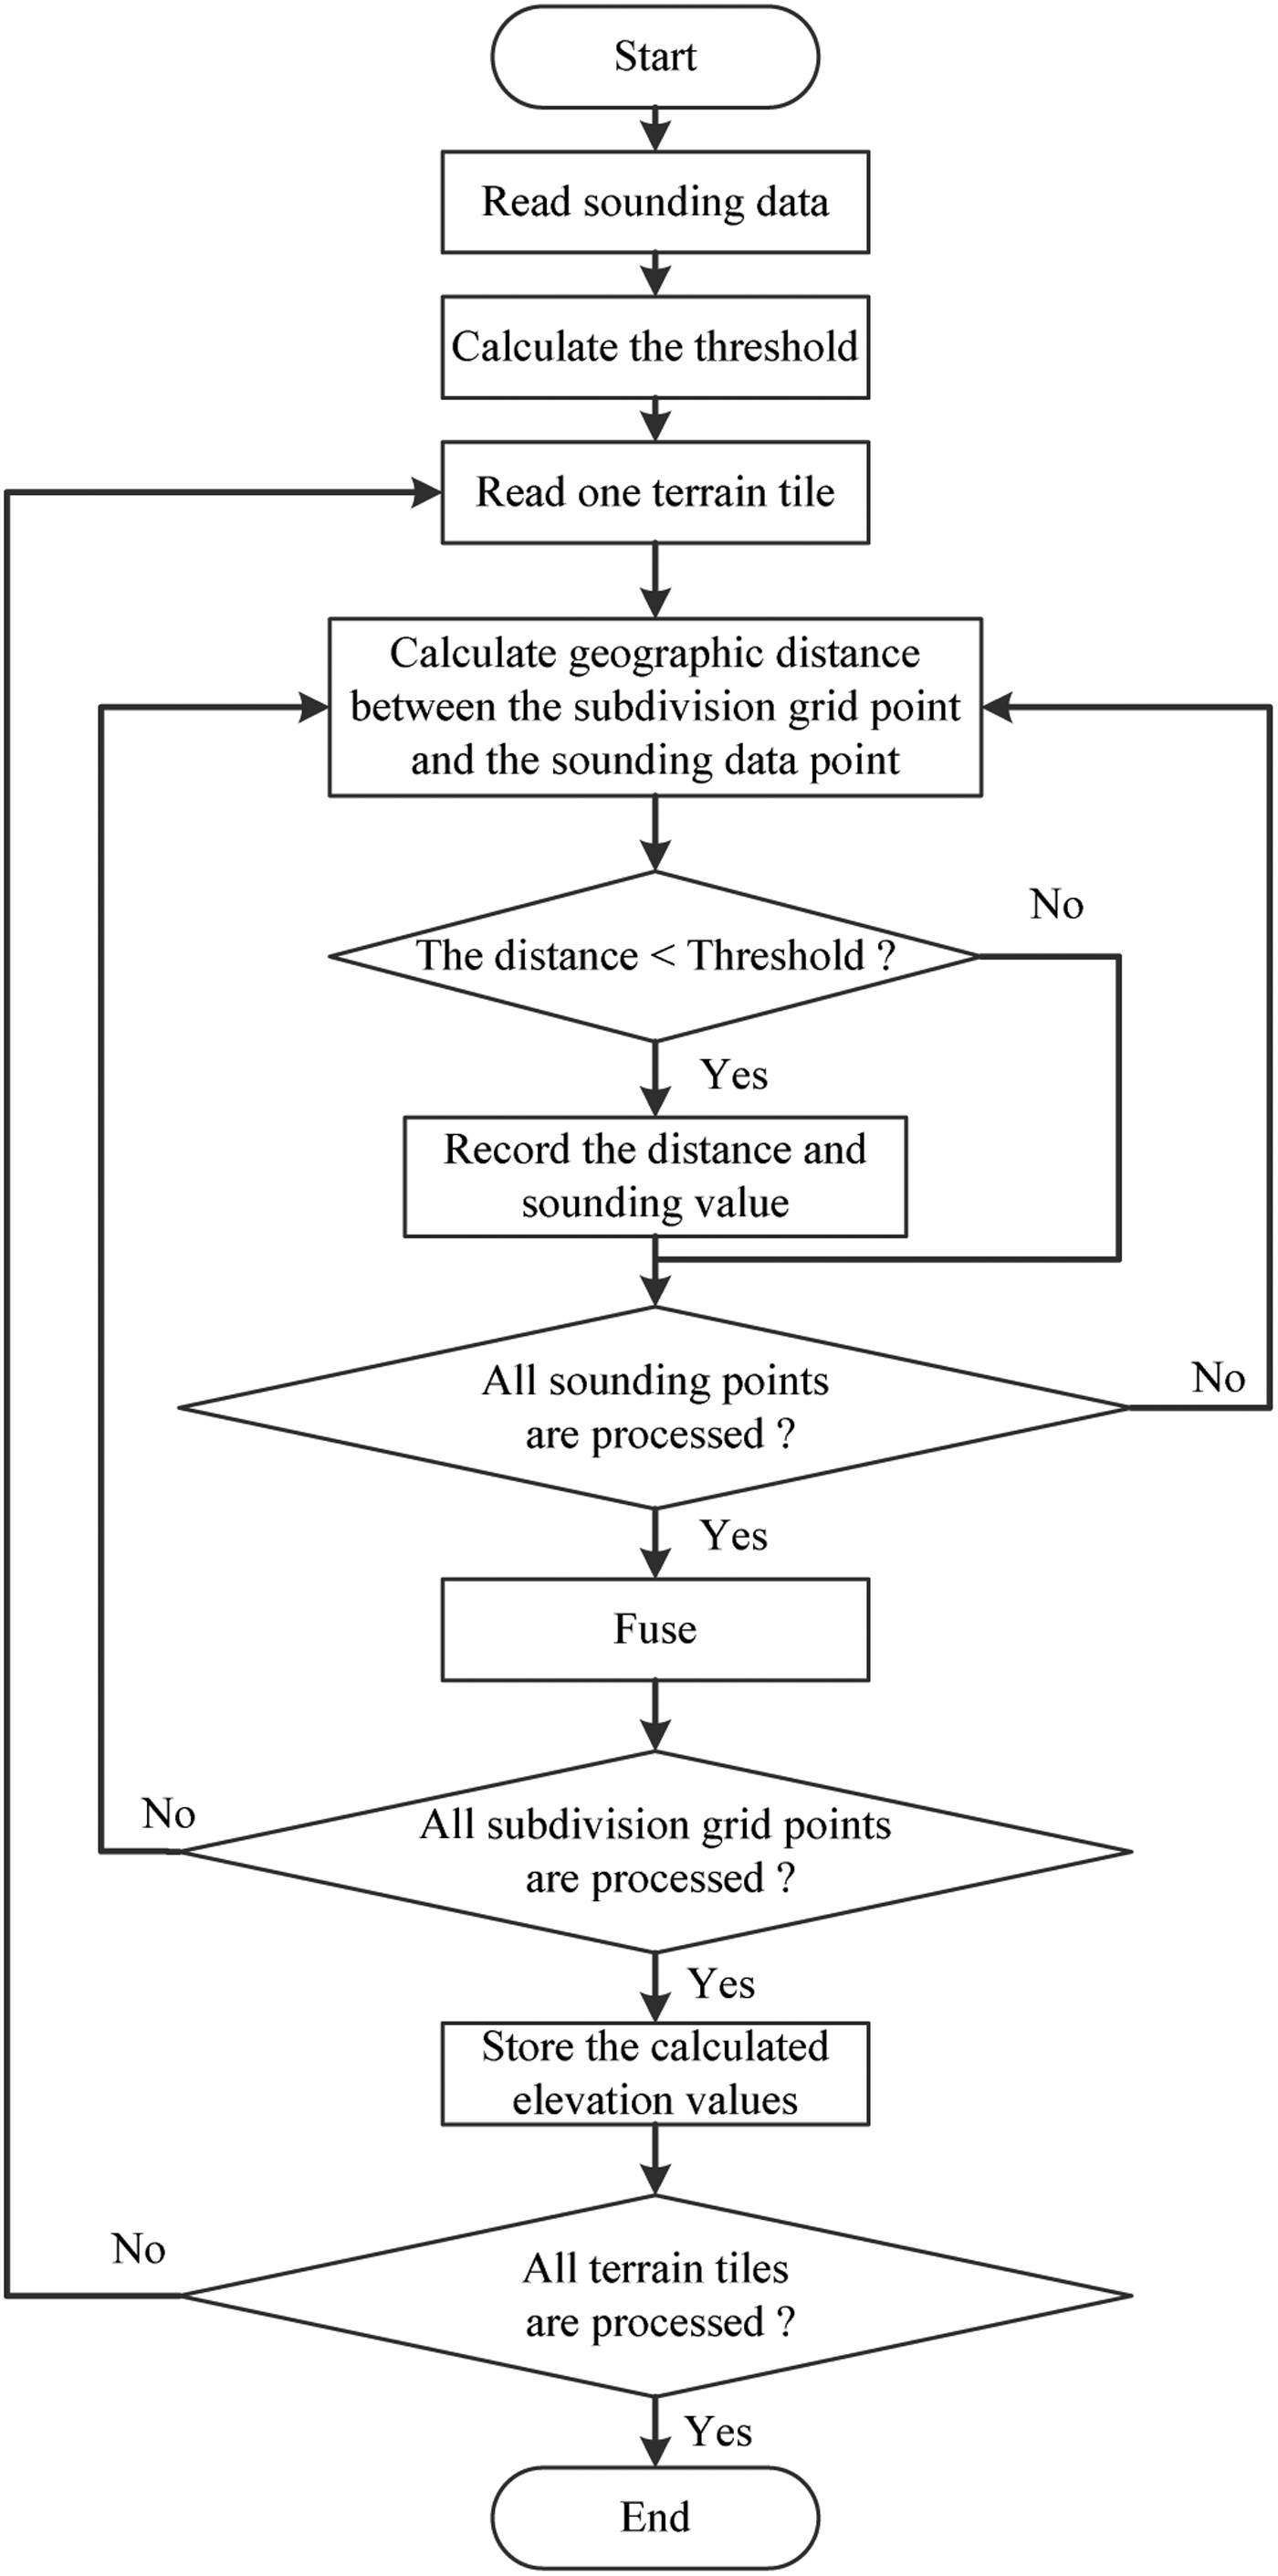
Distance-weighted averaging is used to fuse the sounding data with each level of the terrain pyramid. For each level, the fusion process is shown in Figure 7.
The fusion process.
In the step “Fuse”, the elevation value of the grid point p is calculated by the following equation:
 $$f\,(\,p) = \left\{ {\matrix{ {{{\sum\limits_{i = 1}^N {\displaystyle{{ - s_i} \over {d_i^n}}}} \Big/ {\sum\limits_{i = 1}^N {\displaystyle{1 \over {d_i^n}}}}},} & {d_i \ne 0,i = 1,2, \cdots, N.} \cr { - s_i,} & {d_i = 0,i \in \left\{ {1,2, \cdots, N} \right\}.} \cr}} \right.$$
In this equation, f(p) is the elevation value of the grid point p, d i is the geographic distance between the grid point p and the sounding data point, s i is the sounding value of the sounding data point, N is the number of data points that has been recorded and the case n = 2 can get good surface effect (Xin et al., Reference Xin, Lui and Pang2006).
The application effect of our method is shown in Figure 8. Here we take the ninth level tile “3126_7647” of the terrain pyramid model for example. Figure 8a shows the visualisation of the terrain tile before it fuses with sounding data. Figure 8b shows the fusion effect of sounding data and the terrain tile, where the blue recessed part depicts riverbed terrain. Figure 8c shows the amplified effect of riverbed terrain in Figure 8b. And obviously, the effect is smoother than that shown in Figure 4. These figures are plotted by Matlab R2009a.
The application effect of our fusion method is shown in the figures above.
This method works in the data processing program of the server side, and the terrain and riverbed pyramid model data are stored in the server. In this data structure, the client can get the tile data from the server according to its need and can load the tile data by the view-dependent LOD technology. When the elevation value of a certain point is required in the client program, the tile containing the point will return the value by bilinear interpolation from the corresponding subdivision grid corner values.
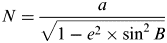
In this article, we use the WGS84 reference ellipsoid and regular latitude-longitude grid model to construct the digital earth model. The coordinate system of the digital earth model is: the coordinate origin is the ellipsoid centre, the Y-axis points to the North Pole, the X-axis points to the due east, and the Z-axis completes a right-handed coordinate system. View-dependent LOD technology described in Section 3.4 is used to determine the meshing and the tile data. Coordinates of each grid point of the grid model are calculated according to Equation (2). Thus, we will obtain the multi-resolution model of terrain and riverbed.
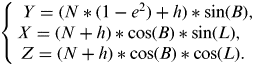 $$\left\{ \matrix{{\kern 1pt} {\kern 1pt} Y = (N*(1 - e^2 ) + h)*\sin (B), \cr X = (N + h)*\cos (B)*\sin (L), \cr {\kern 1pt} {\kern 1pt} Z = (N + h)*\cos (B)*\cos (L). } \right.$$
The parameters of the equation are as follows:
- B –
latitude, measured in radian (rad);
- L –
longitude, measured in radian (rad);
- X –
x-coordinate of the point (L,B), measured in metres (m);
- Y –
y-coordinate of the point (L,B), measured in metres (m);
- Z –
z-coordinate of the point (L,B), measured in metres (m);
- h –
elevation value of the point (L,B), measured in metres (m);
- e –
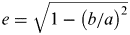
first eccentricity of ellipsoid,
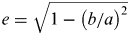
 $e = \sqrt {1 - \left( {{b / a}} \right)^2}$;
- N –
radius of curvature in prime vertical,
$N = \displaystyle{a \over {\sqrt {1 - e^2\times \sin ^2 B}}}$, measured in metres (m);- a –
ellipsoid semi major axis, a=6378 137·0000, measured in metres (m);
- b –
ellipsoid minor axis, b=6356 752·3142, measured in metres (m).
3.2. Multi-layer Technology for Data Fusion
In order to merge vector ENCs with the 3D navigation environment, multi-layer technology is used to implement the fusion. The spatial objects are divided into three categories: terrain following objects, 3D spatial vectors and 3D entities.
For the category of terrain following objects, which includes remote sensing images, labels, country boundaries, highways, and so on, we fuse the image tile with the terrain and riverbed by texture mapping to build the fundamental framework and use the elevation value of the terrain to calculate spatial positions of the label and highway polygon control point in the digital earth model. In the rendering process, we firstly use texture mapping to fuse the image tile with the global grid model of terrain and riverbed based on the view-dependent LOD technology. For a point object, such as a label, calculate its coordinates according to Equation (2), and then add it to the corresponding position. For a line object, such as a country boundary, it is represented by a list of control points. Firstly calculate its intersection points with the current meshing and add these intersection points to its control point list. Then calculate the coordinates of each control point according to Equation (2) and draw the coordinate list in the specified style. For a polygon object, it is represented by a closed boundary. Firstly deal with the boundary in the same way as the line object, and add the grid points of the current meshing within the boundary to its control point list. Then, triangulate the points line by line according to the meshing of the grid model, calculate the coordinates of each control point according to Equation (2), and draw the polygon in the specified style.
For the category of 3D spatial vector, this includes artificial spatial objects extracted from ENCs, such as depth contours, coastlines, depth areas, anchor zones, prohibited areas, and so on. We organise them into point, line, and polygon object groups. Then we design a layer with a certain elevation (the elevation of chart datum, the elevation of tidal datum, the elevation of tide, and so on), and draw these objects based on S-52 standard on the layer in semi-transparent mode. Hence, ENC data and riverbed are directly displayed in a unified framework. In the rendering process, firstly we extract artificial spatial objects from ENCs. For a point object, calculate its coordinates according to Equation (2), where its elevation is set to the elevation of the layer reference, and then add it to the corresponding position. For a line object, calculate the coordinates of each control point according to Equation (2), where the elevation of each control point is set to the elevation of the layer reference, and then draw the coordinate list according to the display requirements of S-52 standard (Edition 6·0, March 2010). For a polygon object, tessellate the polygon's interior by the Tessellation Technology of OpenGL (Zhang et al., Reference Zhang, Zhang, Ai and Zhang2012), calculate the coordinates of each control point according to Equation (2), where the elevation of each control point is set to the elevation of the layer reference, and then draw the polygon according to S-52 standard.
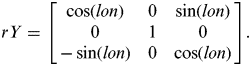
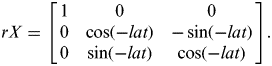
For 3D entities, we use three-dimensional models to describe the data, such as beacon lights, bridges, port structures, buildings, and so on, and use 3D geometric transformation to fuse the models with the scene. The models are built in the same coordinate system as that of the digital earth model, that is, the coordinate origin is the model centre, the Y-axis points to the North Pole, the X-axis points to due east, and the Z-axis completes a right-handed coordinate system. In order to match the terrain, the model should be transformed according to its longitude and latitude in the digital earth coordinate system. The details of the transformation are as follows:
(1) Construct the counter clockwise rotation matrix about the Y-axis of the digital earth coordinate system, and the rotation angle is the model's longitude. The matrix is as follows:
(3)$$rY = \left[ {\matrix{ {\cos \left( {lon} \right)} & 0 & {\sin \left( {lon} \right)} \cr 0 & 1 & 0 \cr { - \sin \left( {lon} \right)} & 0 & {\cos \left( {lon} \right)} \cr}} \right].$$(2) Construct the clockwise rotation matrix about the X-axis of the digital earth coordinate system, and the rotation angle is the model's latitude. The matrix is as follows:
(4)$$rX = \left[ {\matrix{ 1 & 0 & 0 \cr 0 & {\cos \left( { - lat} \right)} & { - \sin \left( { - lat} \right)} \cr 0 & {\sin \left( { - lat} \right)} & {\cos \left( { - lat} \right)} \cr}} \right].$$(3) Adjust the elevation of the model to get better visualisation effect.
Furthermore, transformation parameters of the model are stored in an XML configuration file, such as longitude, latitude, elevation, etc. Thus, the system can use the parameters to load the model automatically.
The fusion effects are shown in Figure 9, where ENC artificial water surface objects are displayed in semi-transparent mode, the green colour depicts the deep-water route part and the symbol in the top right corner is the directional compass. Figure 9a shows the overwater view effect of the fusion of wharf, ENC, terrain and riverbed. Figure 9b shows the underwater view effect of the fusion of buoy, wharf, ENC, terrain and riverbed. Figure 9c shows the overwater view effect of the fusion of buoy, bridge, ENC, terrain and riverbed near the Nanjing Bridge of Yangtze River. Figure 9d shows the water surface view effect of the fusion of buoy, bridge, ENC, terrain and riverbed near the Nanjing Bridge of Yangtze River. Figure 9e shows the large-sale view effect of the future ECDIS model at the lower Yangtze River and the coast.
Data fusion effects of the future ECDIS model in our system AIC 3D ECDIS.
3.3. Mercator Transformation
In order to meet operational requirements of the chart work and practices of navigators, we construct a Mercator transformation to transform the fusion model between spherical coordinates and Mercator projection scene coordinates. We use the regular latitude-longitude grid model to construct the digital earth model. It is the most commonly used regular discrete global grid. The data of the grid model are organised into a regularly distributed array of points. It is easy to calculate the geographic coordinate of the grid point through the corresponding row and column numbers in the array and the coordinate of the start point. The transformation is essentially to transform the grid point (control point) between spherical coordinate and Mercator projection scene coordinate. The steps are as follows:
(1) Establish the coordinate system of Mercator three-dimensional scene. The coordinate system we use is: the Y-axis points to the North Pole, the Z-axis points up, the X-axis points to the due east, and they complete a right-handed coordinate system. The XY plane is considered as the Mercator projection plane, and the origins of Y-axis and X-axis are set at zero degrees of latitude and longitude, respectively. Z-axis represents elevation, and the elevation of sea level is set to zero.
(2) Transform the geographic coordinate to Mercator projection plane by the following equation and retain the elevation information.
 $$\left\{ \matrix{{\kern 1pt} {\kern 1pt} Y = K\ln \left( {\tan \left( {\displaystyle{\pi \over 4} + \displaystyle{B \over 2}} \right) \times \left( {\displaystyle{{1 - e\sin B} \over {1 + e\sin B}}} \right)^{\textstyle{e \over 2}}} \right), \cr X = K\left( {L - L_0} \right), \cr K = N_{B_0} \cos \left( {B_0} \right) = \displaystyle{{{{a^2} / b}} \over {\sqrt {1 + e'^2 \cos ^2 \left( {B_0} \right)}}} \cos \left( {B_0} \right). } \right.$$
Since standard nautical charts use the WGS84 coordinate system, we use WGS84 parameters to do the transformation. Reference latitude of the projection is zero. The parameters of the equation are as follows:
- X –
horizontal rectangular coordinate, measured in metres (m);
- Y –
longitudinal rectangular coordinate, measured in metres (m);
- B –
latitude, measured in radian (rad);
- L –
longitude, measured in radian (rad);
- B 0 –
reference latitude of the projection, B 0=0, measured in radian (rad);
- L 0 –
longitude of the coordinate origin, L 0=0, measured in radian (rad);
- a –
ellipsoid semi major axis, a=6378 137·0000, measured in metres (m);
- b –
ellipsoid minor axis, b=6356 752·3142, measured in metres (m);
- e –
first eccentricity of ellipsoid,
$e = \sqrt {1 - \left( {{b / a}} \right)^2}$;- e’ –
second eccentricity of ellipsoid,
$e' = \sqrt {\left( {a/b} \right)^2- 1}$;- N –
radius of curvature in prime vertical,
$N_{B_0}= \displaystyle{{{{a^2} / b}} \over {\sqrt {1 + e'^2 \times \cos ^2 B_0}}}$, measured in metres (m).
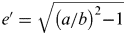
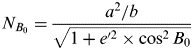
For the categories of terrain following object and 3D spatial vector, Equation (5) is used to recalculate the coordinates. Then, redo the texture mapping for remote sensing image and redraw the label, highway, and so on, according to the transformed terrain grid; and redraw artificial spatial objects extracted from ENCs on the transformed layer.
For the 3D model, it is firstly rotated by the following matrices:
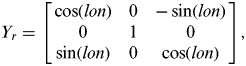 $$Y_r = \left[ {\matrix{ {\cos \left( {lon} \right)} & 0 & { - \sin \left( {lon} \right)} \cr 0 & 1 & 0 \cr {\sin \left( {lon} \right)} & 0 & {\cos \left( {lon} \right)} \cr}} \right],$$
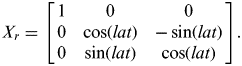 $$X_r = \left[ {\matrix{ 1 & 0 & 0 \cr 0 & {\cos \left( {lat} \right)} & { - \sin \left( {lat} \right)} \cr 0 & {\sin \left( {lat} \right)} & {\cos \left( {lat} \right)} \cr}} \right].$$
In the matrices, lon and lat are respectively the longitude and latitude of the model centre. Y r is the rotation matrix about Y-axis of the digital earth coordinate system, while X r is the rotation matrix about X-axis.
When the scene has been transformed to Mercator scene, the remote sensing image tile will be stretched after texture mapping. If we put the rotated models directly on the image, it will cause fusion deviation. 3D models can only be processed integrally, such as rotation, translation, etc. Therefore, there are two solutions:
(1) Zoom in or out the 3D model in both the horizontal and vertical directions (X-axis and Y-axis directions) according to the distortion of the corresponding area in longitude and latitude directions.
(2) Build another copy of the model based on the Mercator projection remote sensing image for the follow-up fusion of the transformation.
The first solution only has to build 3D models once, but it is difficult to match the image exactly. In order to ensure the accuracy of the fusion, we choose the second solution. In this way, we prepare two sets of 3D models for the transformation process.
Figure 10 shows the transformation effects. Figure 10a shows a global view of the model before the Mercator transformation. Figure 10b shows a global view of the model after the Mercator transformation. Figure 10c shows a large-scale view of the model before the Mercator transformation at the coast of east China. Figure 10d shows the Mercator transformation view of Figure 10c, with the same viewpoint height (1039 km) as Figure 10c. Figure 10e shows a local view of the model before the Mercator transformation. 3D models fuse with the image tile and the depth area, where the added red circles are used to mark 3D models. Figure 10f shows the Mercator transformation view of Figure 10e, with the same viewpoint height (1 km) and viewpoint position (118·7270, 32·0924) as Figure 10e. Figure 10f displays a smaller geographical area in the viewport because of the stretch. After the transformation, the depth area and other artificial objects can still fuse with the 3D environment, and 3D models can still merge well with the image tile.
Effects of Mercator transformation in our system AIC 3D ECDIS.
3.4. View-Dependent LOD Technology Based On Network Quadtree
In order to ensure the system is independent of the data amount, that is, to break through the limitation of the data amount, we choose view-dependent LOD technology which is based on network quadtree to manage and render the data. Therefore, this system can support global 3D visualisation. The details are as follows:
(1) Use network oriented multi-resolution spatial quadtree to organise and index terrain and image data in the client (Chen et al., Reference Chen, Ma, Wang and Dong2001). Thus, the capability of containing the terrain and image dataset is only limited by hardware configuration. It is easy to manage and retrieve the data in this data structure, and also convenient to do the intersection calculation by the bounding box of each node in the tree.
(2) Use view frustum to cull the scene (Losasso and Hoppe, Reference Losasso and Hoppe2004). View frustum culling reduces rendering load by a factor of about 3 for a 90° field of view. Obviously, this is an effective method for reducing data amount, such as reducing remote sensing image data, terrain and riverbed tile data, 3D models, etc., which are in the scene.
(3) Use viewer distance and error threshold to determine the multi-resolution visual field (Wang and Dong, Reference Wang and Dong2000). This way of mesh simplification can satisfy a viewer's visual habit and reduce rendering load. We use viewer distance to determine whether a certain 3D model or label should be displayed, this will further reduce rendering load.
3.5. Web Publishing Method
In order to provide convenient application and data services and conform to the developing trend of geo-information (Li and Shao, Reference Li and Shao2009), we use the web to publish application and data services. The server is built in the Tomcat+Servlet mode, and the client program is deployed on the server side.
Tomcat is chosen as the web server, and servlet API is used to develop function components such as data downloading component, data updating component, spatial calculation and analysis component, and so on. The server receives client requests through the HTTP protocol, interacts with data resources (file, database, web service, and so on), performs calculation and analysis, and then returns the results to clients.
The publishing process of the client program is as follows:
(1) Use the digital signature technology of jar file to sign the client program package in the server.
(2) Compile the JNLP file to realize the calling of the client program package (the JWS client program).
(3) Deploy the JNLP file and the client program package to the corresponding directories of web server (Tomcat).
(4) Compile hypertext markup language (HTML) file for users to access the JNLP file.
Users use a web browser to visit the HTML page, and the client program will be downloaded and installed automatically. When the client program is updated, the program should be repacked, signed, and published on the server side. Then the installed program on the client side will be updated automatically.
4. SYSTEM IMPLEMENTATION AND APPLICATION
Based on World Wind Java SDK (an open source Java development component of NASA digital earth technology), the client program is developed by using the Java language according to the system design and technology described above, and then JWS technology is used to publish the client program. We implement a simple navigation function in the client program. The digital signature method is adopted to solve the problem of JWS client's access rights to the local system resources (local cache data, serial port communication, and so on). RXTX component (an open source serial port communication component) is used by the client program to read the navigation data from local sensors. Figure 11a shows the effect of GPS connection near the Nanjing Bridge of Yangtze River China. On the basis of the real-time state information, 3D models and ENCs are used to detect the navigation state of own-ship by 3D collision detection algorithm and 2D spatial comparison and analysis algorithm of point-line-areas. Furthermore, the client program implements the alarm and information cue functions. An effect is shown in Figure 11b. Own-ship is moving in real-time according to the GPS data, and system alert information emphasised in red appears when the ship is approaching the bridge.
Effects of navigation function in our system AIC 3D ECDIS.
5. CONCLUSION
This article proposes a new model and complete solution for future ECDIS and develops a prototype system. The multi-resolution riverbed construction technology and the multi-layer technology for data fusion are presented. According to operation requirements of the chart work and practices of navigators, Mercator transformation is realized in the system. Also, the system is published on the web to provide application and data service through the network.
AIC 3D ECDIS is designed and realized in order to provide a more visually efficient chart display system. This system can provide both global and local 3D visualisation services for navigation. Users can directly obtain ENC, riverbed, terrain, and other spatial information in a unified framework and interface. This system will be significant for inland navigation, entering and leaving port, coastal navigation, and so on.
At present, AIC 3D ECDIS is still a prototype system with quite limited functions for ship navigation. Further work has to be done in terms of web publishing, for example, server-side concurrency control. Ship navigation functions will also need enhancement.
FINANCIAL SUPPORT
This work was supported by the Fundamental Research Funds for the Central Universities (grant number 3132013303).