Implications
This work showed an increase in milk fat concentration in response to improving diet quality for thin cows in late gestation. This effect was much larger than had previously been observed with cows entering the dry period in better condition. This has direct consequences for the value of milk. The study also showed effects of feeding level in the early dry period on calf weight, which may have implications for dystocia, though no problems were encountered in this study.
Introduction
There are conflicting results about the effect of increasing pre-partum energy supply on milk production in the subsequent lactation. Roche (Reference Roche2007) suggested that discrepancies in milk production responses may relate to differences in the level of feeding adopted after calving, but his data showed interaction effects between pre- and post-partum feeding level only for blood analysis and not for milk production. Several studies have reported increased milk fat concentration in responses to additional pre-partum energy (Lodge et al., Reference Lodge, Fisher and Lessard1975; Holcomb et al., Reference Holcomb, Van Horn, Head, Hall and Wilcox2001; McNamara et al., Reference McNamara, O’Mara, Rath and Murphy2003a), though others did not (Garnsworthy and Topps, Reference Garnsworthy and Topps1982; Dewhurst et al., Reference Dewhurst, Moorby, Dhanoa, Evans and Fisher2000b).
Whilst there may be benefits of additional feed in the dry period for some cows, it is important to avoid over-feeding as this has often led to problems with fatty liver, ketosis (Grummer, Reference Grummer1995) and a wide range of other conditions (Curtis et al., Reference Curtis, Erb, Sniffen, Smith and Kronfeld1985) after calving. The literature is unequivocal about increased energy supply pre partum, leading to increased body reserves at calving and a correspondingly increased negative energy balance after calving (Garnsworthy and Topps, Reference Garnsworthy and Topps1982; Dewhurst et al., Reference Dewhurst, Moorby, Dhanoa, Evans and Fisher2000b; McNamara et al., Reference McNamara, Murphy, Rath and O’Mara2003a and Reference McNamara, O’Mara, Rath and Murphy2003b). Consequently, there has been interest in two-stage strategies with reduced energy intake in the first part of the dry period and increased feeding in the last part of the dry period when intakes tend to decline (Hayirli et al., Reference Hayirli, Grummer, Nordheim and Crump2003; Dewhurst et al., Reference Dewhurst, Davies and Fisher2009). However, whilst some studies have shown increased yields of milk components in response to stepping up the level of feeding in the last 3 to 4 weeks of the dry period (McNamara et al., Reference McNamara, O’Mara, Rath and Murphy2003a), others have found no benefit (Beever, Reference Beever2006; Dewhurst et al., Reference Dewhurst, Davies and Fisher2000a).
This study sought to address these discrepancies by using strategies based on silages with divergent digestibilities to alter the level and pattern of metabolisable energy (ME) supplied to dry cows that were in relatively low body condition at drying off.
Material and methods
This study was carried out under the authority of licences issued by the UK Home Office. The experiment compared first-cut grass silages that were harvested earlier than usual (high digestibility) and later than usual (low digestibility), as feeds for dry cows. A third strategy involved feeding the low-digestibility grass silage in the early dry period when higher intakes are anticipated and nutrient requirements are lower, and changing to the high-digestibility grass silage in the final 3 weeks before calving. First-cut perennial ryegrass (Lolium perenne L.) silages were prepared during vegetative growth on 9 May 1998 (high digestibility; approximately 730 g digestible organic matter/kg dry matter (DM)) and after flowering on 15 June 1998 (low digestibility; approximately 640 g digestible organic matter/kg DM) in order to provide contrasting dry-period diets. Silages were precision-chopped and ensiled in bunker silos.
Animals and their management
A total of 46 Holstein-Friesian cows in their second or subsequent lactation, calving from September to November, were selected for the experiment. Cows with health problems and those with low levels of production in the previous lactation (<5000 kg) were excluded. Cows were dried off abruptly, 60 days prior to the anticipated calving date, given intra-mammary antibiotic treatment (Cepravin Dry Cow 250 mg; Schering-Plough Ltd, Welwyn Garden City, UK), and grazed on sparse perennial ryegrass (L. perenne L.) pasture for 4 days. The cows were housed and introduced to roughage intake control feeders (Insentec BV, Marknesse, the Netherlands) from 8 weeks before anticipated calving dates. The cows were adapted to the facility and trained to use the feeders over the next 2 weeks, using a mixture of the two silages (40% high digestibility and 60% low digestibility).
Cows were allocated, at random, to one of three treatments (two groups of 15; one of 16) over the final 6 weeks prior to the anticipated calving date, balancing groups for second parity cows. Silages supplemented with calcined magnesite (50 g/cow per day) were the only feeds fed in the dry period. The treatments were based on the silage fed in the first 3 weeks of this period and the remainder of the dry period, respectively – HH, high digestibility throughout; LH, low digestibility and then high digestibility; LL, low digestibility throughout. Animals were moved to calving pens just prior to calving and suckled their calf on the day of calving. The duration of the second period depended upon actual calving date relative to expected calving date and averaged 24.2 ± 5.53, 21.3 ± 5.36 and 22.2 ± 4.48 days for HH, LH and LL, respectively.
All cows were offered a single lactation diet based on 8 kg of standard dairy concentrate/day (building up to this level by 7 days after calving) and ad libitum first-cut grass silage. The concentrate allocation was split between parlour feeders (2 kg/milking) and out-of-parlour feeders.
Measurements
Samples of all feeds were collected weekly and bulked monthly for analysis. Feed DM was determined by drying to constant weight at 100°C, whilst ash was determined by combustion at 550°C for 16 h. Crude protein (CP; N × 6.25) was determined using a Kjeldahl procedure with copper catalyst. Ether extractions were performed using ‘Soxtec’ extractors (Perstorp Analytical Ltd, Berkshire, UK). Amylase neutral detergent fibre (NDF) and acid detergent fibre were determined according to Van Soest et al. (Reference Van Soest, Robertson and Lewis1991) and Van Soest and Wine (Reference Van Soest and Wine1967), respectively. Water-soluble carbohydrates were measured using the anthrone method adapted to an autoanalyser (Method 9a; Technicon Industrial Systems, Tarrytown, USA). Starch was solubilised in boiling water (1 h) and incubated with buffered amyloglucosidase to liberate sugars that were measured using the automated anthrone method. The volatile components of silages were extracted in water (20 g extracted with 100 ml water). Lactic acid was determined using test kits (Kit no. 139 084; Boehringer Mannheim Ltd, East Sussex, UK) using a discrete analyser (FP-901M Clinical Analyzer; Labsystems Oy, Helsinki, Finland). Volatile fatty acids and ethanol were determined by gas chromatography (Fussell and McCalley, Reference Fussell and McCalley1987).
Metabolisable energy estimates were based on near infrared reflectance spectroscopy for grass silages (ME-tick system used by the UK advisory services; Offer et al., Reference Offer, Cottrill and Thomas1996) and equation E3 (based on neutral cellulose/gammanase digestibility and acid hydrolysis ether extract; Ministry of Agriculture, Fisheries and Food, 1993) for concentrates.
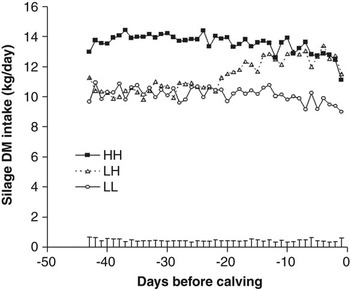
Feed intakes were recorded daily using the roughage intake control feeders. Daily intakes were aggregated into weekly values relative to calving date for statistical analysis, though daily values were retained for Figure 1. Live weight and body condition score (BCS) were recorded at housing and then weekly (Dewhurst et al., Reference Dewhurst, Moorby, Dhanoa, Evans and Fisher2000b) and calf weights were recorded within 24 h of birth. The BCS scale was 0 to 5: 0 (very poor), 1 (poor), 2 (moderate), 3 (good), 4 (fat) and 5 (grossly fat). Blood was collected fortnightly by jugular venepuncture into heparinised tubes and plasma analysed for glucose, β-hydroxybutyrate, total protein, albumin and urea using test kits (Moorby et al., Reference Moorby, Dewhurst, Tweed, Dhanoa and Beck2000). Results were consolidated according to fortnights (4 to 5 week pre-partum, 1 to 2 weeks pre-partum, 2 to 3 weeks post-partum and 5 to 6 weeks post-partum) for statistical analysis.
Silage dry matter intake (kg/day) for the three dietary treatment groups over the 6 weeks before calving. Error bars show the pooled s.e. for daily treatment means.

Cows were milked twice-daily, and milk yields were recorded at all milkings and aggregated weekly. Milk samples were collected from two consecutive milkings each week and analysed for fat, protein and lactose content using an infrared milk analyser (NMR Central laboratory, Somerset, UK).
Statistical analysis
Statistical analysis was conducted using Genstat (Release 10.1; Lawes Agricultural Trust, 2007) with ‘dry-period treatment’ as treatment factor. Following on from significant F-tests, further comparison of treatments means used a t-test. General analysis of variance was used for intakes, live weight, BCS or blood analytes in individual weeks, liveweight change, BCS change and calf weights. Repeated measures analysis of variance (Procedure AREPMEASURES) was used for intakes, milk production and milk composition over lactation weeks 2 to 8.
Results
Feed composition
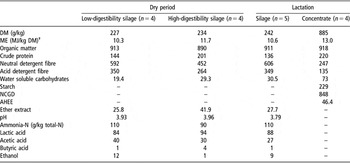
The results of feed analysis are given in Table 1. The silages were well preserved with pH below 4 and levels of lactic and butyric acids relatively low for unwilted silages. As expected, the early-cut grass silage had higher ME, CP and ether extract levels than the late-cut grass silage, whilst NDF levels differed in the opposite direction.
Chemical composition (g/kg dry matter (DM), unless stated otherwise) and metabolisable energy (ME) content of the grass silages and concentrate used in this experiment

NCGD = neutral cellulase/gammanase digestibility; AHEE = acid hydrolysis ether extract.
†ME content estimated using the ME-tick near infrared reflectance spectroscopy calibration for grass silages (Offer et al., Reference Offer, Cottrill and Thomas1996) and equation E3 for concentrates (Ministry of Agriculture, Fisheries and Food, 1993: ME (MJ/kg DM) = 0.014 NCGD (g/kg DM) + 0.025 AHEE (g/kg DM)).
Dry period
There were no differences between treatment groups in live weight (618 ± 64 kg) or BCS at the loin or tail sites (2.2 ± 0.26 and 2.2 ± 0.28, respectively) at the start of this experiment. Cows were in relatively low condition (BCS = 2.2) at the start of the experiment.
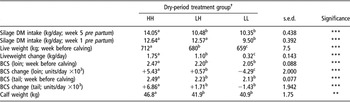
Daily silage DM intakes over the dry period are shown in Figure 1. The large difference in DM intakes between the two silages and the absence of a major decline in intake until the 2 days prior to calving, are apparent. Statistical analysis of intakes in the 5th week pre partum and the final week pre partum, when all cows received the silage allocated for the early or late dry period (Table 2), confirmed the large difference. Average forage DM intakes (kg/day) over the entire 6 weeks of dry-period treatments were 13.56, 11.50 and 10.14 kg/day (s.e.d. = 0.369; P < 0.001) for HH, LH and LL, respectively. The similar intakes of LL and LH groups in the early dry period (when both groups received the low-digestibility silage) and of groups HH and LH in the late dry period (when they both received the high-digestibility silage) is as expected. The gradual transition of the LH group from low to high digestibility is, in part, a reflection of the fact that the change occurred from 9 to 28 days before calving (21.3 ± 5.36), as a result of the normal deviation of calving dates from expectation.
Effects of dry-period treatment on dry matter (DM) intake, live weight and body condition score in the week before calving, the rate of change in live weight and body condition score (BCS) over the period from 6 to 1 week before calving, and calf birth weights

†Dry period treatments: HH, high-digestibility grass silage fed throughout the dry period; LH, low-digestibility grass silage fed in the first part of the dry period then high-digestibility grass silage fed for the final 3 weeks before anticipated calving date; LL, low-digestibility grass silage fed throughout the dry period.
**P < 0.01; ***P < 0.001.
Means in the same row with different superscripts are significantly different (P < 0.05).
The effects of dry-period diet on changes in live weight and BCS over the dry period, as well as calf birth weights are shown in Table 2. Effects on live weight were as expected, with values for LH intermediate to LL and HH. The exceptionally high liveweight gain (1.75 kg/day) for HH cows is of particular note. Results for BCS showed the same trend, though values for treatment group LH were only statistically different from LL for BCS change at the loin site. Calves from treatment group HH were heavier than calves from either LH or LL.
Lactation period
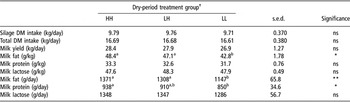
The residual effects of dry-period treatments on silage intake, milk yield and milk composition over the first 8 weeks of the subsequent lactation are shown in Table 3. There were increases in milk fat concentration, as well as yields of fat and protein in response to increased silage digestibility in the late dry period. There were no significant treatment × time interactions from the repeated measures analysis of variance, except in the case of milk protein concentration (P < 0.01). Milk protein concentration (g/kg) was higher for treatment group HH at the first recording (lactation week 2) after calving (HH: 38.9, LH: 35.5, LL: 35.9; s.e.d. = 0.93; P < 0.001), but this effect disappeared by the end of the first month after calving.
Residual effects of dry-period diets on silage intake, milk production and composition in the first 8 weeks of the subsequent lactation

DM = dry matter.
†Dry-period treatments: HH, high-digestibility grass silage fed throughout the dry period; LH, low-digestibility grass silage fed in the first part of the dry period then high-digestibility grass silage fed for the final 3 weeks before anticipated calving date; LL, low-digestibility grass silage fed throughout the dry period.
*P < 0.05; **P < 0.01; ns = non-significant.
Means in the same row with different superscripts are significantly different (P < 0.05).
The pattern of change in live weight and BCS after calving (Table 4) showed the reverse direction to that achieved before calving, with LL cows gaining condition over the first 8 weeks of lactation. There were no differences in liveweight change.
Residual effects of dry-period dietary treatments of live weight and body condition score (BCS) change between lactation week 2 and lactation week 8

†Dry-period treatments: HH, high-digestibility grass silage fed throughout the dry period; LH, low-digestibility grass silage fed in the first part of the dry period then high-digestibility grass silage fed for the final 3 weeks before anticipated calving date; LL, low-digestibility grass silage fed throughout the dry period.
*P < 0.05; ns = non-significant.
Means in the same row with different superscripts are significantly different (P < 0.05).
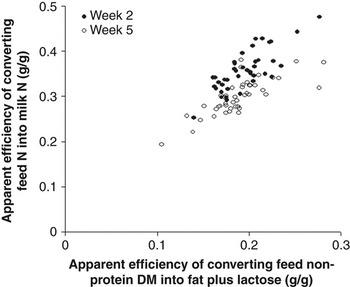
Figure 2 presents an analysis of the apparent efficiency of conversion of feed protein into milk protein, in comparison with the efficiency of conversion of the rest of the feed (non-protein) into the other organic milk constituents (fat and lactose), for individual cows. Nitrogen-use efficiency (NUE) was calculated as the ratio of milk N to N intake, averaged over the relevant week. Non-protein use efficiency was calculated as the yield of fat plus lactose divided by DM intake minus CP intake, again using weekly average values for individuals.
Comparison of the apparent efficiency of conversion of feed N into milk N (g/g) with the apparent efficiency of conversion of feed non-protein dry matter (DM) (i.e. DM − CP) into milk fat and lactose (g/g). Values are for individual cows in lactation weeks 2 and 5.

Blood metabolites
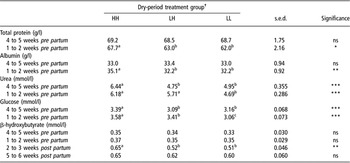
Results of blood analysis are provided in Table 5. The high-digestibility silage led to a 9% increase in plasma albumin in the period just before calving, whilst both glucose and urea were higher throughout the dry period. There were no effects of pre-partum dry-period diet on concentrations of total protein (65.0 and 66.5 g/l), albumin (33.4 and 34.7 g/l), urea (4.6 and 4.82 mmol/l) or glucose (3.11 and 3.24 mmol/l) at 2 to 3 and 5 to 6 weeks post partum, respectively. Plasma β-hydroxybutyrate was slightly increased for HH at 2 to 3 weeks after calving, but this effect was small and the highest individual value was 0.86 mmol/l, which is well below the cut-off (1.4 mmol/l) used to identify health risks (Carrier et al., Reference Carrier, Stewart, Godden, Fetrow and Papnicki2004).
Effects of dry-period dietary treatments on blood metabolites at 4 to 5 weeks and 1 to 2 weeks pre partum and (for β-hydroxybutyrate) at 2 to 3 weeks and 5 to 6 weeks post partum

†Dry-period treatments: HH, high-digestibility grass silage fed throughout the dry period; LH, low-digestibility grass silage fed in the first part of the dry period then high-digestibility grass silage fed for the final 3 weeks before anticipated calving date; LL, low-digestibility grass silage fed throughout the dry period.
*P < 0.05; **P < 0.01; ***P < 0.001; ns = non-significant.
Means in the same row with different superscripts are significantly different (P < 0.05).
Discussion
Feed intake
Cows offered the high-digestibility grass silage consumed over 14 kg DM/day in the early dry period and over 12.5 kg DM/day in the week before calving. This corresponds to an intake of 147 MJ ME/day in the week prior to calving, in comparison with 98 MJ ME/day for cows offered the low-digestibility silage. The HH cows gained 1.75 kg/day, demonstrating the strong drive to gain body reserves for cows that enter the dry period in low condition. Nonetheless, intakes were lower when the low-digestibility silage was offered.
Body reserves and calf weight
The large differences in liveweight change in the dry period showed similar patterns to differences in calf weights and in BCS changes. However, for both calf weights and BCS changes over the dry period, there were differences between LL and both the other treatments, but no difference between LH and HH. As the average duration of early and late-dry period treatments were similar (21 days), it seems most likely that this difference reflects the declining priority that dry cows place on gaining body reserves in the period just before calving (Ingvartsen et al., Reference Ingvartsen, Friggens and Faverdin1999; Dewhurst et al., Reference Dewhurst, Davies and Fisher2009).
The analysis presented in Figure 2 is helpful in identifying possible differences in the relative contribution of body reserves to synthesis of milk constituents over the first month of lactation. The observed apparent high NUE, that is, the apparent efficiency of converting feed N into milk N, in lactation week 2, was similar to an effect observed by Doreau and Remond (Reference Doreau and Remond1982) in their detailed study of nutrient utilisation over the transition period. These authors expressed the effect in terms of weekly balances for Protéines Digestibles dans l’Intestine (PDI; a metabolisable protein estimate) and Unité Fourragère Lait (UFL; feed units based on net energy for lactation), with a disproportionately lower PDI balance in the first week of lactation. These results are consistent with a transient contribution of labile body protein to milk protein output during the first 3 weeks of lactation. Using data from an earlier study, Bell et al. (Reference Bell, Burhans and Overton2000) calculated a nadir Nitrogen balance (approximately 100 g/day) at day 7 of lactation, and a return to zero balance during the 4th week of lactation. It is interesting to note that the proportionately higher contribution of body protein occurred alongside a measured higher mobilisation of body fat in the HH cows (i.e. greater loss of BCS).
Labile body protein might also explain the higher milk protein concentration for HH cows in lactation week 2 (significant treatment × time interaction), though there was no evidence of a treatment difference in the contribution of body reserves to the different milk components at this time.
The group of cows (HH) that gained more weight and condition before calving, lost more condition after calving, in agreement with earlier observations (Dewhurst et al., Reference Dewhurst, Moorby, Dhanoa, Evans and Fisher2000b). In this case, differences in liveweight change did not match condition score effects, confirming the difficulty of interpreting liveweight change in early lactation (Sutter and Beever, Reference Sutter and Beever2000). Loss of BCS was not excessive in early lactation, and plasma β-hydroxybutyrate levels were well below levels that suggest ketosis problems for all treatment groups.
The liveweight gains recorded during the dry period for cows receiving the low-digestibility silage show that these cows must have been mobilising body reserves to support calf growth, as noted previously for cows offered a grass silage/barley straw mixture (Dewhurst et al., Reference Dewhurst, Moorby, Dhanoa, Evans and Fisher2000b; Moorby et al., Reference Moorby, Dewhurst, Tweed, Dhanoa and Beck2000). Effects on calf weight suggest that it is possible to affect calf weight by widely divergent feeding levels in the early dry period, but not during the last 3 weeks before calving. This is probably related to the reduced capacity for de novo synthesis of fatty acids (Vernon et al., Reference Vernon, Robertson, Clegg and Flint1981) and reduced fat deposition in late gestation foetuses (Bell, Reference Bell1995), though it may be that 3 weeks was an insufficient period for significant differences to become evident. The combination of larger calves and fatter cows could result in increased calving difficulties with high levels of feeding in the early dry period.
Response to pre-partum energy supply
The level of feeding in the final 3 weeks before calving had a large effect on milk fat concentration in the first part of the next lactation. Milk yields were also higher, but not significantly, so there was an increased milk fat yield. This contrasts with the lack of effect on milk fat concentration when concentrates were given prior to calving in the study of Dewhurst et al. (Reference Dewhurst, Davies and Fisher2000a). It seems likely that this difference results from the fact that cows in the current study were well below their target BCS (2.16) at the start of the dry period. A related observation is the fact that pre-partum blood glucose was high for all treatment groups in the earlier study, whilst it was greatly reduced for cows that were both thin and offered a restrictive diet in the current study.
The association of responses in blood glucose with a milk fat response is consistent with the literature. Roche et al. (Reference Roche, Kolver and Kay2005) and Roche (Reference Roche2007) observed 8.5% and 9.5% increases in milk fat yield when low plasma glucose (3.1 to 3.2 mmol/l) increased in response to pre-partum diet. Douglas et al. (Reference Douglas, Overton, Bateman, Dann and Drackley2006) observed an 8.5% increase in milk fat concentration when blood glucose was increased from 3.13 to 3.65 mmol/l by pre-partum feeding. In contrast, Dann et al. (Reference Dann, Morin, Murphy, Bolero and Drackley2005) found no milk fat response when blood glucose remained low across treatments, whilst an increase from 2.97 to 3.15 mmol/l led to a 5.5% increase in milk fat yield (Dann et al., Reference Dann, Litherland, Underwood, Bionaz, D’Angelo, McFadden and Drackley2006). Dewhurst et al. (Reference Dewhurst, Moorby, Dhanoa, Evans and Fisher2000b) found no effect on milk fat yield or concentration, when blood glucose was uniformly high across all dry-period treatments (>3.8 mmol/l; Moorby et al., Reference Moorby, Dewhurst, Tweed, Dhanoa and Beck2000).
Conclusions
In contrast to our earlier study with cows entering the dry period around BCS 2.5 (Dewhurst et al., Reference Dewhurst, Davies and Fisher2000a), this study provided support for a two-stage dry-period feeding strategy with thinner cows that are moderately-yielding. The LH strategy led to production of similar levels of milk and milk constituents to the HH strategy, whilst calves were lighter than those from the HH group. Lighter calves and reduced feed costs are potential advantages of the LH strategy over HH. The high level of feeding in late gestation led to higher milk fat concentrations.
Acknowledgements
The financial support of the Department for Environment, Food and Rural Affairs, as well as the Milk Development Council is gratefully acknowledged. The authors acknowledge the skilled technical assistance for feed and blood analysis provided by the Analytical Chemistry and Ruminant Nutrition laboratories at Institute of Grassland and Environmental Research.