Introduction
Consumers are demanding clear information on the food supplied to animals, with consumer focus shifting increasingly towards ‘green’ animal products. It is therefore important to be able to discriminate between animal products obtained through different production systems, in particular pasture-feeding v. stall-feeding. The last decade has seen important developments in the use of analytical methods to authenticate pasture-feeding in herbivore products (Prache et al., Reference Prache, Cornu, Berdagué and Priolo2005 and Reference Prache, Martin, Nozière, Engel, Besle, Ferlay, Micol, Cornu, Cassar-Malek and Andueza2007). The use of carotenoid pigments, in particular, has become well established as a method for discriminating pasture-fed lambs from concentrate-fed lambs (Prache and Thériez, Reference Prache and Thériez1999; Priolo et al., Reference Priolo, Prache, Micol and Agabriel2002; Dian et al., Reference Dian, Andueza, Barbosa, Amoureux, Jestin, Carvalho, Prado and Prache2007a). However, dehydrated alfalfa is sometimes incorporated in grain-based concentrates fed to stall-raised lambs, which may affect the reliability of the pasture-feeding authentication methods based on carotenoid content in plasma and fat, due to significant residual carotenoid levels post-dehydration (Dian et al., Reference Dian, Chauveau-Duriot, Prado and Prache2007b). Although dehydrated alfalfa is actually green forage, feeding pellets of alfalfa indoors does not have the same ‘natural’ connotation in the popular sense as pasture-feeding (Dian et al., Reference Dian, Chauveau-Duriot, Prado and Prache2007b). This study was therefore undertaken to examine whether other molecular and atomic compounds, such as volatile compounds and nitrogen (N) stable isotopes, in the consumable product, can give additional information to authenticate diet and discriminate pasture-fed lambs from lambs fed alfalfa indoors.
Among the volatile compounds, terpenes form a large class of molecules almost exclusively synthesized by plants, and they are transferred from the feed to the animal tissues and products (Priolo et al., Reference Priolo, Cornu, Prache, Krogmann, Kondjoyan, Micol and Berdagué2004, in lambs; Martin et al., Reference Martin, Cornu, Kondjoyan, Ferlay, Verdier-Metz, Pradel, Rock, Chilliard, Coulon and Berdagué2005, in dairy products; Serrano et al., Reference Serrano, Cornu, Kondjoyan, Figueredo, Agabriel and Micol2007 in beef). The terpene profile of the animal product is therefore modulated by the terpene profile of the diet, which in turn varies greatly according to the botanical family of the plants forming the diet (Mariaca et al., Reference Mariaca, Berger, Gauch, Imhof, Jeangros and Bosset1997). Another volatile compound, 2,3-octanedione, which is thought to result from the action of lipoxygenase on linoleic and linolenic acids, both the enzyme and its substrates being abundant in green leafy tissue (Young et al., Reference Young, Berdagué, Viallon, Rousset-Akrim and Thériez1997), has been reported to be an excellent biomarker of pasture-feeding (Suzuki and Bailey, Reference Suzuki and Bailey1985; Young et al., Reference Young, Berdagué, Viallon, Rousset-Akrim and Thériez1997; Priolo et al., Reference Priolo, Cornu, Prache, Krogmann, Kondjoyan, Micol and Berdagué2004). Finally, stable isotope analysis has recently become a forefront method in the control of meat authenticity (Piasentier et al., Reference Piasentier, Valusso, Camin and Versini2003 in lambs; Renou et al., Reference Renou, Bielicki, Deponge, Gachon, Micol and Ritz2004; Schmidt et al., Reference Schmidt, Quilter, Bahar, Moloney, Scrimgeour, Begley and Monahan2005 in beef). Stable isotope signatures in animal products reflect the stable isotope composition of the diet as modified by the animal’s metabolism. As far as diet is concerned, the N isotope composition of plants is modulated by botanical family, with less 15N enrichment of plant nitrogen compounds in leguminous plants that use nitrogen in the air as a nitrogen source (Piasentier et al., Reference Piasentier, Valusso, Camin and Versini2003; Schmidt et al., Reference Schmidt, Quilter, Bahar, Moloney, Scrimgeour, Begley and Monahan2005). Rossmann et al. (Reference Rossmann, Kornexl, Versini, Pichlmayer and Lamprecht1998) for example reported different nitrogen stable isotope ratios between grass and alfalfa (δ15N values of 3.2‰ and 1.5‰, respectively). It was thus hypothesized that lambs fed dehydrated alfalfa would provide meat with lower relative 15N abundance and lower terpene diversity and amounts than lambs grazing a permanent pasture.
This prompted the present study, which aimed to evaluate the effectiveness of using carotenoid pigments in plasma and fat, volatile compounds in fat and N isotopes composition in lamb meat to discriminate lambs that had grazed a permanent pasture from lambs that had been stall-fed high levels of dehydrated alfalfa.
Material and methods
This study was carried out at the Clermont-Ferrand/Theix INRA experimental farm in France. The animals were handled by specialized personnel who managed animal welfare in line with European Union Directive No. 609/1986.
Experimental design, animals and diets
Two feeding treatments were compared: pasture-feeding (P) v. stall-feeding with dehydrated alfalfa (A). Each treatment group comprised seven male weaned Romanov × Berrichon lambs that were born on 12 March on average (from 9 to 14 March). Fourteen lambs were classified into seven blocks according to birth weight and average daily gain (ADG) between birth and April 10. They were then randomized from within blocks to receive one of the two treatments. Mean lamb birth weight was 4.1 kg (s.d. 0.64) and ADG between birth and 10 April was 302 g/day (s.d. 52). Lambs were progressively weaned from 17 May to 24 May.
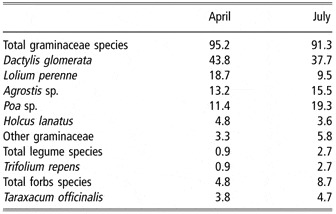
P-group lambs were pasture-fed from April 25 until slaughter, which occurred between 29 July and 12 August. They grazed, without any supplementation, a permanent pasture of mainly graminaceae that were maintained at a leafy green vegetative stage. The botanical composition of the pasture (Table 1) was assessed visually in April and July according to the method described by Daget and Poissonnet (Reference Daget and Poissonnet1971). The presence and specific volume of each species were recorded at 360 points located on 72 transects located in representative areas of paddock vegetation, with five points set 4.0 m apart on each transect. For each point, an abundance score was given for each species present so that the sum of all scores at each point equaled 6. The proportion of each species in relation to total biomass was then calculated as the ratio of the sum of the scores for each species divided by the sum of all scores. The pasture received no fertilization.
Botanical composition of the pasture grazed by pasture-fed lambs in April and July (% of total biomass)

A-group lambs were penned individually indoors and fed dehydrated alfalfa and oat straw from the end of weaning (24 May) until slaughter, which occurred between 29 July and 12 August. Straw was supplied ad libitum to this group to induce sufficient rumination and to avoid the risk of acidosis, as dehydrated alfalfa was ground and fed in pellets. The level of dehydrated alfalfa fed to each A-group lamb was adjusted weekly to achieve an ADG similar to that of the corresponding P-group lamb in the same block. The straw and dehydrated alfalfa were offered each morning. Feed tubs were emptied every morning, and feed refusals were weighed, recorded and discarded daily.
Samples of offered alfalfa and straw were collected twice weekly for analysis of dry matter (DM), carotenoid content and N stable isotopes ratio. Snip samples of grazed pasture were taken at ground level using scissors before the grazing of the new paddock, on 17 May, 24 June and 12 July. These samples served to measure organic matter digestibility (OMD) using the pepsin-cellulase method (Aufrère and Michalet-Doreau, Reference Aufrère and Michalet-Doreau1983), carotenoid content and N stable isotopes ratio. At each sampling session, 40 herbage samples were plucked and bulked. They were stored at −20 °C and then freeze-dried. Samples of alfalfa, straw and pasture herbage were then milled through a 0.85-mm mesh.
Water and salt blocks were kept available in both feeding treatments. The salt blocks contained (g/kg, as-fed) 60 Ca, 20 P, 10 Mg, 280 Na, 17.5 Zn, 1.5 Fe, 5.5 Mn, 0.03 Co, 0.03 I and 0.01 Se.
Lambs were slaughtered when they had reached a target condition score of 3 (on a scale of 0–5), which was manually assessed by skilled technicians according to the method described by Russel et al. (Reference Russel, Doney and Gunn1969). Age and liveweight at slaughter averaged 140 (s.d. 4.8) days and 35.8 (s.d. 3.2) kg, respectively. Lambs were slaughtered in the morning. They were transported by truck to the slaughterhouse, which was located within 2 km of the stall and the pasture, and slaughtered by throat-cut immediately after their arrival. The carcasses were placed in a dark refrigerated room at 4°C until 24 h post mortem.
Measurements
Carotenoid concentration in the feed
Carotenoids contained in alfalfa, straw and pasture were extracted using the procedure described by Cardinault et al. (Reference Cardinault, Doreau, Poncet and Nozière2006). Lipophilic components of 50 mg of ground-lyophilized food were first extracted with acetone and then purified with diethyl ether containing echinenone as internal standard. After saponification and cleaning with water, the carotenoids were extracted with diethyl ether and then analyzed by HPLC as described by Lyan et al. (Reference Lyan, Azais-Braesco, Cardinault, Tyssandier, Borel, Alexandre-Gouabau and Grolier2001). The HPLC apparatus consisted of a Waters Alliance 2996 HPLC system with a photodiode array detector monitoring at 280–600 nm. Carotenoids were separated on a 150 × 4.6 mm, RP C18, 3 μm Nucleosil column coupled with a 250 × 4.6 mm, RP C18 5 μm Vydac TP 54 column (Interchim, Montluçon, France). Instrument control, data acquisition and data processing were run on Millennium 32 software from Waters SA (Saint-Quentin-en-Yvelines, France). Carotenoids detection wavelength was 450 nm, and the compounds were identified by comparing retention times and spectral analyses with those of pure standards [>95% of zeaxanthin, echinone, 9-cis-β-carotene and 13-cis-β-carotene (Carotenature GmbH, Lupsingen, Switzerland), and all-trans-β-carotene and lutein (Sigma Chemical Co., St Louis, MO, USA)]. Concentrations of each compound were calculated using external standard curves and then adjusted by percent recovery of the added internal standard. Two replicates were run for each analysis.
Plasma carotenoid concentration
Plasma carotenoid concentration was measured at slaughter. Morning blood samples were taken from the jugular vein of each lamb (using heparin as anti-coagulant) and the plasma was stored at −20°C until required for assay. Extraction of carotenoids from plasma was performed within 3 months after sampling.
Crude estimation of total carotenoids was obtained via a spectrophotometric procedure using the following method. Protein from 3 ml of plasma diluted with 2 ml of distilled water was precipitated with 4 ml of ethanol. Carotenoids were then extracted with 4 ml of hexane. Absorption of the upper layer obtained after centrifugation at 5000 × g for 5 min was measured between 600 and 400 nm using a Kontron Uvikon 860 spectrophotometer (Kontron Instruments S.A., Montigny-le-Bretonneux, France). The total carotenoid concentration was calculated from absorption maxima (Karijord, Reference Karijord1978), assuming a value of 2500 for the E1% extinction coefficient (Patterson, Reference Patterson1965; Karijord, Reference Karijord1978) and allowing for the dilution of the original sample. Throughout the experimental and analytical procedure, care was taken to protect samples from natural light (i.e. samples and test tubes were wrapped in aluminum foil to keep light out and extraction was performed under dim artificial light).
Visible reflectance spectrum of perirenal and subcutaneous caudal fat
We measured the reflectance spectrum of perirenal and subcutaneous caudal fat at wavelengths between 400 and 700 nm at 24 h post mortem, using a MINOLTA CM-2002 spectrophotometer (D65 illuminant, observer angle 10°). The instrument was equipped with a protective glass visor to protect the eye of the apparatus from the fat sample. This spectrophotometer measures the proportion of light reflected at 10-nm intervals at wavelengths of between 400 and 700 nm, and records the corresponding reflectance spectrum. For measurements made on perirenal fat, a flat surface was obtained with a knife to allow the fat to adhere perfectly to the eye of the apparatus. Five measurements were taken for each fat deposit site.
The fat reflectance spectrum data at wavelengths between 450 and 510 nm were used to calculate an index quantifying light absorption by carotenoid pigments in the fat. This index was measured by translating the reflectance spectrum to make the reflectance value at 510 nm equal to zero (TR), and the integral value (I 450–510) on the translated spectrum was calculated as follows:

The integral value was averaged over the five measurements. Since the mean integral values were all negative, we shall hereafter use the absolute value of the mean integral (AVMI).
N isotopes ratio mass spectrometry
A sample of the left longissimus dorsi muscle was taken from the last thoracic rib 24 h post mortem, vacuum-packed and frozen at −20°C. It was then freeze-dried and milled using a CYCLOTEC grinder with an outlet grid of 200 μm.
N stable isotopes ratio analyses of meat and feed samples were carried out as follows. The sample powder was first homogenized, and then an aliquot of about 4 mg was weighed in a tin capsule. This capsule was analyzed using a EURO EA elemental analyzer (Eurovector, Milan, Italy) connected to a delta PLUS advantage isotope ratio mass spectrometer (Thermo-Fisher, Bremen, Germany). The sample was fully oxidized. N was converted into N2 and C into CO2. The two gases were separated on a Porapack-QS column and introduced into the mass spectrometer. After ionization, electrical field acceleration and magnetic field deviation steps, the ions were detected using Faraday cups, and the 15N/14N isotopes ratio was calculated. Hereafter, 15N/14N isotopes ratio is expressed using the δ15N value, calculated as follows:

Analysis of fat volatile compounds
About 40 g of perirenal fat was taken immediately after slaughter, wrapped in aluminum foil, vacuum-packed and stored at −20°C. The analyses were performed on five randomly chosen blocks of lambs. A subsample of 0.15 g adipose tissue was taken from the interior of each sample and placed in a 35 ml glass extractor. Volatile compounds were extracted by dynamic headspace using a Tekmar LSC 2000 (Tekmar Company, Mason, OH, USA) under the following conditions: prepurge 5 min, pre-heat 25 min at 110°C; purge 60 min at 110°C with a helium flow of 95 ml/min, trap on Tenax at 35°C. Dry purge 5 min at 35°C, desorb pre-heat 175°C; desorb 5 min at 180°C, cool-down at −150°C in the column head. Injection, 2 min at 250°C.
Volatile compounds were separated by gas chromatography on a Hewlett-Packard 5890 apparatus (Agilent Technologies, Massy, France) with a Supelco (Sigma Aldrich Chimie SARL, St Quentin Fallavier, France) SPB5 capillary column (length: 60 m; internal diameter: 0.32 mm; phase thickness: 1 μm) using helium as carrier gas (1 ml/min). The temperature program was set as follows: 40°C for 5 min, then increasing at 3°C/min up to 230°C (2 min).
Compounds were detected using a Hewlett-Packard 5971 A electron impact mass spectrometer. Identifications were proposed based on a comparison of the experimental mass spectra with those contained in the NIST/EPA/MSDC mass spectral database, 1996 (National Institute of Standards and Technology, Gaithersburg, MD, USA). The retention indices were compared with those compiled by Kondjoyan and Berdagué (Reference Kondjoyan and Berdagué1996). Integrations were run on Chemstation software (Hewlett-Packard). Terpene peak integrations were performed on the specific terpene ions (93 and 136 for monoterpenes; 93, 136, 161 and 204 for sesquiterpenes).
Data analysis
Plasma carotenoid concentration, AVMI and the δ15N value of the meat were subjected to ANOVA using the GLM procedure of the SAS software package (Statistical Analysis Systems Institute, 1999) to examine feeding treatment effect. Variance of the data was stabilized beforehand using logarithmic transformation where necessary. Fat volatile compounds were subjected to non-parametric statistical methods (Mann–Whitney test), as some of these compounds were not detected in some lambs.
We performed a factorial discriminant analysis in order to classify the samples according to feeding treatments. Prior to conducting the discriminant analysis, a stepwise selection procedure was conducted to identify which variables can be useful for discriminating between feeding treatments. Analyses were performed using the STEPDISC and CANDISC procedures of SAS software package (1999).
Results
For P-group lambs, the duration of the grazing period averaged 87 days (s.d. 4.81), ranging from 85 to 98 days. The OMD of the pasture was 0.77, 0.70 and 0.68 on 17 May, 24 June and 12 July, respectively. The carotenoid content of the pasture was 727, 445 and 272 μg/g DM in mid-May, mid-June and mid-July, respectively, with lutein being the predominant carotenoid (54–61% of total carotenoids) (Table 2).
Carotenoid concentration (μg/g DM) of the feed offered

DM = dry matter.
1Not detected.
For A-group lambs, mean daily intake of dehydrated alfalfa was 671 g/day (622 g DM/day). The carotenoid concentration in alfalfa was 247 μg/g DM, with lutein being the predominant carotenoid (61% of total carotenoids) (Table 2).
Plasma carotenoid concentration and fat reflectance spectrum characteristics
Plasma carotenoid concentration at slaughter was not significantly different between P- and A-group lambs (Table 3). AVMI was not significantly different between P- and A-group lambs, regardless of whether the measurement was made on perirenal or subcutaneous caudal fat (Table 3).
Plasma carotenoid concentration and AVMIFootnote 1 of perirenal and subcutaneous caudal fat at 24 h post mortem

1 AVMI = absolute value of the mean integral of the translated spectrum between 450 and 510 nm (arbitrary area units).
δ15N value of feed and meat
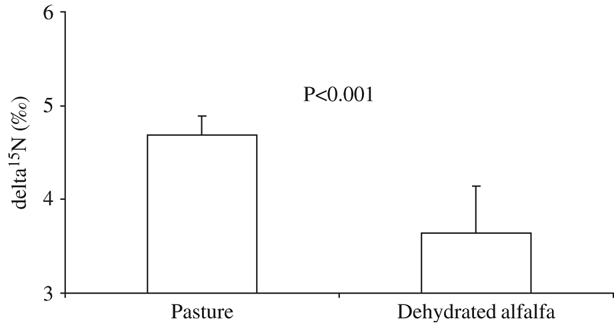
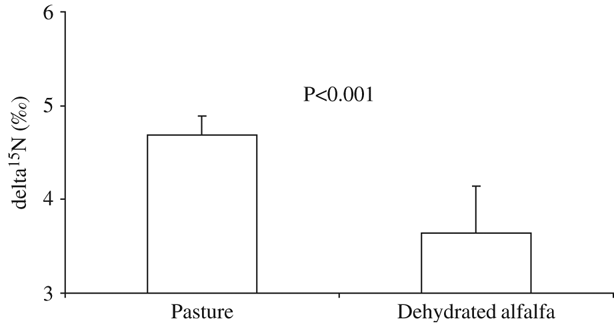
The δ15N value of the feed was 0.6‰ for dehydrated alfalfa, compared to 3.6‰, 1.5‰ and 1.8‰ for the pasture herbage sampled on 17 May, 24 June and 12 July, respectively. The δ15N value of the meat was significantly lower (P < 0.001) in A-group lambs than in P-group lambs (Figure 1). The δ15N value of the meat averaged 3.6‰ (3.0‰ to 4.1‰) for A-group lambs, whereas it averaged 4.7‰ (4.5‰ to 5.0‰) for P-group lambs.
δ15N values (mean and standard deviation) of the meat from pasture-fed lambs and lambs fed dehydrated alfalfa.
Fat volatile compounds
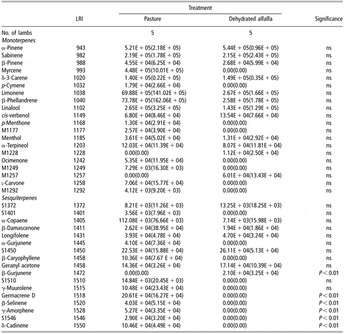
Table 4 lists the monoterpenes and sesquiterpenes detected in the perirenal fat. There were globally higher amounts and a wider diversity of terpenes in the fat of P-group lambs than that of A-group lambs. Eighteen and 12 monoterpenes and 17 and seven sesquiterpenes were detected in the fat of P- and A-group lambs, respectively. Fifteen of the total 20 monoterpenes detected were identified, and none of them presented significant between-treatment differences. Twelve of the total 17 sesquiterpenes detected were identified, and six of them were significantly affected by the feeding treatment. δ-cadinene and germacrene D were not detected in any of the five A-group lambs but were found in all the P-group lambs. β-selinene, γ-amorphene and S1546 were not detected in any of the five A-group lambs but were found in 3, 4 and 3 of the five P-group lambs, respectively. β-gurjunene showed the opposite pattern, i.e. it was not detected in any of the five P-group lambs but was found in two of the five A-group lambs.
Monoterpenes and sesquiterpenes desorbed from lamb perirenal fat: meanFootnote 1 (standard deviation)

LRI =linear retention indices.
1 Arbitrary area units.
2,3-octanedione was detected in all 10 lambs (both groups). The mean 2,3-octanedione concentration was two-fold higher in P-group lambs than in A-group lambs (P < 0.05, Table 5), but there was some overlap in the distribution of values between the two feeding treatments. Skatole (3-methylindole) was detected in eight of the 10 lambs (four lambs in each treatment); its concentration was not significantly different between the two feeding treatments (Table 5).
Skatole and 2,3-octanedione desorbed from lamb perirenal fat: meanFootnote 1 (standard deviation)

1 Arbitrary area units.
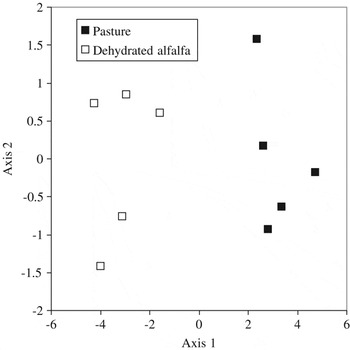
Three variables (δ-cadinene in perirenal fat, plasma carotenoid concentration and δ15N value of the meat) were selected from the stepwise selection procedure. The factorial discriminant analysis performed using these three variables made it possible to correctly classify 100% of the samples (Figure 2).
Factorial discriminant analysis of three compounds (δ-cadinene in perirenal fat, δ15N value of the meat and plasma carotenoid concentration) that discriminate pasture-fed lambs from lambs fed dehydrated alfalfa indoors.

Discussion
This study confirmed that high levels of dehydrated alfalfa included in the diet of stall-fed lambs may affect the reliability of the pasture-feeding authentication method based on plasma and fat carotenoid concentration, as previously observed by Dian et al. (Reference Dian, Chauveau-Duriot, Prado and Prache2007b), but it also clearly demonstrated the ability of N isotope composition in meat and terpenes profiles in perirenal fat to separate A- and P-group lambs.
The carotenoid concentration in dehydrated alfalfa in this study was close to that measured in the study by Dian et al. (Reference Dian, Chauveau-Duriot, Prado and Prache2007b). For A-group lambs, mean daily intake of dehydrated alfalfa was 671 g/day, while the AVMI was 227 and 290 for subcutaneous caudal and perirenal fat, respectively. These results are in line with the AVMI observed by Dian et al. (Reference Dian, Chauveau-Duriot, Prado and Prache2007b) for a mean daily intake of dehydrated alfalfa ranging between 500 and 750 g/day.
In the present study, the carotenoid content of the pasture was high in mid-May but lower in mid-June and mid-July. The concentration observed in mid-May was close to that observed by Prache et al. (Reference Prache, Priolo and Grolier2003a) at the same experimental site (726 and 697 μg/g DM, respectively), but 37–39% lower in mid-June and mid-July. Following a similar pattern, plasma carotenoid concentration and AVMI of the fat in pasture-fed lambs were 8% and 15% lower than those reported by Dian et al. (Reference Dian, Chauveau-Duriot, Prado and Prache2007b) for pasture-fed lambs of the same breed. The feeding conditions at pasture were therefore probably less favorable to carotenoid intake in this study than in our previous studies.
There was no overlap in the distribution of meat δ15N values between the two feeding treatments. This between-treatment difference was due to the different relative abundances of stable nitrogen isotopes between pasture and alfalfa. Plant N isotopes composition is actually partly affected by botanical family, with less 15N enrichment of plant nitrogen compounds in leguminous plants, which use nitrogen from air as a nitrogen source (Piasentier et al., Reference Piasentier, Valusso, Camin and Versini2003; Schmidt et al., Reference Schmidt, Quilter, Bahar, Moloney, Scrimgeour, Begley and Monahan2005). There were actually large differences in the proportions of legumes in the diets offered in this study, since the A-group diet was alfalfa-based whereas the P-group lambs grazed a pasture where legume species only represented 0.9% to 2.7% of total biomass.
There were large differences in the fat sesquiterpene profiles between pasture-fed lambs and dehydrated alfalfa-fed lambs. The broader diversity (35 and 19 terpenes in P- and A-group lambs, respectively) and generally higher amounts of terpenes observed in P-group lamb fat than in A-group lamb fat probably reflected differences in the diversity and amounts of terpenes in the corresponding diets. Two sesquiterpenes in particular, δ-cadinene and germacrene D, were not detected in any of the five A-group lambs but were found in all the P-group lambs. β-caryophyllene was not detected in any of the A-group lambs, but since it could also not be detected in one of the five P-group lambs, we are unable to decisively confirm the results from Priolo et al. (Reference Priolo, Cornu, Prache, Krogmann, Kondjoyan, Micol and Berdagué2004), who suggested that β-caryophyllene could be a good biomarker of pasture-feeding.
There were also significant between-treatment differences in the raw 2,3-octanedione values in perirenal fat, which were two-fold higher in pasture-fed lambs than in lambs fed dehydrated alfalfa indoors. This difference was, however, much lower than in Priolo et al. (Reference Priolo, Cornu, Prache, Krogmann, Kondjoyan, Micol and Berdagué2004) comparing pasture-fed lambs to lambs fed concentrate and hay indoors, and we cannot decisively confirm their claim that the volatile compound 2,3-octanedione is an excellent biomarker of pasture-feeding, since there was still some overlap in value distribution between the two feeding treatments.
A factorial discriminant analysis using δ-cadinene in perirenal fat, plasma carotenoid concentration at slaughter and δ15N value of the meat enabled one to perfectly separate pasture-fed lambs from lambs fed high levels of dehydrated alfalfa indoors. This confirms that the combined use of different compounds measured in different animal tissues may be of interest for diet authentication purposes, as already demonstrated by previous studies (Prache et al., Reference Prache, Priolo and Grolier2003b). However, questions remain as to whether using grazed fresh alfalfa to fatten lambs may induce similar meat N isotopes composition and fat sesquiterpene profiles compared with lambs fed high levels of dehydrated alfalfa indoors. Terpene volatilization during the dehydration process and during storage has been reported by Cornu et al. (Reference Cornu, Kondjoyan, Martin, Ferlay, Pradel, Coulon and Berdagué2002) and Martin et al. (Reference Martin, Cornu, Kondjoyan, Ferlay, Verdier-Metz, Pradel, Rock, Chilliard, Coulon and Berdagué2005), leading to lower terpene concentrations in forage and in milk. This indicates that although the N isotopes composition in the meat may be similar in lambs fed fresh or dehydrated alfalfa, terpene concentrations may be lower in lambs fed dehydrated alfalfa than fresh alfalfa. This however requires further experimental evaluation.
Conclusions
We demonstrated that the sesquiterpene profile in perirenal fat and N isotopes composition in the meat can give relevant information to discriminate pasture-fed lambs from lambs fed high levels of dehydrated alfalfa indoors. A discriminant analysis performed using three compounds in different animal tissues (one sesquiterpene in perirenal fat, N isotopes composition of the meat and plasma carotenoid concentration) clearly separated pasture-fed lambs from lambs fed high levels of alfalfa indoors.
Acknowledgements
We thank M. Bernard, S. Amoureux, R. Jailler, J. Pourrat and all the staff at the INRA Theix experimental farm and abattoir for their assistance.