


San Sebastián del Monte Mixtec (SSM) (ISO:mks), also known as Tò’on Ndà’vi, is a language of the Mixtecan family, Otomanguean stock (Rensch Reference Rensch1976). The Mixtecan language family consists of Mixtec, Cuicatec and Trique, though Mixtec and Cuicatec are part of the same subgroup, also called Mixtecan (Josserand Reference Josserand1983: 99–101). SSM is part of the Mixteca Baja region of Oaxaca (Josserand Reference Josserand1983: 107). San Sebastián del Monte is a town in the Santo Domingo Tonalá municipality of Oaxaca State, Mexico, in the district of Huajuapan de León, 45 km southwest of Huajuapan de León (see Figure 1), with a population of approximately 2000 people (latitude: 17.677778, longitude: −98.021944).
San Sebastián del Monte (right) as located within Mexico (left). Figure made with ggmaps (Kahle & Wickham Reference Kahle and Wickham2013).

Aside from very few elderly speakers who are monolingual, the majority of the people between the age of 19 years and 80 years are bilingual Mixtec and Spanish speakers. Recently, younger generations (below the age of 19 years) are mostly monolingual Spanish speakers. However, in the town, there is an ongoing effort to revitalize the language, teach it to the younger members of the community, and to use it in activities like Taekwondo by the Ti Ndávi Ná Nisisa – Guerreros Mixteco. Many members of the community who live in California, Washington, Oregon and other US states are trilingual Mixtec/Spanish/English or bilingual Spanish/English or Spanish/Mixtec. In San Sebastín del Monte, Mixtec is the language used at home and in common interactions in the town, as well as in the city hall (agencia). However, the official educational language is Spanish. All the recordings come from community members living currently in Oaxaca.
The orthography has been in development in consultation with the members of the town of San Sebastián del Monte since 2019 and is still under development, mostly based on the official Mixtec orthography by the Academia de la Lengua Mixteca (Instituto Nacional de Lenguas Indígenas 2022).
There is extensive work done on the phonetics and phonology of Mixtec languages in general (Pike Reference Pike1944, Reference Pike1948; Bradley & Hollenbach Reference Henry and Hollenbach1988, Reference Henry and Hollenbach1990, Reference Henry and Hollenbach1991, Reference Henry and Hollenbach1992; Macaulay Reference Macaulay1996; Paster & Beam de Azcona Reference Paster and Beam de Azcona2004; Daly & Hyman Reference Daly and Hyman2007; Hollenbach Reference Hollenbach2015; Campbell Reference Campbell2016; Palancar Reference Palancar2016; León Vázquez Reference León Vázquez2017; DiCanio, Benn & García Reference DiCanio, Benn and Castillo García2018; Peters Reference Peters2018; Mendoza Reference Mendoza2020; DiCanio & Bennett Reference DiCanio and Bennett2021; Eischens Reference Eischens2021; Penner Reference Penner2019 among others); however, each language is distinct from the others in multiple characteristics. Similarly to other Mixtec languages, SSM has VSO word order in a neutral context, a set of independent pronouns and a set of clitic pronouns, and compounds are very frequent.
We recorded our speech samples from seven speakers (four men and three women), ranging in age from 38 to 85 years old. Recordings were made using a Tascan DR-05 recorder, with recordings digitized at a sampling rate of 44.1 kHz and 32 bits.
Consonants
The SSM consonantal inventory consists of 21 contrastive sounds. All transcriptions are broad phonemic transcriptions. Note that although we indicate prenasalization with superscript nasals, that is not official International Phonetic Alphabet (IPA) use, but we use it for simplicity following Keating, Wymark & Sharif (Reference Keating, Wymark and Sharif2019).

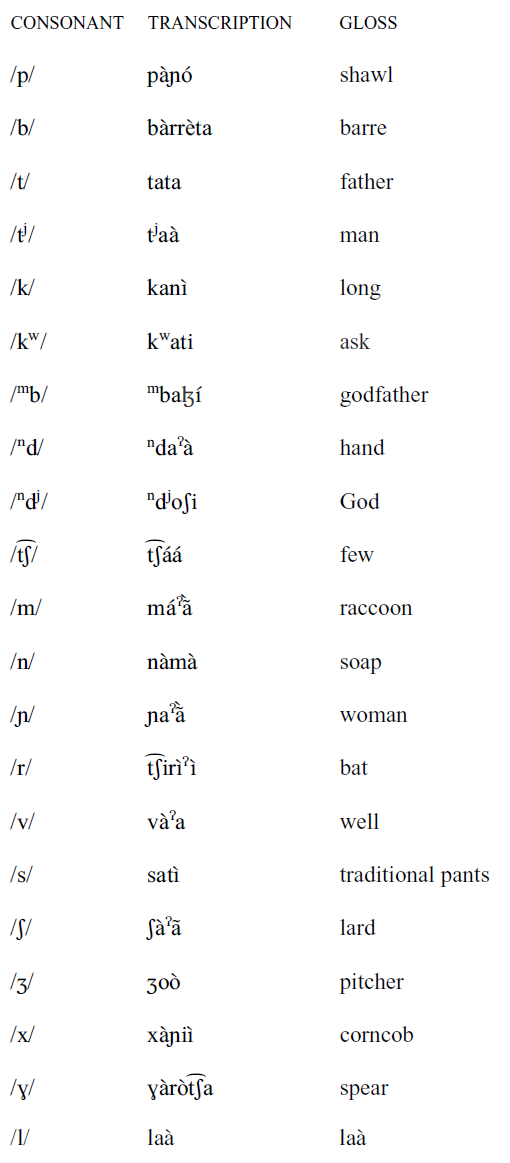
The sound /p/ is used in the language infrequently, though not limited to only borrowed words as (1) shows.

The phoneme /k/ at times surfaces intervocalically as [ɡ], often limited to the morpheme ka. In some cases, such as in (2), it is produced as the allophone [k], but in others, as in (3), it is produced as the allophone [ɡ].Footnote 1

As Mantenuto (Reference Mantenuto2020) has pointed out, the intervocalic voicing of /k/ in the morpheme ka is related to language change, thus the [k]–[ɡ] alternation is a developing feature of the language, and indeed it is more common in younger speakers than in older speakers, though older speakers also present the variation, as (3) and all the occurrences in the recorded passage at the end of this paper show.
We consider /kw/, /tj/ and /ndj/, as in (4)–(6) to be contrastive sounds in the language because of the restricted occurrence of the glides only following specific sounds /k/ (for /w/), /t/ and /nd/ (for /j/).
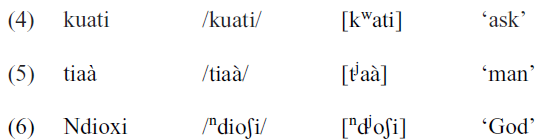
Assuming the glides to be underlyingly present in the language would result in non-valid syllable construction CCV.
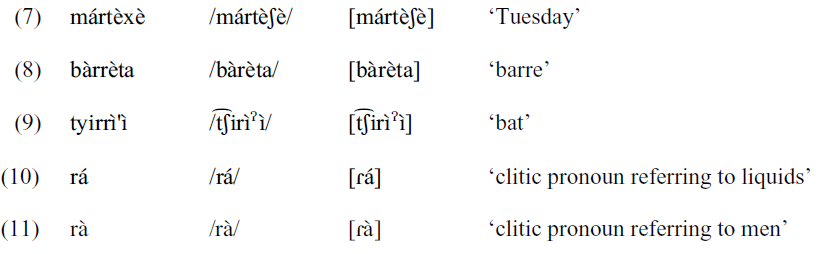
The sounds [r] and [ɾ] are very infrequently used in the language, and they are not in contrast. [r] seems to be more common, as in (7)–(9), while [ɾ] seems to be less so, as it is restricted to only the clitic pronouns (10)–(11), even when in isolation and not occurring intervocalically.
The sounds /b/, /mb/, /ɣ/ only marginally occur in the language, and they are often limited to borrowed words from Spanish, as in (12)–(14).

A spectrogram of the sound /mb/ is included in the section ‘Voicing in stops’.
We included both /b/ and /v/ in the language inventory because they are both present and in contrast, to the best of our knowledge, /b/ is used for Spanish borrowings, as in (15), and /v/ is used in non-Spanish borrowings, as in (16)–(17).

Phonetic realizations of [β] can be found as allophones of /v/ when occurring between two vowels, as the pair of words in (18) and (19) shows.

/v/ is produced as [v] when at the beginning of a word, as in (18), while it surfaces as [β] when occurring intervocalically, as in (19).
/ⁿd/ is at times produced as [ⁿt] by some speakers; however, we assume /ⁿd/ to be the underlying and most common form due to its frequency and the results of a more detailed phonetic analysis reported in the section ‘Voicing in stops’.
We are aware of two allophones for the sound /ʒ/, namely [ʒ] and [ʝ]. The distribution of these allophones is beyond the purpose of this Illustration, but an example of [ʝ] is in (20) and (21), which seems to indicate that /ʒ/ surfaces more commonly as [ʝ] in intervocalic environments, counter to word initial /ʒ/ as in (22).

Two allophones are also available for /l/: at the beginning of the word, /l/ is produced as [l], as seen in (23), but intervocalically, /l/ surfaces as its fricative counterpart [ɮ], as in (24).

Voicing in stops
We quantified stop voicing with two measures. For voiceless stops, we measured voice onset time (VOT). For pre-nasalized voiced stops, we measured the proportion of stop closure duration which was voiced. Voice onset time was measured from the release burst of a stop until periodic fluctuations were evident in the waveform, taking the zero crossing point of the first period of visible voicing in the waveform as the end of VOT. The proportion of voicing during stop voicing was calculated by looking at the interval which encompassed the oral stop closure and computing the proportion of the interval which was voiced. This interval was almost always voiced, though voicing could be weak and low in amplitude. In some rare cases the stop closure become voiceless shortly before the stop release. After presenting an overview of stop voicing, we present data from a larger corpus of data for three of the stops in question: /t k ⁿd/.
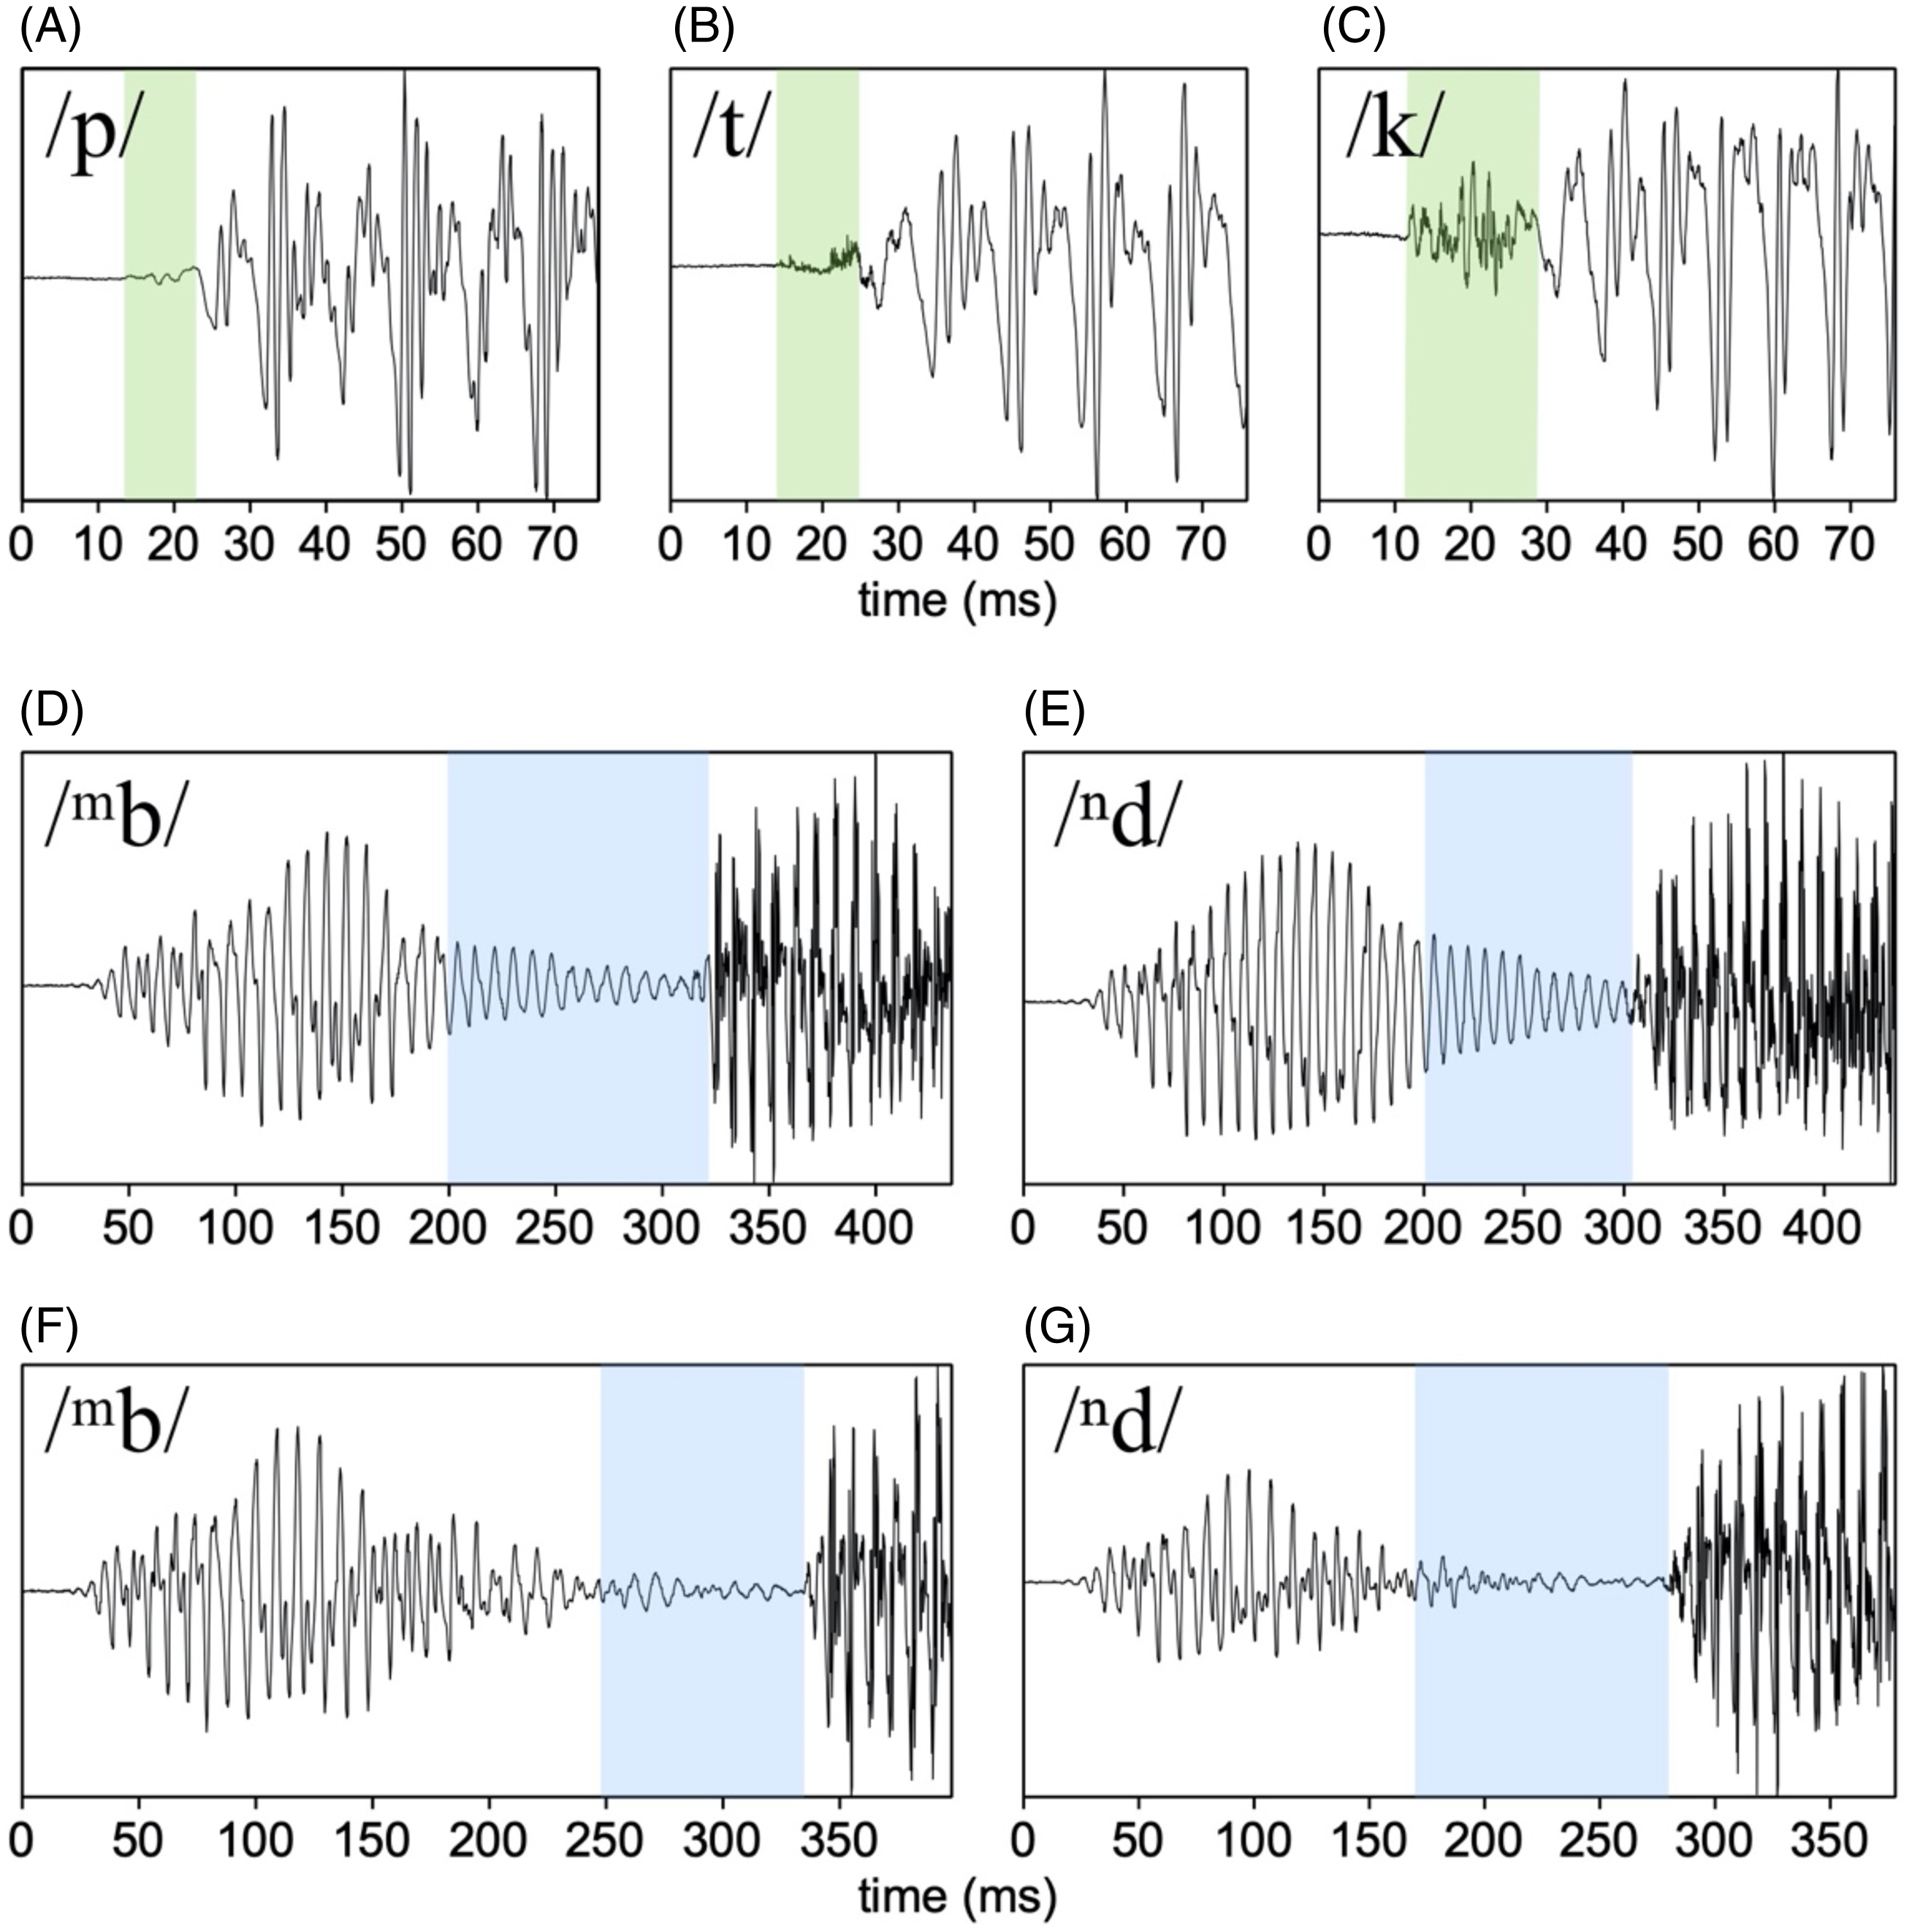
Voiceless stops /p t k/ show VOT values which are typical of short-lag, or voiceless unaspirated stops. This is shown in Figures 1A, 1B and 1C. Each place of articulation exhibits a short burst interval, which also varies in burst amplitude by place. The release burst for /p/ is quieter than /t/, which is quieter than /k/ in the examples shown. Also evident in the examples, /k/ has the longest VOT, which is further confirmed in a larger corpus of data presented below. Panels D and E in Figure 2 show voiced stops with robust voicing during closure, which seems to be the canonical way in which these stops are produced. We note however, that in some productions voicing during closure was low amplitude and weaker, as exemplified in panels F and G.
Example waveforms of stops, showing VOT (Panels A–C) and closure voicing (panels D–G); with the stop in question in the top left of each panel. All tokens are produced by the same speaker (author FC). In panels A–C, the interval corresponding to measured VOT is highlighted. In Panels D–G, blue highlighting shows the interval of oral stop closure, which is more strongly voiced in panel D and E, and less strongly voiced in panel F and G. All examples here are from the word list following the consonant table above, and are in the sound files included with the paper.
We carried out a controlled elicitation to characterize consonants and vowels in SSM. This elicitation was originally designed to elicit a variety of vowels and tones, and to compare CVV and CV͡ˀV shapes (each of which is described in detail in subsequent sections). This list also contained stops /t k ⁿd/, allowing us to quantify voice onset time and closure voicing for these stops specifically with a larger corpus.
In the corpus (which we draw on throughout the paper) seven speakers of SSM (three female, four male) were recorded. Each speaker was recorded using a Tascan DR-05, in a quiet room in a house in the town of San Sebastián del Monte, Oaxaca, Mexico. The word list which was recorded consisted of words varying both in vowel and tone, some of which also contained rearticulated vowels (described below). All words were of CVV or CV͡ˀV shape, where the latter represent rearticulation. The words were spoken in the following carrier sentence.

In total, we recorded 30 words, which were each presented six times, in a pseudo-randomized list to each speaker. Data analysis and visualization were implemented using the ggplot2 package in R (Wickham Reference Wickham2016, R Core Team 2020). The words used to assess VOT and voicing in closure for /t k ⁿd/ were selected to be matched in the following vowel across stops. We analyzed three words per voiceless stop, and two words for /ⁿd/ (we had more /k/ initial words which we chose not to analyze here to have an equal sample of /t/ versus /k/). We measured VOT for  . We measured VOT for /k/ from /ki͡ˀi/ ‘to wear shoes’, /koo/ ‘to sit’ and /kuu/ ‘to be’. We measured the proportion of voicing in /nd/ from /ndìi/ ‘deceased’, and
 ‘ours (exclusive)’. The seven speakers each produced six repetitions of each word as described above, yielding 18 (6 × 3) tokens per speaker for both /t/ and /k/, and 12 per speaker for /nd/. The wordlist was originally designed for the examination of tone and vowel quality, and so lacked suitable items for /p/ and /ᵐb/. As such, both labial stops are excluded from this analysis. The VOT measures are shown in Figure 3.
VOT measures from the corpus for two stops (panel A), and the same measures split by individual speaker (panel B). Error bars in panel A represent one standard deviation. Panel C shows the proportion of voicing during closure for one stop /ⁿd/, with data split by speaker in panel D. In all plots smaller points are individual measurements, and larger points are means.
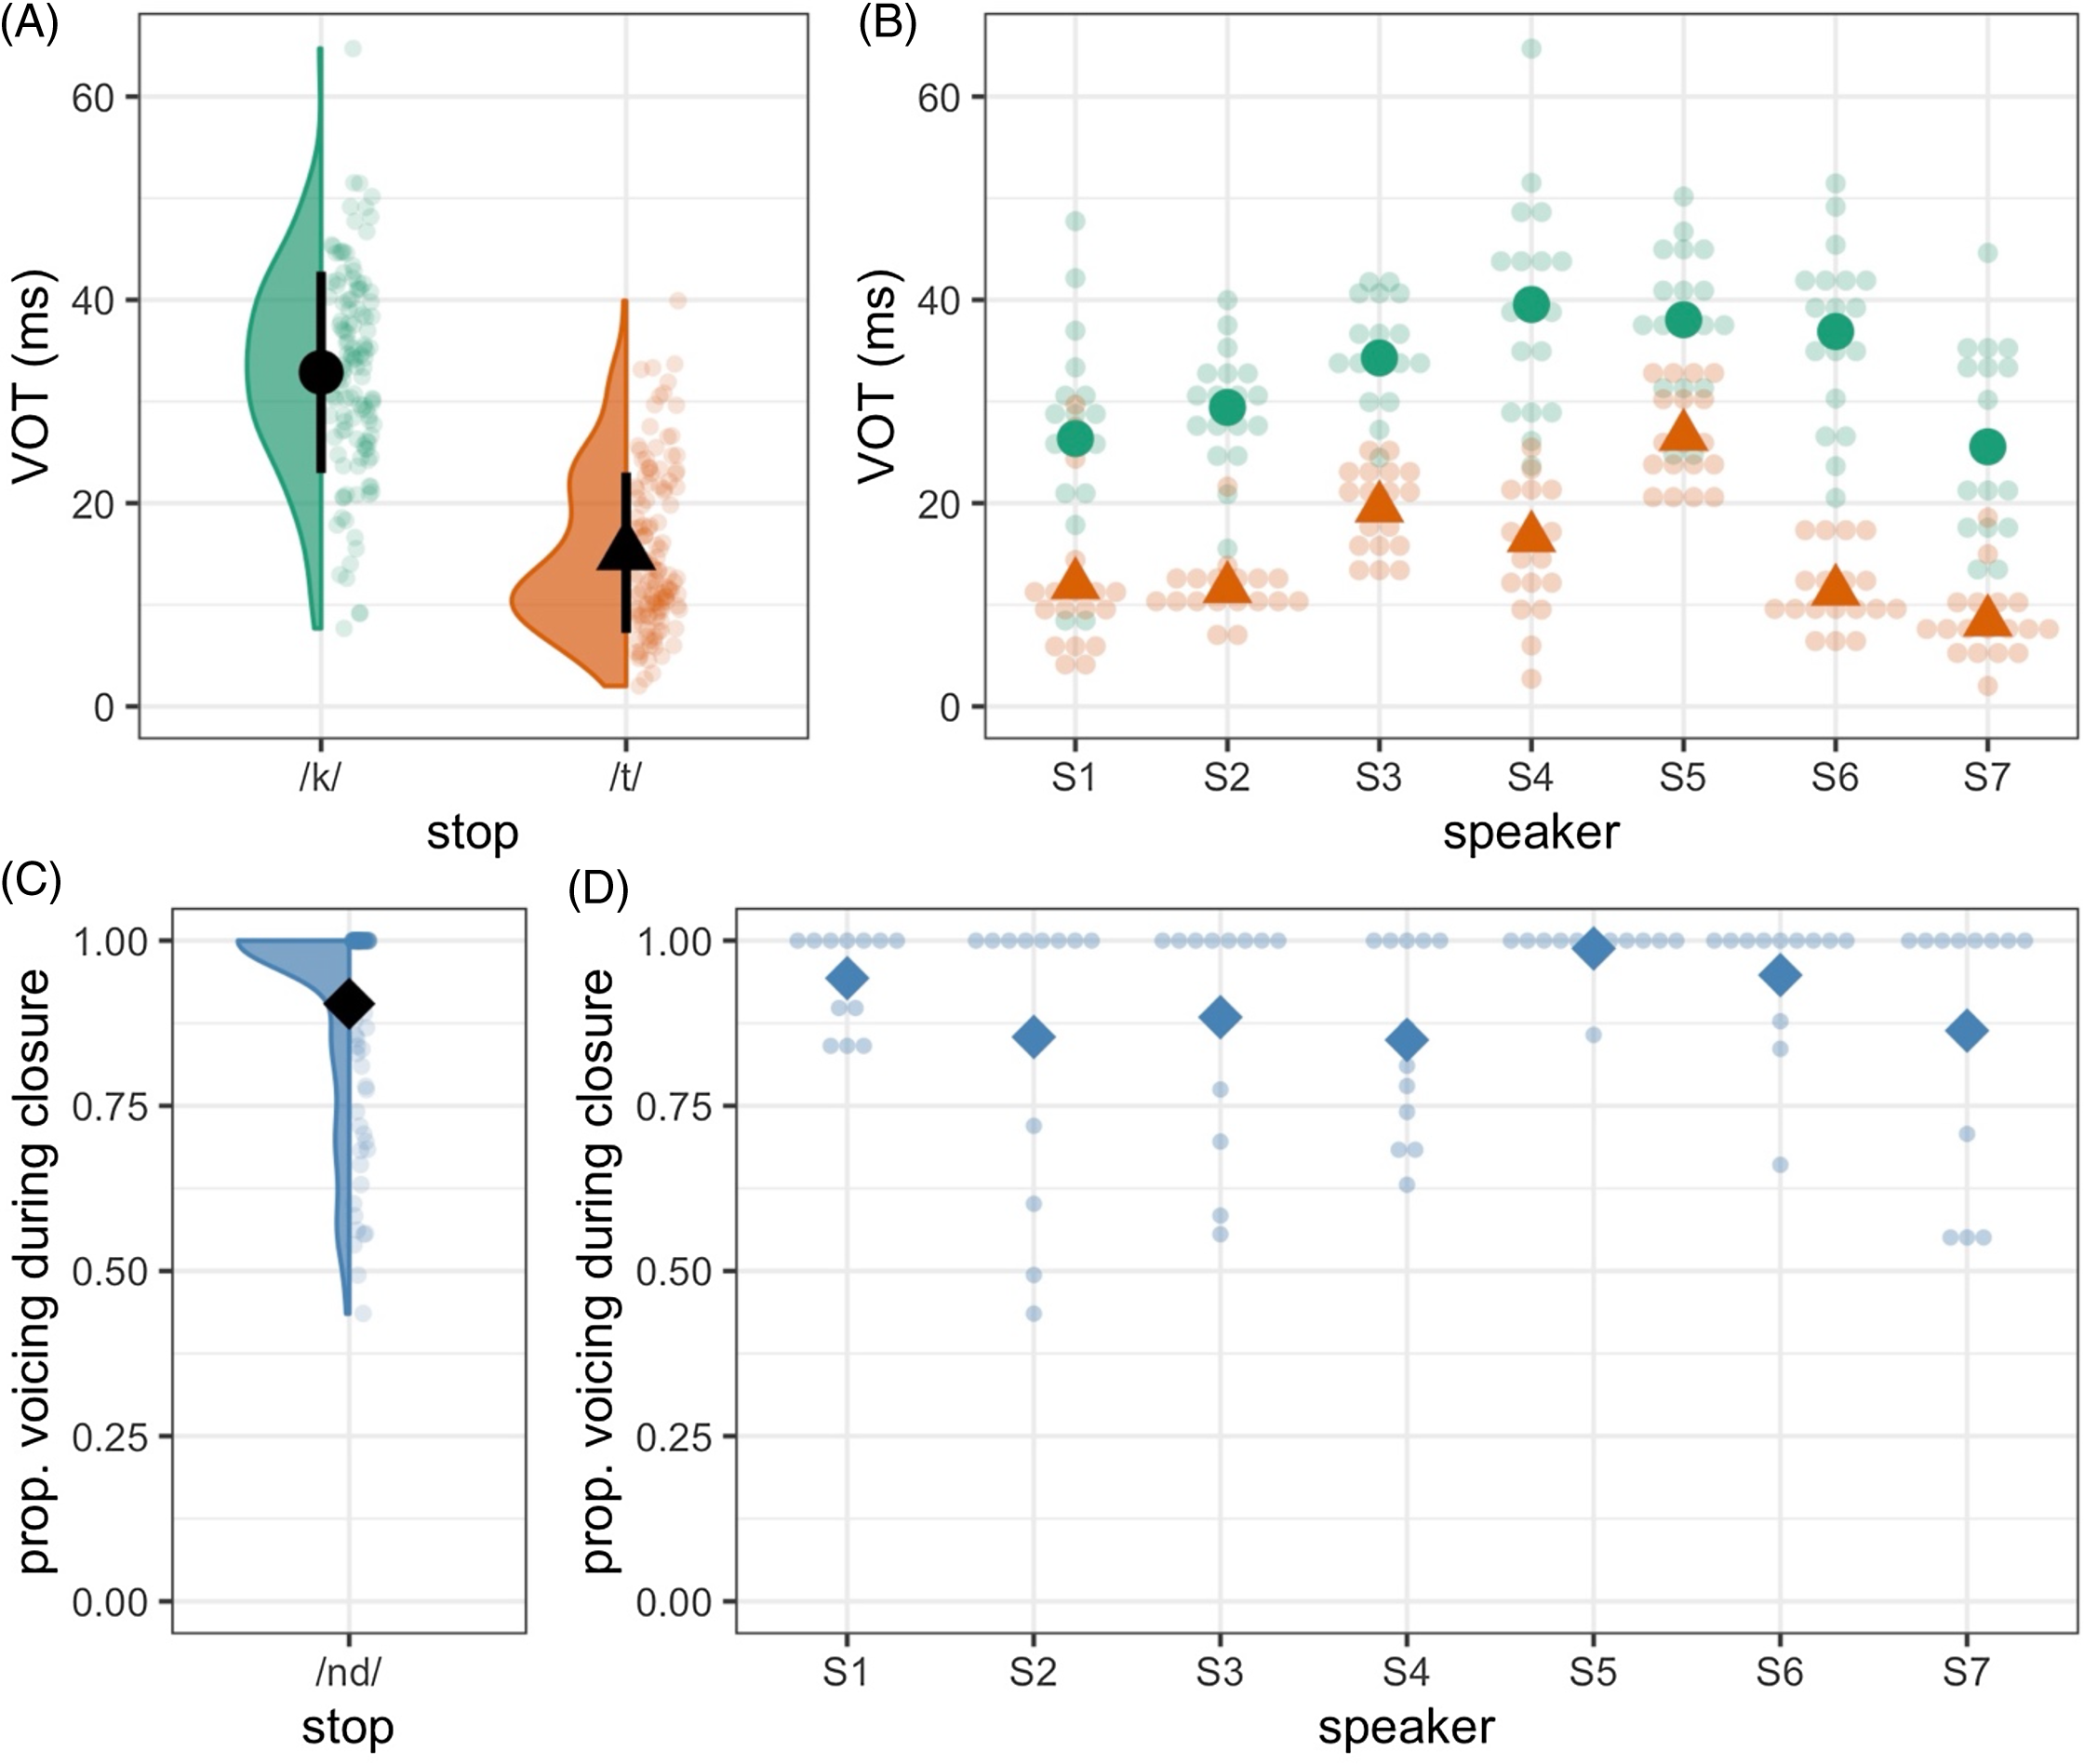
First, with respect to VOT measures for /t/ and /k/, we find confirmation of our observations based on Figure 2. Figure 3A shows each VOT measure for /t/ and /k/ as well as violin plots representing the distribution. In line with the examples in Figure 2, we see that /k/ (mean = 33 ms, SD = 10 ms) has VOT which is substantially longer than /t/ (mean = 15 ms, SD = 8 ms). Figure 3B additionally shows that, though each speaker evidences this pattern, speakers vary in terms of their distribution of VOT values for each stop, and the extent to which VOT values for /k/ and /t/ overlap.
As shown in panels C and D of Figure 3, closure voicing for /nd/ is most often completely voiced. Some productions show voicing that ceases close to stop release, though in most cases unvoiced closure constitutes a small fraction of total closure duration. This pattern suggests voicing as a clear target for these stops.
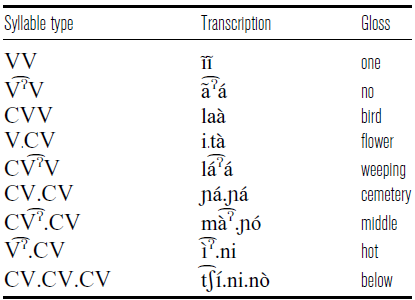
Syllable types. A period indicates a syllable boundary.

Vowels
San Sebastín del Monte Mixtec has five oral vowels and four nasal vowel phonemes, shown in the chart below. All transcriptions are broad phonemic transcriptions. It is important to note than we will use /a/ for typographical convenience to indicate a low central vowel.

SSM, like other Mixtec varieties, employs glottalization contrastively in vowels, where we use the term glottalization to refer to non-modal phonation produced with increased constriction of the vocal folds. Glottalization is evident in two types of syllable types (see Table 1). In V͡ˀV and CV͡ˀV shapes, so-called rearticulated vowels, a period of glottalization occurs between vowels which always share the same vowel quality. In V͡ʔCV and CV͡ʔCV shapes, glottalization occurs at the end of a vowel preceding a consonant. One analysis of the phonemic inventory of the language could be to posit /ʔ/ as a phoneme, though its distribution would be unusual in the sense that it would be the only allowable coda consonant in the language (in Vʔ.CV and CVʔ.CV), and would come with the stipulation that in VʔV and CVʔV forms the vowel quality must always be the same (see Gerfen 1999). For these reasons, we analyze glottalization as a feature of the vowel, in line with the general approach to analyzing glottalization in Mixtec at large (Macaulay & Salmons Reference Macaulay and Salmons1995, Gerfen 1999). Our transcriptions of glottalization in these vowels follow guidelines laid out by Garellek et al. (published online 19 July Reference Garellek, Chai, Huang and Van Doren2021), with the goal of capturing the fact that glottalization, is ‘a part’ of the vowel and enters into a particular phasing relationship with respect to the vowel articulation, being strongest in the middle of the vowel for V͡ˀV, and at the end of the vowel for V͡ʔ. Each of the vowel qualities in the chart above may be produced as either V͡ˀV or V͡ʔ, and glottalization is contrastive, as noted above (compare /ko͡ˀo/ ‘to drink’ vs. /koo/ ‘to sit’). We provide a more in-depth and quantitative examination of V͡ˀV rearticulated vowels below. Vowel-initial words also tend to be realized with initial glottalization on the vowel, in a narrow transcription this could be represented as [ʔ͡V].
As in other varieties of Mixtec (Gerfen & Baker Reference Gerfen and Baker2005), there are long and short vowels in SSM; the vowel length is predictable based on the shape of the morpheme, and is not contrastive. Morphemes that present a long vowel in the language are only CVV or VV. The vast majority of lexical items are bi- or tri-moraic, though some longer items do exist. No lexical word can be smaller than two moras (Pike Reference Pike1948, Longacre Reference Longacre1957), but function words can be monomoraic.
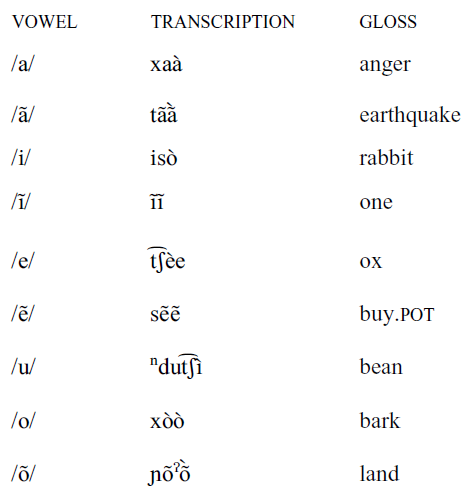
All the oral vowels have a nasal counterpart, with the exception of /u/. More information on nasalization will be provided in the section ‘Nasalization’.
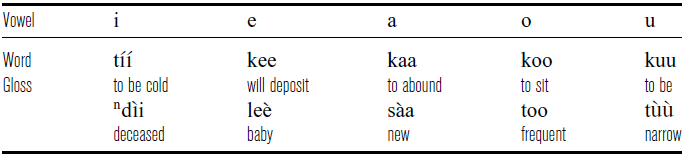
For the purpose of analyzing vowel formant structure, we compared a total of 10 words from our controlled elicitation, described above. Two words contained each of the five oral vowels in the language, as shown in Table 2.
Words used to calculate F1 and F2 for oral vowels in SSM.

F1 and F2 measurements for oral vowels in SSM. Each vowel label appears at the mean value, and ellipses show 1 standard deviation.

A total of 84 measurements were taken for each of the five oral vowels /i e a o u/ (2 words × 6 repetitions × 7 speakers). Vowels were segmented by hand using Praat (Boersma & Weenik 2020), and F1 and F2 measurements were extracted via a Praat script at the midpoint of each vowel. In Figure 4, we present F1 and F2 measurements in Hz.
As seen in Figure 4, /a/ shows F2 intermediate between the front and back vowels, with vowels positioned as expected in the vowel space.
Glottalization and rearticulated vowels
As described above, like other varieties of Mixtec (Macaulay & Salmons Reference Macaulay and Salmons1995, Gerfen & Baker Reference Gerfen and Baker2005), SSM exhibits rearticulated vowels (also called ‘broken vowels’), which are characterized by a period of glottalized voice quality, or production of a glottal stop flanked by two vowels of the same quality. As described above, glottalization in Mixtec at large has generally been treated as a feature of rearticulated vowels (Macaulay & Salmons Reference Macaulay and Salmons1995). In this sense rearticulated vowels could be seen as instantiating a particular phasing relationship between a vowel articulation and glottal gesture, with a maximum of glottal constriction occurring roughly in the middle of the vowel (see Garellek et al., published online 19 July Reference Garellek, Chai, Huang and Van Doren2021). Following previous studies, we thus assume here that glottalization is a vowel feature and can be analyzed in term of dynamic changes over the whole of V͡ˀV.
As described in Gerfen & Baker (Reference Gerfen and Baker2005), who report on glottalization in Coatzospan Mixtec, the realization of rearticulated vowels is highly variable. In their study, changes in pitch and spectral structure often served as cues to the contrast, also co-occurring with small changes in the amplitude envelope of the signal. The authors show in a perception experiment that these changes are sufficient to cue glottalization to speakers (see Hillenbrand & Houde Reference Hillenbrand and Houde1996). More generally, the implementation of [ʔ] at large is known to be highly variable, with realizations that can range from a full and sustained stop closure, to subtler and continuous variations in voice quality (Pierrehumbert & Talkin Reference Pierrehumbert and Talkin1992, Dilley, Shattuck-Hufnagel & Ostendorf Reference Dilley, Shattuck-Hufnagel and Ostendorf1996, Seid, Yegnanarayana & Rajendran Reference Seid, Yegnanarayana and Rajendran2012, Garellek Reference Garellek2013).
In this section, we offer a brief survey of the implementation of glottalization in SSM, focusing on rearticulated CV͡ˀV forms. The words elicited in this section were elicited in the same controlled elicitation setting which was used to analyze vowel formant data. These were /sè͡ˀè/ ‘trash’, /ki͡ˀi/ ‘to wear shoes’, /si͡ˀì/ ‘to die’, /ko͡ˀo/ ‘to drink’, /lo͡ˀò/ ‘small’,  ‘buttock’ (note there are two words per vowel, except for /e͡ˀe/, for which there is only one). Each of these nine words were elicited a total of six times from each of the seven speakers in the controlled elicitation (378 tokens analyzed in total), giving us an opportunity to observe if/how implementation of glottalization may vary within and across speakers. We present two descriptions of this data. First, a qualitative coding of the frequency of production of a full and sustained stop closure. Second, a quantitative assessment of the amplitude of voicing across the rearticulated vowel, as measured by Strength of Excitation (SoE). SoE is a measure of voicing intensity, corresponding to the relative amplitude of excitation during glottal closure instants, i.e. ‘epochs’, during voicing. The measure allows for an assessment of the relative amplitude of voicing in the signal, independent of noise (Murty & Yegnanarayana Reference Murty and Yegnanarayana2008). Garellek et al. (published online 19 July Reference Garellek, Chai, Huang and Van Doren2021) recently used this measure to assess voicing during glottalization including in rearticulated vowels.Footnote
2
In assessing this quantitative measure of voicing during the rearticulated vowels we will focus descriptively on how this varies by speaker, correlates with the coding of the presence/absence of a sustained stop, and changes dynamically over the course of the /V͡ˀV/ interval.
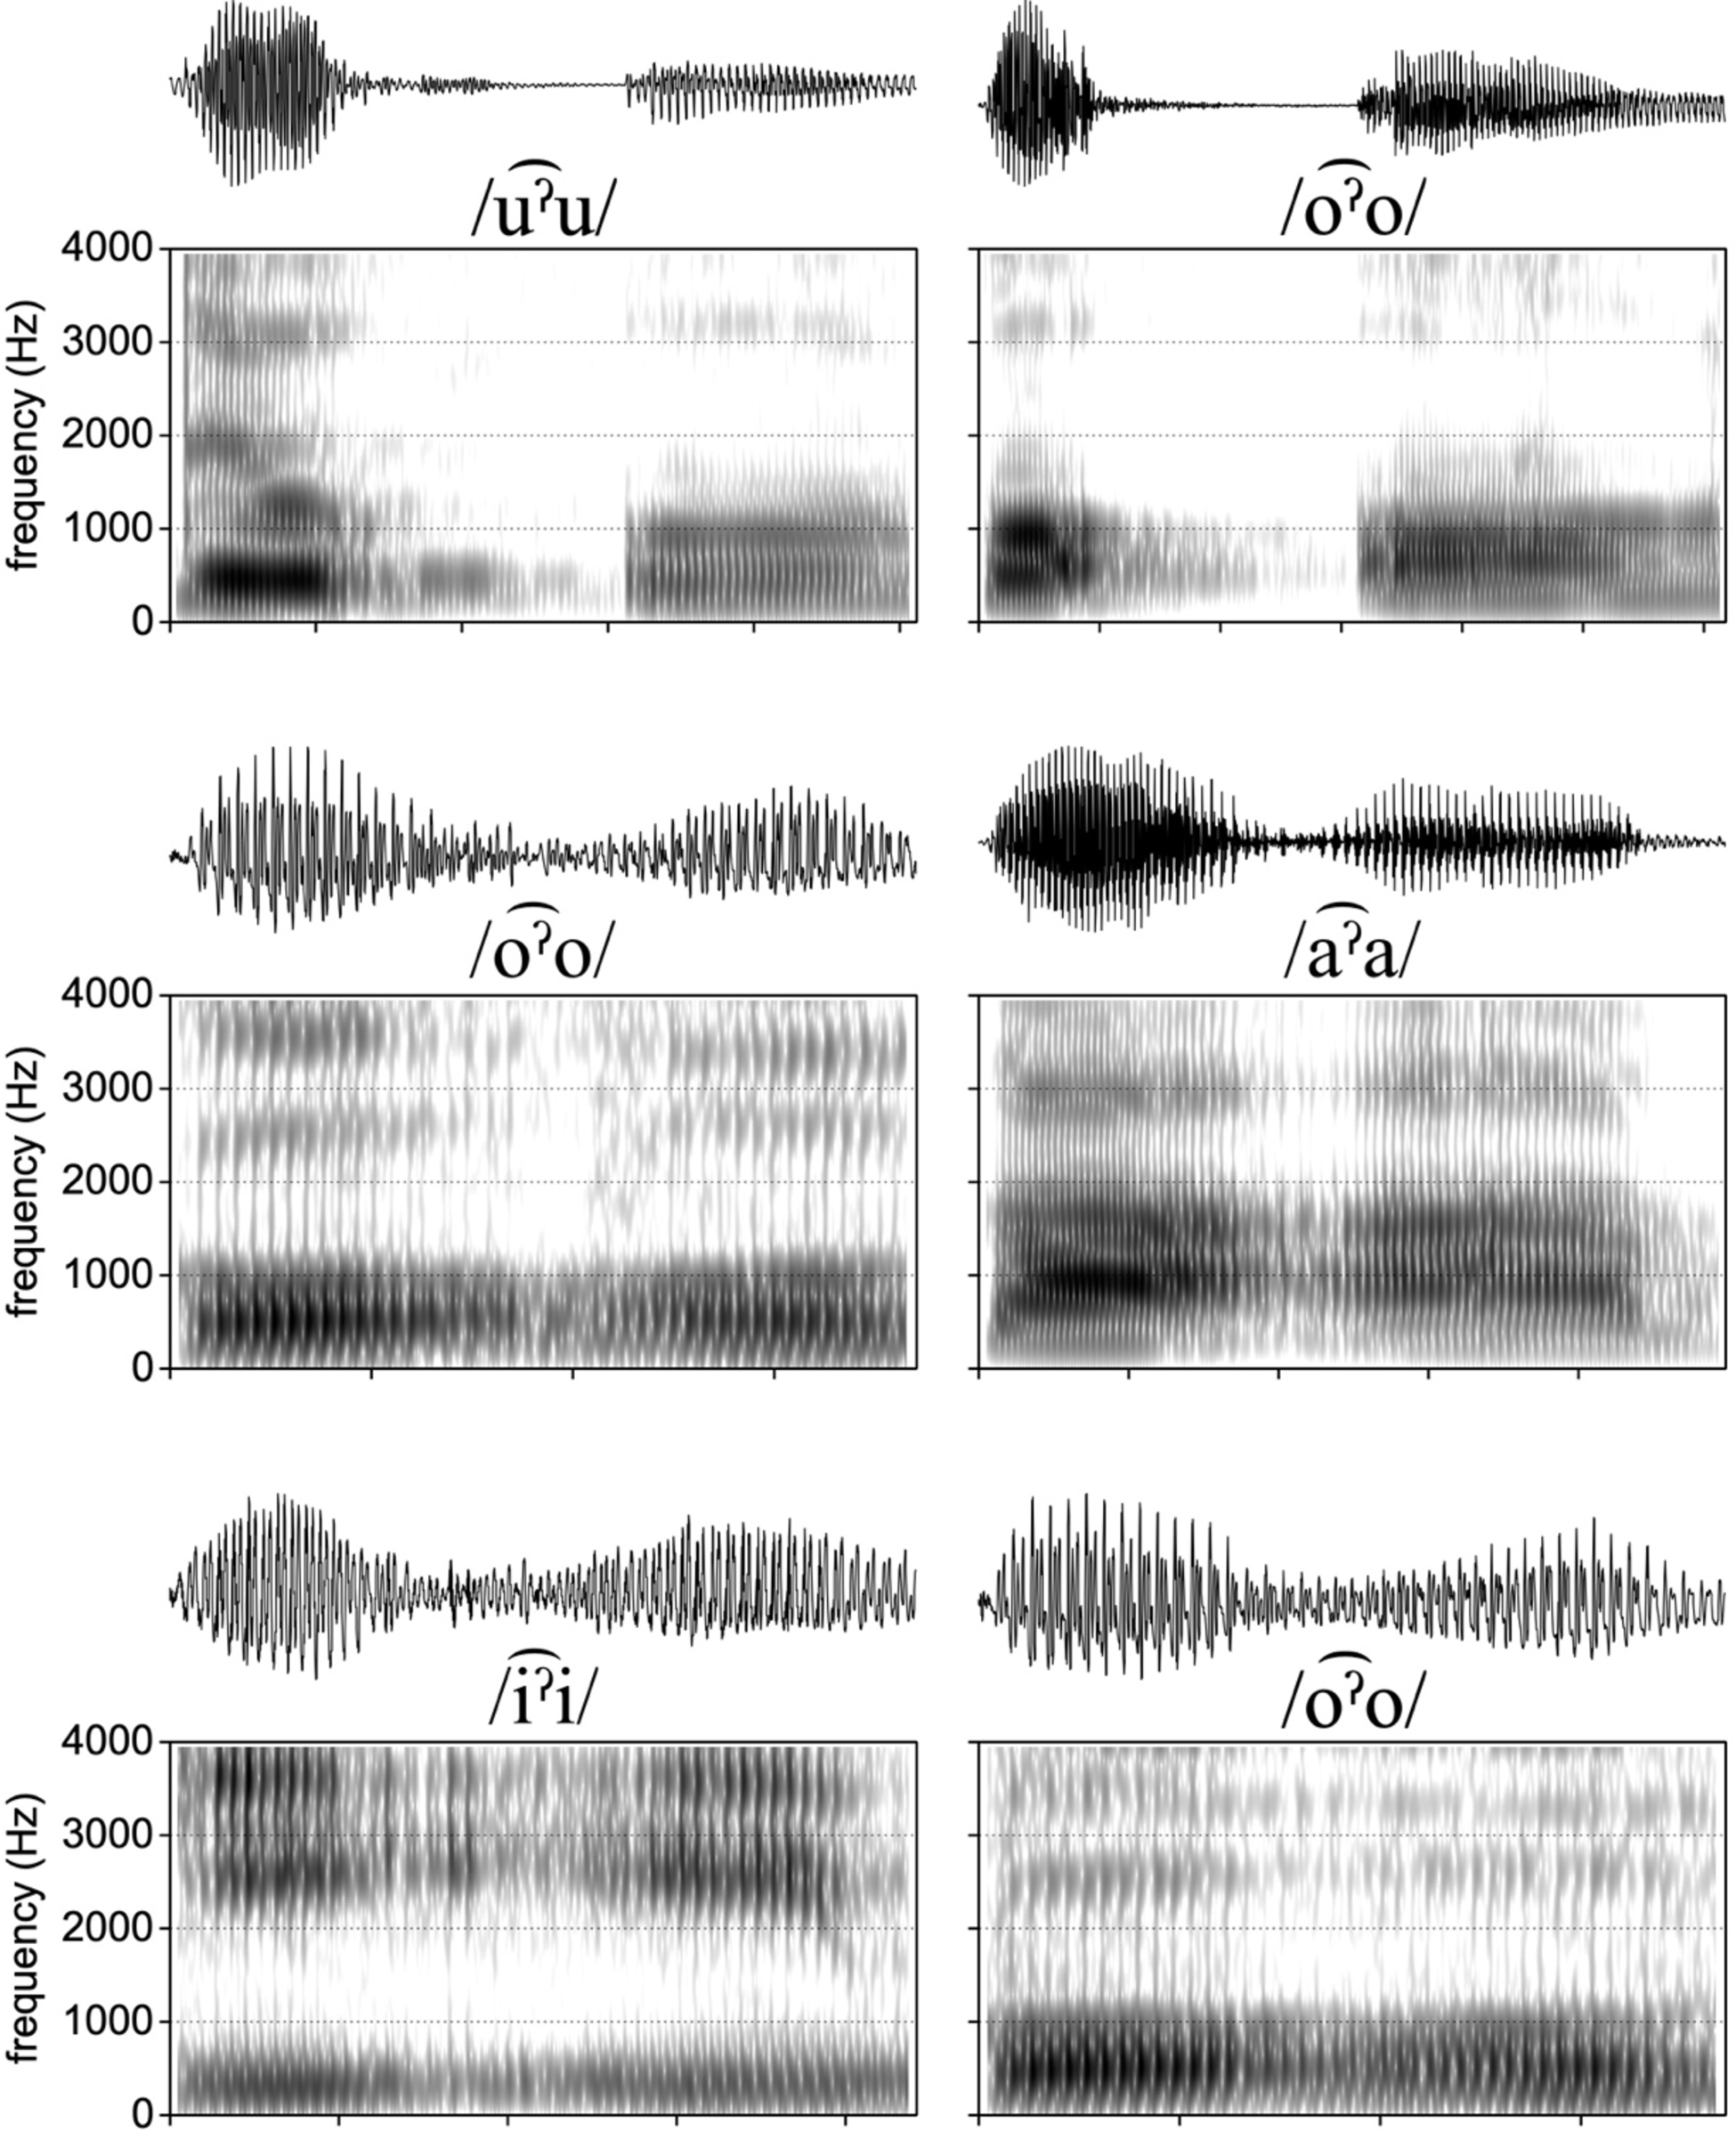
We observed that all seven speakers implemented glottalization in various ways, which formed a continuum from a full and sustained glottal stop, [ʔ], to continuous changes in pitch and voice quality. These latter cases were often accompanied by a dip in amplitude though in some cases voicing becomes highly aperiodic with low amplitude, low frequency, fluctuations in the waveform. Figure 5 shows examples of realizations exemplifying this variation, and ranging from a complete stop (top row) to a ‘lenited’ realization manifested by an amplitude dip (bottom row, in particular the rightmost example). This variation within speakers is occurring in the same elicitation setting, a controlled elicitation which might be expected to lead to more formal speech patterns. We thus conclude that, very generally speaking, speakers show substantial variability in their implementation of glottalization. To examine this variability in a more systematic fashion we coded how glottalization was realized across speakers and vowel qualities. This qualitative coding used the following criteria. A ‘full glottal stop’ was coded in the case of a sustained period of silence with unambiguous stop closure (e.g. topmost panels in Figure 5).
Paired waveforms and spectrograms showing examples of variation in the realization of rearticulated vowels, ranging from a full and sustained glottal stop [ʔ], to continuous changes in amplitude and voice quality. Note the frequency range in the spectrograms is 0–4000 Hz, and each tick on the x axis below each spectrogram represents 100 ms, showing the approximate duration of each example. Examples are from two different speakers.
Distribution of the realization of a sustained glottal stop across speakers where S1–S7 refers to speakers 1 through 7 (top) and split by speaker and vowel quality (bottom).
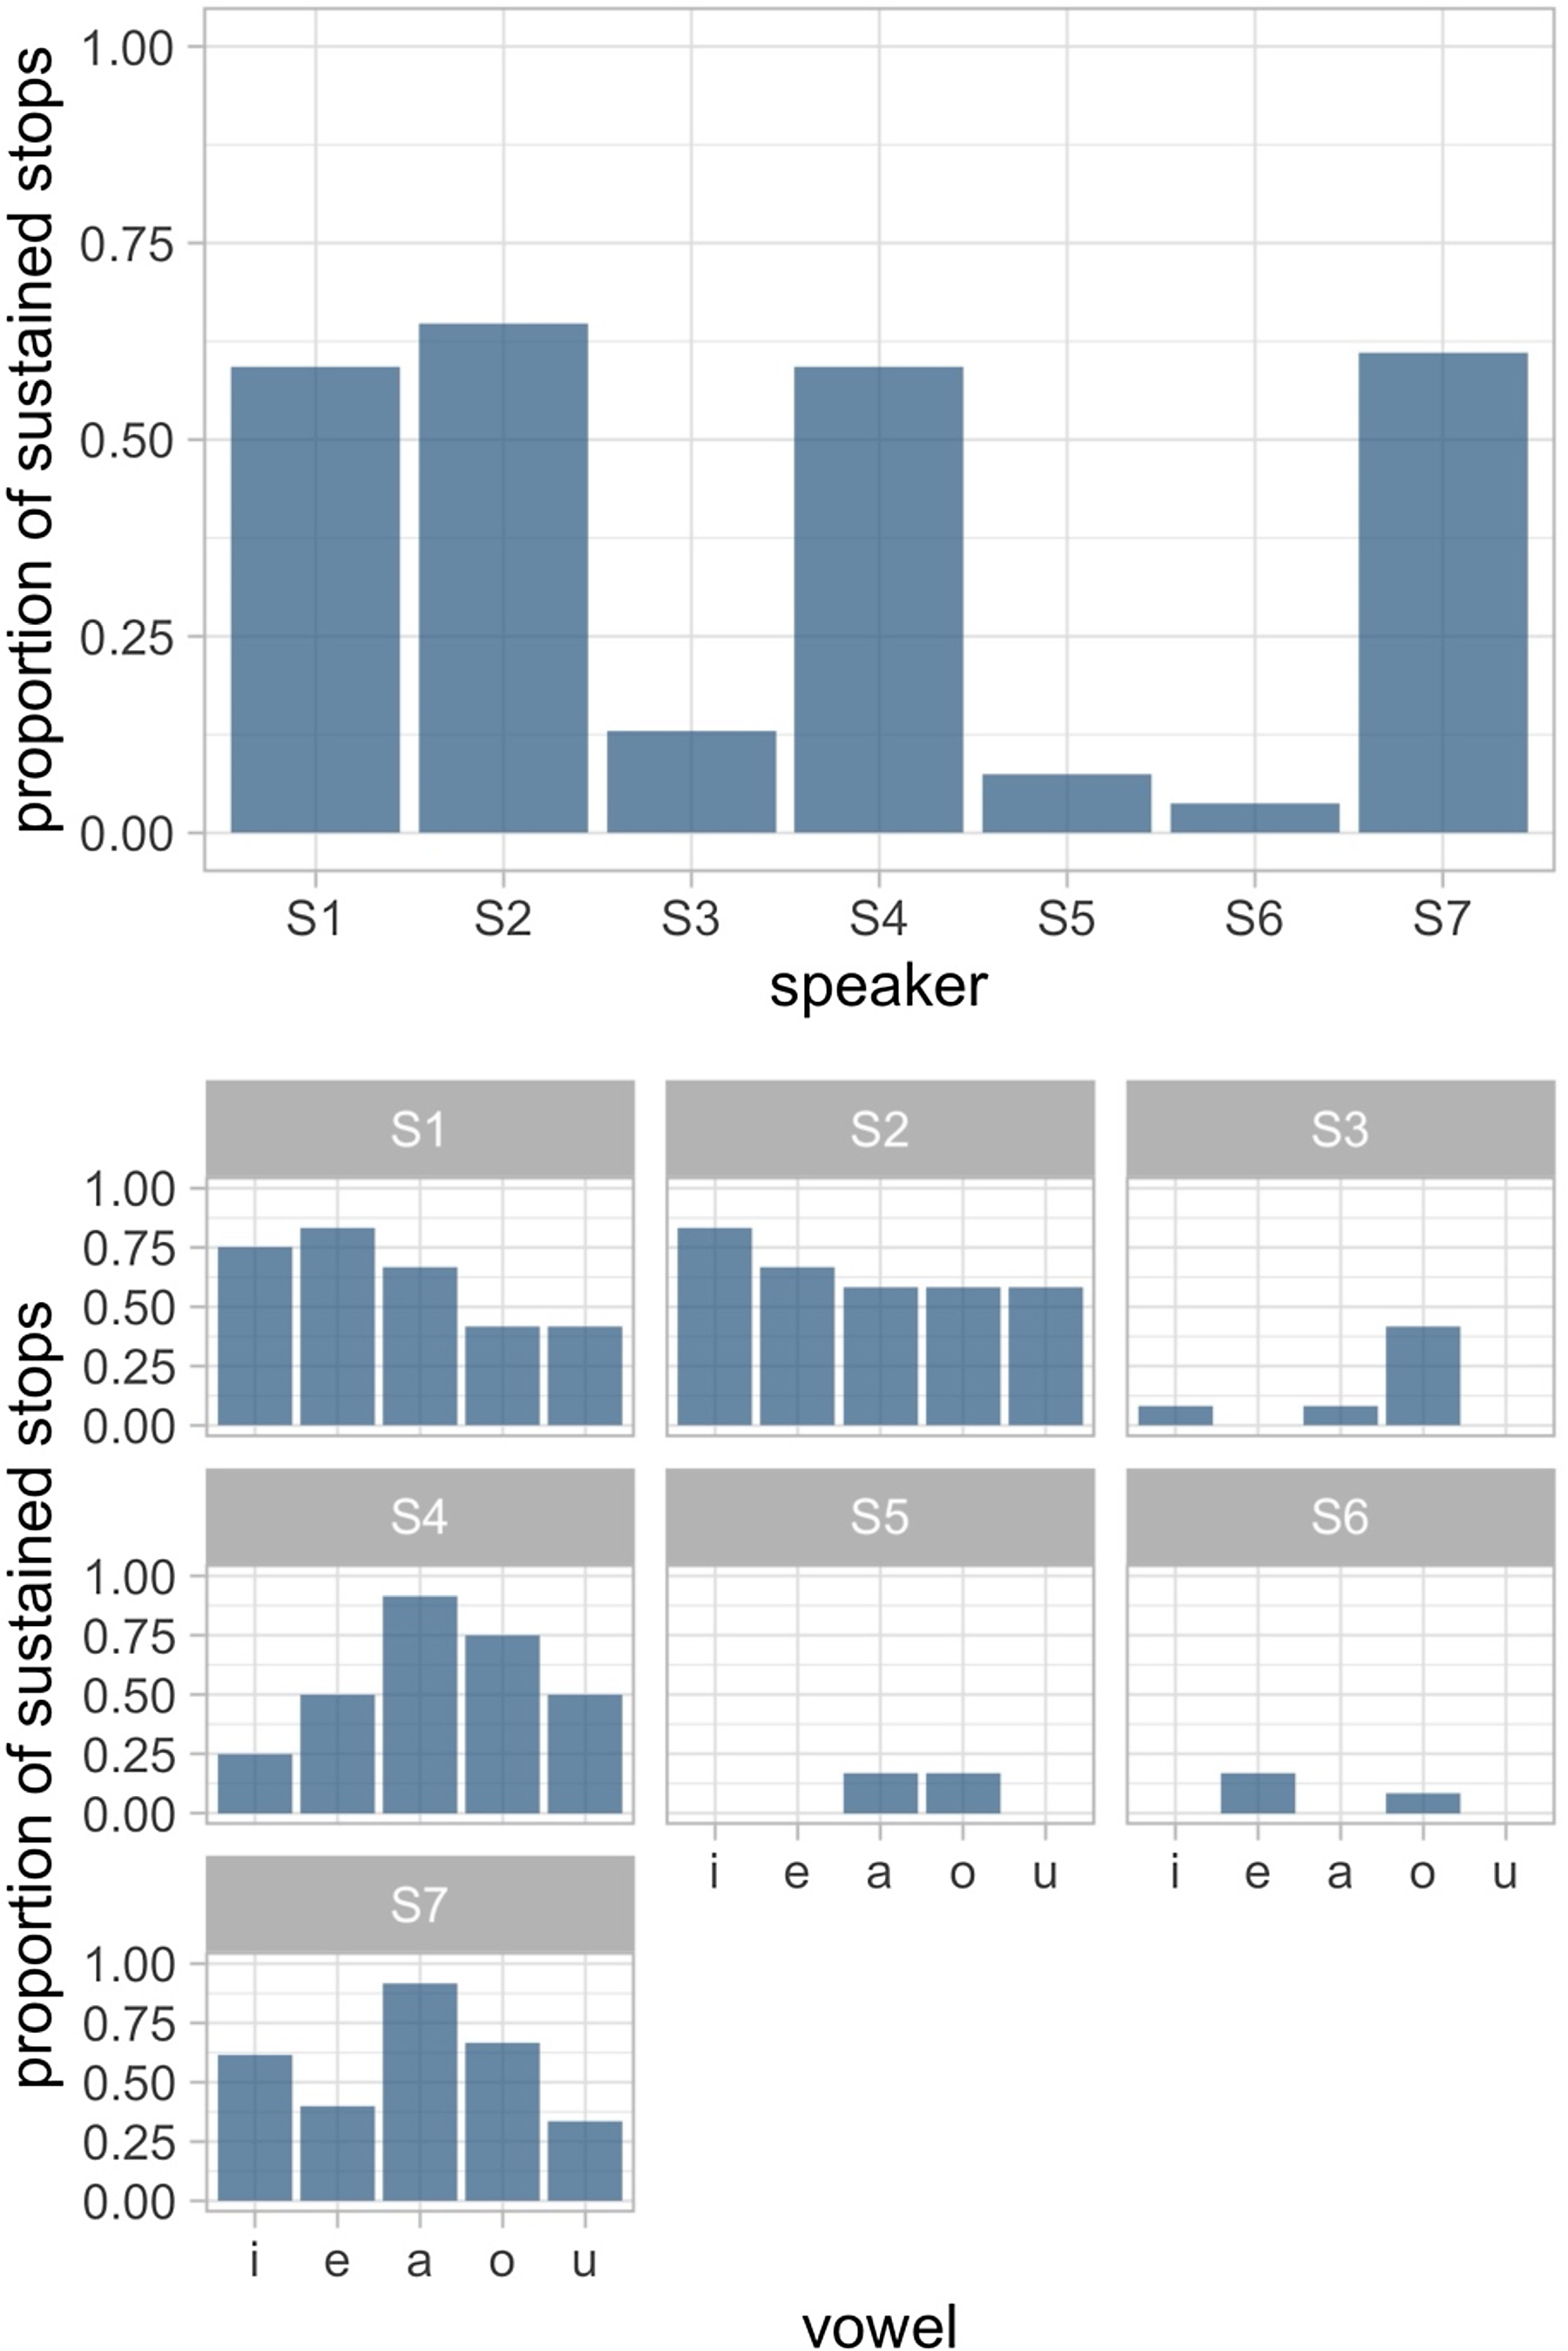
As shown in Figure 6, some speakers show a clear preference for a particular realization. For example, speakers 5 and 6 hardly ever produce a full glottal stop, while speakers 4 and 7 do quite frequently. Differences based on vowel quality do not show any particularly clear pattern across speakers. For example, /a/ shows the highest rate of sustained stop productions for speaker S4 and S7, while /i/ and /e/ show the highest rate for speaker S1 and S2.
Figure 7 displays the SoE measures for each speaker over the course of a rearticulated vowel, with loess smooths fit to each individual trajectory, and for the speaker’s data as a whole. These visualizations allow us to examine the extent to which a speaker modulates the amplitude of voicing during glottalization. Speakers 5 and 6 show minimal changes in this regard, while speaker 2 shows the largest dip in amplitude. Other speakers show similar, though smaller-magnitude dips, phased roughly in the middle of the rearticulated vowel. We can also consider the consistency of the phasing and magnitude of SoE dips for each speaker. Speakers 3 and 4 seem to show the most variation in magnitude, suggesting a variability in the strength of glottalization across rearticulated vowels. The phasing of the SoE dip appears to be fairly consistent for a given speaker, though there are clearly some exceptions, for example several productions from speakers 3 and 4 show notably later phasing of the SoE dip. The general variability in magnitude concurs with Garellek et al. (published online 19 July Reference Garellek, Chai, Huang and Van Doren2021), who suggest glottal gestures such as those in rearticulated vowels are not specified for their magnitude, in which case they vary based on other factors. In our case, the variation between speakers suggests clear speaker-specific differences in the magnitude of the glottal gestures, and additional differences in how consistent a given speaker is. It is worth reiterating here that all speakers read from the same materials in a rather formal controlled elicitation. We believe that these data show a fundamental variability in how glottalization is realized at least in rearticulated vowels. However, it appears that speakers can favor a particular implementation (as coded in our qualitative analysis), corresponding to a tendency for the magnitude of the glottal gesture (as indexed with SoE) to be realized in a particular way.
SoE measured over the course of normalized time for each of the seven speakers. Transparent black lines are loess smooths fit to each individual production, thicker blue lines are smooths fit to aggregate speaker data.

Nasalization
Vowel nasalization in Mixtec languages is contrastive in the language as evident in the minimal pairs shown above, and it is also the result of the process of nasal spreading, which we leave aside for future work on contextual nasalization. In this paper we focus on describing contrastive nasalization, but we refer the reader to work by Marlett (Reference Marlett1992) and DiCanio et al. (Reference DiCanio, Zhang and Whalen2020) for more information on nasalization in other varieties of Mixtec.
Similarly to other varieties of Mixtec, not all oral vowels have a phonemic nasal pair in the language. We based our conclusion on the minimal and near minimal pairs available, as reported in (26)–(30).

As a result, we can conclude that while /a/, /o/, /i/ and /e/ present a nasal counterpart, namely  , the oral vowel /u/ does not have a nasal counterpart in SSM.
Spectrograms of oral (left column) and nasal (right column) vowels for three vowel qualities (labeled above each panel). Ticks on the x axis of the spectrogram mark 100 ms intervals. The spectra in the bottom row are from /a͡ˀa/ and /a˜͡ˀa˜/, at the point of the vowel indexed with the dashed line. The examples are from three minimal pairs: /ìì/ ‘delicate’, /̃̀̃̀/ ‘nine’, /koˀo/ ‘to drink’, /ko˜ˀo˜/ ‘to go’, /kaˀà/ ‘buttock’, and /ka˜ˀa˜/ ‘to speak’.
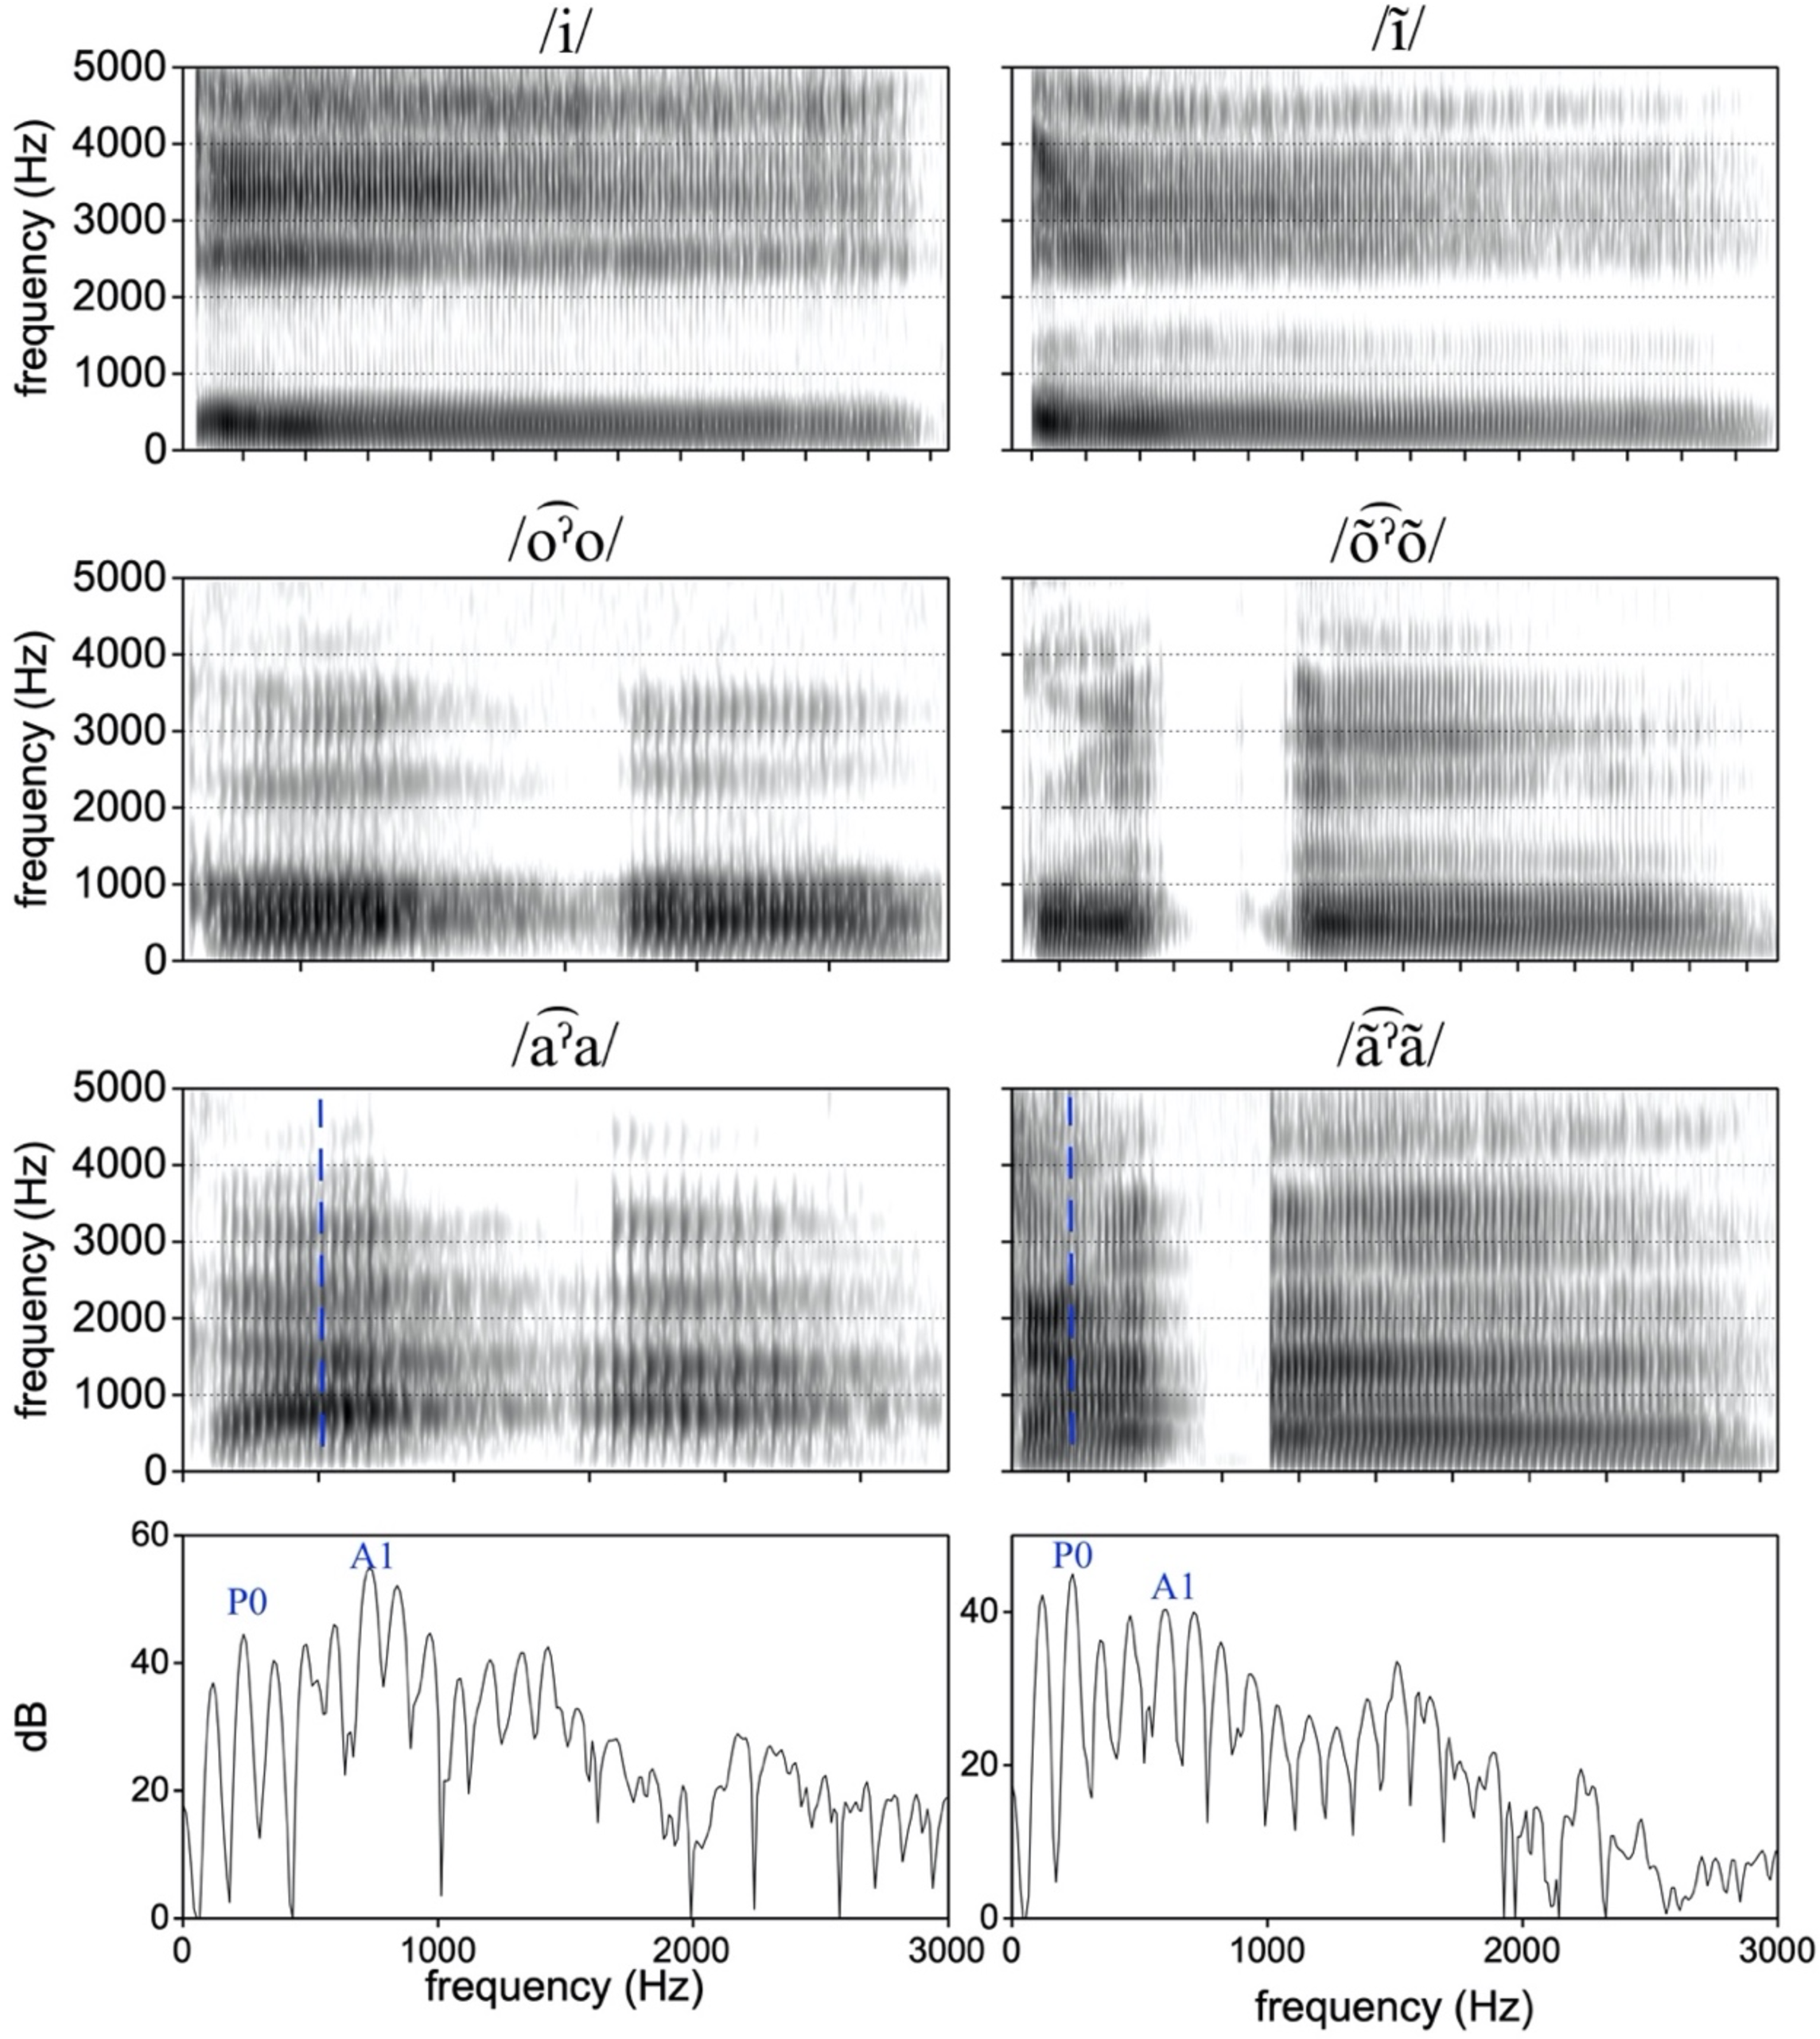
To exemplify how contrastive nasalization in vowels is realized, we present spectrograms and spectra from several pairs of nasal and oral vowels in Figure 8. As shown the figure, nasal vowels /̃/ and /o˜͡ˀo˜/ show the presence of a resonance in the frequency range between 1000 Hz and 2000 Hz (lacking in their oral counterparts). The formant values of F1 and F2 in these two nasal vowels are otherwise fairly similar to their oral counterparts. The spectrograms and spectra for /a͡ˀa/ and /a˜͡ˀa˜/ in the bottommost two rows of Figure 8 also show clear evidence for an effect of nasalization. First, we see that the second harmonic is boosted in amplitude in /a˜͡ˀa˜/, as is typical for nasal vowels. This may be attributed to nasality as an increase in amplitude of the first nasal pole, P0 (Chen Reference Chen1997). This can be considered in comparison to A1 (the amplitude of the harmonic closest to F1), which is relatively reduced in intensity as compared to P0. In the oral counterpart /a͡ˀa/, A1 is clearly higher in intensity, and P0 is not boosted. We can also note a change in F1 and F2 in nasalized /a˜͡ˀa˜/, with F1 lowered and F2 raised slightly (centralizing the vowel), as is visually clear in both the spectrograms and spectra.
Tones
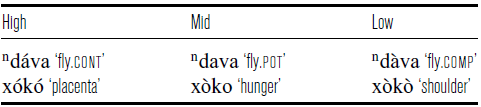
There are three tones in SSM, a high tone <á>, a mid tone <a>, and a low tone <à>. As in other Mixtec varieties, each mora carries a separate tone. Table 3 shows how monomoraic short vowels contrast in tone.
Level tone examples in monomoraic syllables.

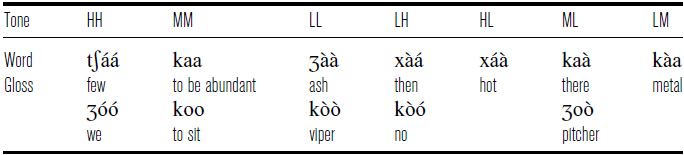
Tonal contours, which can occur in bimoraic CVV syllables, are analyzed as sequences of level tones. In the literature (León Vázquez Reference León Vázquez2017), seven possible contour tones have been described. Examples of words showing these seven contours are given in Table 4.
Words contrasting in tone, used in the f0 analysis.

In this section we present an acoustic analysis of tonal contrasts in SSM, where we examine how f0 varies as a function of tonal category. For this analysis we used different tokens from the same corpus of speech, recorded from seven speakers described in the ‘Voicing in stops’ section above. In addition to the tone-matched items which we elicited for the purpose of measuring F1 and F2, we elicited vowel-matched words contrasting in tone. These items are shown in Table 4. The words had either /a/ or /o/ as vowels, though note that only /a/ contained all possible tones. A total of six productions of each tone-contrasting word was elicited from each speaker during the randomized elicitations, described above.
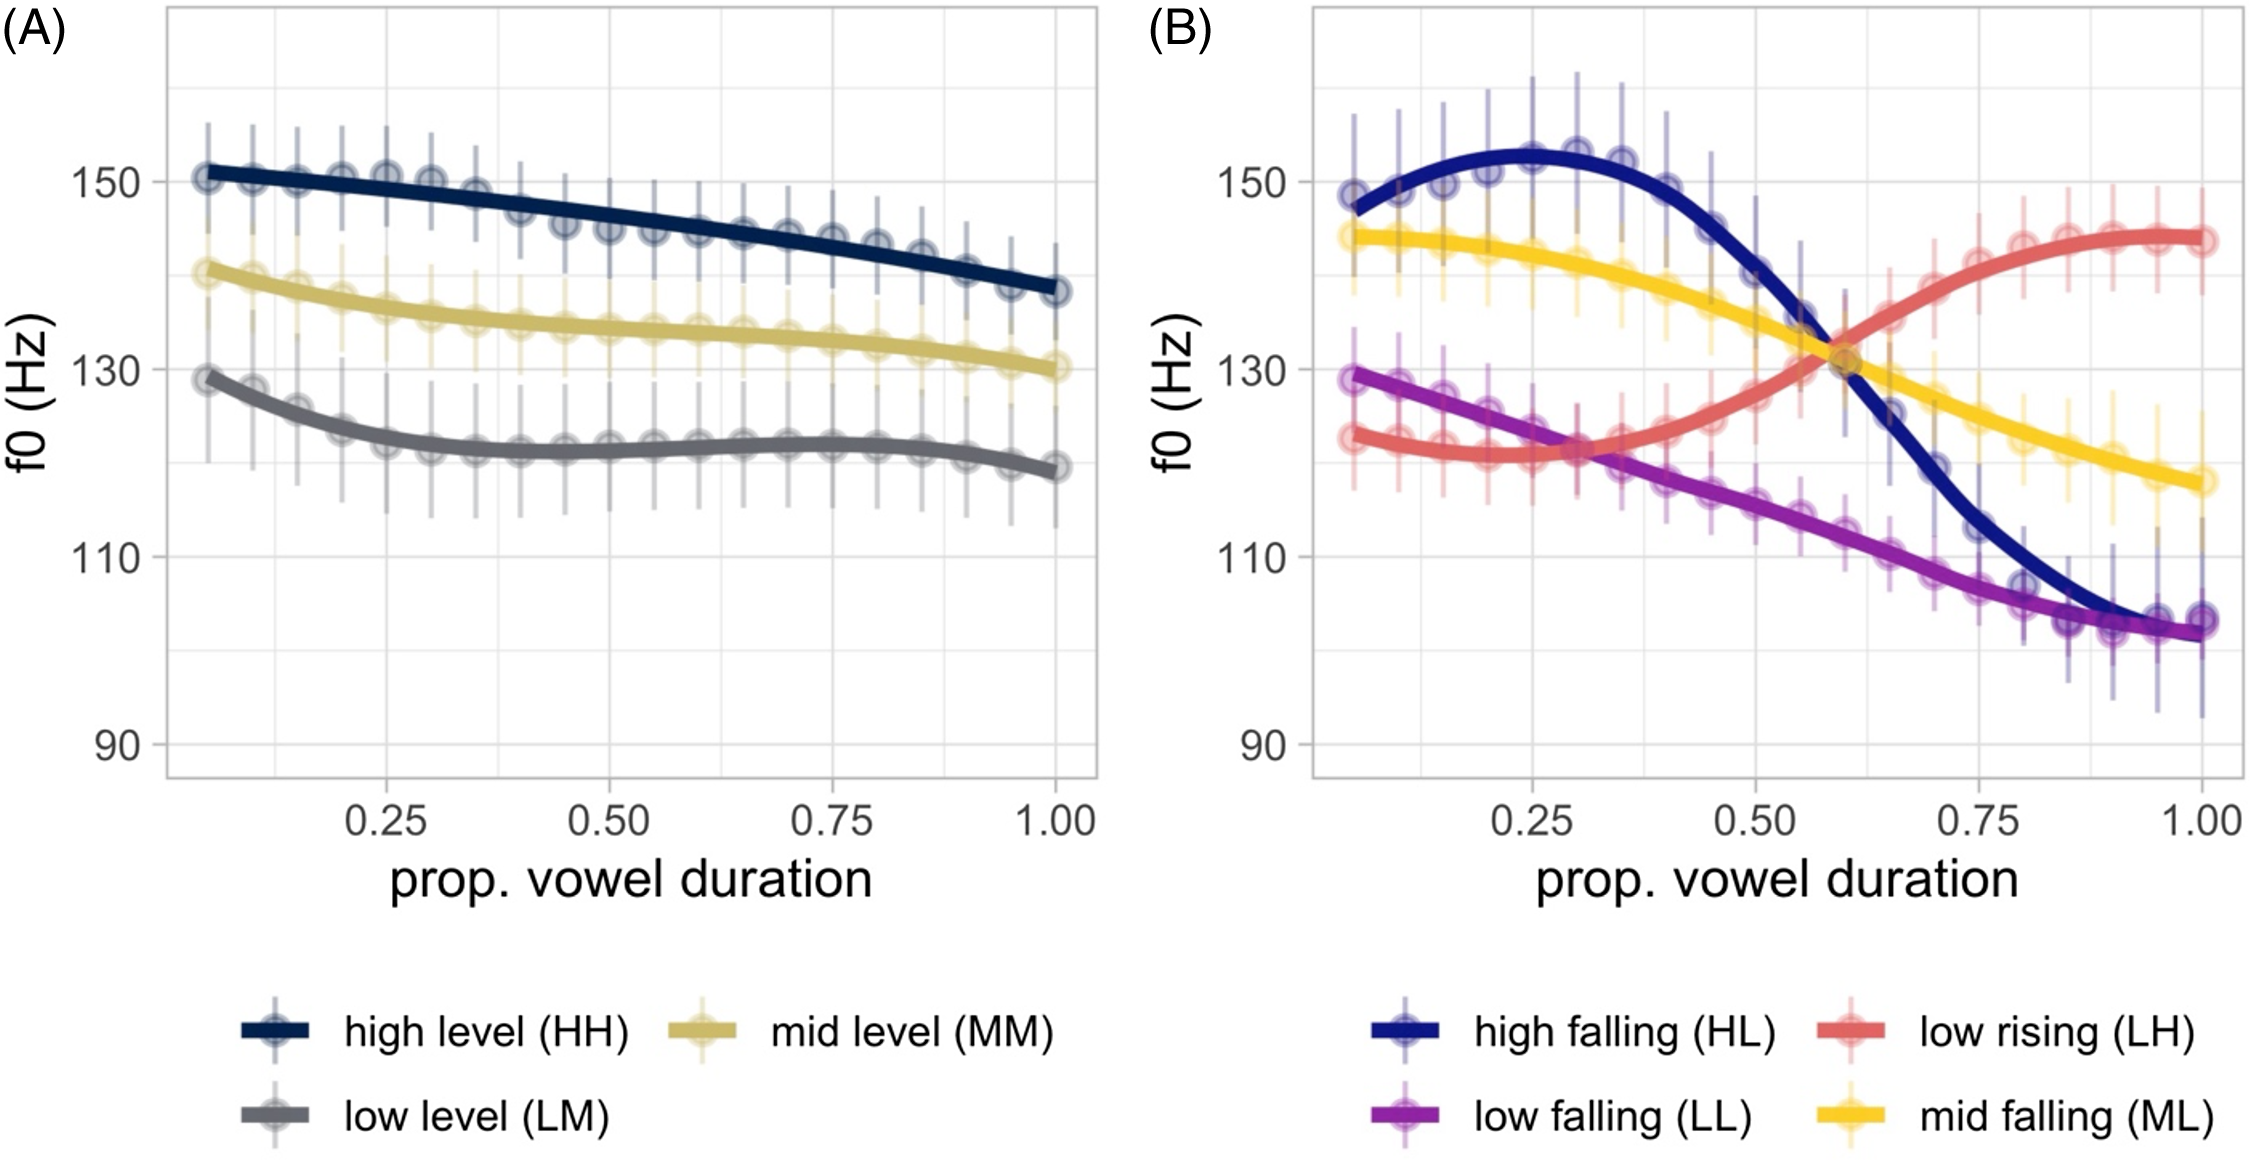
The vowel in these words was segmented as described in the ‘Vowels’ section. We subsequently extracted time-normalized f0 information using ProsodyPro (Xu Reference Xu2013), at 30 time points across each vowel. After inspection of each speakers’ productions, we noted that two speakers produced reliably creaky phonation throughout the elicitation, which was particularly marked on words with low tones. Accurate f0 measurements were difficult to obtain from these speakers for almost all productions, including non-low tones. As such, we report on just five speakers for the tonal data, for whom f0 was reliably tracked. The reported measurements are thus based on a total of 360 tokens (5 speakers × 12 words × 6 repetitions). Figure 9 below plots time-normalized f0 trajectories for each tonal category.
As shown in Figure 9 panel A, three tones are primarily distinguished by the overall height of f0 across the vowel. These are the high level (HH), mid-level (MM), and low level (LM) categories. It is notable that the so-called LM tone is relatively non-dynamic, contrary to what might be expected. This can be compared to the low falling (LL) tonal category shown in panel B. The LL tone is best characterized phonetically as a low falling tone, which is distinguished from the LM category in the latter portion of the vowel (León Vázquez Reference León Vázquez2017). Turning to the more dynamic tonal categories in panel B, we can see that low rising (LH) and high falling (HL) contours generally behave in the expected way: low rising tones start relatively low in a speaker’s pitch range and rise towards the top. The opposite is true for high falling tones. Mid falling tones start slightly lower than high falling tones, though notably seem to fall to a slightly higher target than high falling and low falling categories – thus it seems that mid falling tones operate in a slightly more compressed pitch range. In sum, we can see that each of the seven tonal categories is well distinguished by f0, including the distinction between the level (LM) and falling (LL) categories.
Mean f0 values for tones, with panel A showing relatively level tones, and panel B showing dynamic tones. The y axis plots f0, averaged across speakers (four male, one female). Tones are labeled below each plot. Points indicate means for each tone, with errobars around each mean representing 1 standard error. Lines show a smoothed trajectory with a loess smooth fit to each tone.
Transcription of a recorded passage
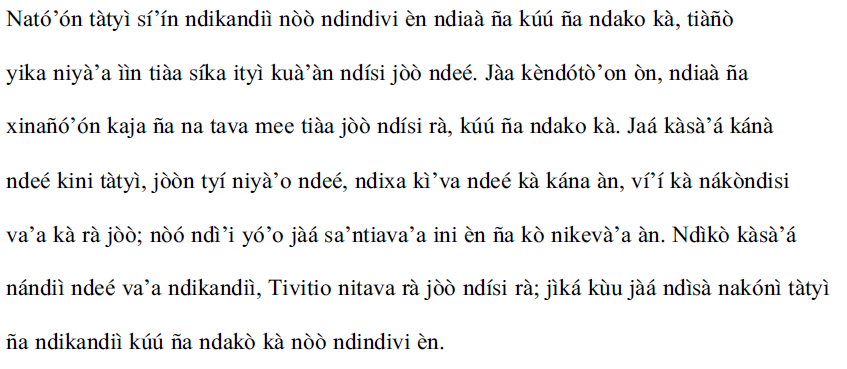
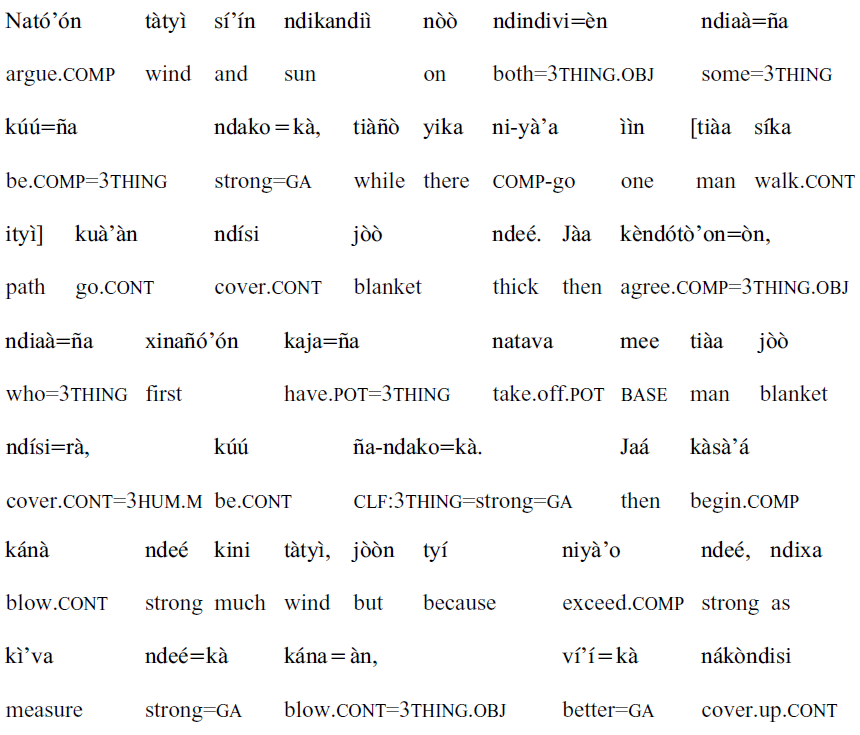
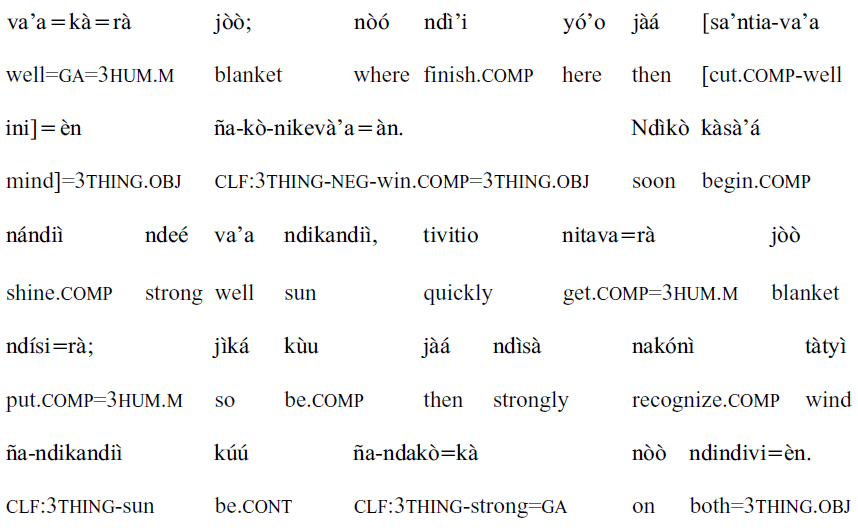
Note that this story is not a traditional Mixtec story and as such one of the authors had to first read it in Spanish, and then translate into San Sebastián del Monte Mixtec; however, the transcription was done after the story was recorded. We included the tones in the phonemic transcription without accounting for tone sandhi or lack of it, as more research is necessary to better understand the tonal system.
Broad phonemic transcription

Orthographic representation
Glossed orthographic representation
Spanish translation
El viento y el sol estaban discutiendo sobre cuál de ellos era el más fuerte, cuando pasó un viajero envuelto en una gruesa capa. Quedaron de acuerdo en que quien primero logrará que aquel viajero se quitará la capa sería considerado el más poderoso. Entonces el viento sopló tan fuerte como pudo, pero entre más soplaba, más se cobijaba en su capa el viajero; al fin el viento del norte se rindió. Entonces el sol brilló intensamente, e inmediatamente el viajero se quitó la capa; así el viento se vio obligado a reconocer que el sol era el más poderoso de los dos.
English translation (translated back from Mixtec and Spanish)
The wind and the sun were arguing about which of the two was stronger. Then there came a traveller wearing a thick blanket. They agreed that whoever of the two would be able to make the man take off his blanket would be considered the stronger of the two. So, then the wind blew with all its might. The stronger the wind blew, the more tightly the traveller held his blanket, until the wind grew tired and stopped blowing. Then the sun shone strongly, making it become very hot. Suddenly the traveller took of his blanket from the heat. And so, the wind agreed that the sun was truly the stronger of the two.
Acknowledgments
We are grateful to Mr. Miguel Cortés, Ms. María del Carmen Ortíz, Mr. Ignacio Pimentel, Mr. Donaciano Cortés, Ms. María Rojas and Ms. Reyna Torres for sharing their language with us. We thank the Club Proyecto Alma Mixteca, the Agencia Municipal of the town of San Sebastián del Monte and the escuela telesecundaria of San Sebastián del Monte for their support. We are very thankful for the helpful feedback and comments from the two anonymous reviewers and from the editors: Dr. Marc Garellek and Dr. Marija Tabain. Many thanks are due to Jae Weller, Qingxia Guo and Bryan Gonzalez for their help with data annotation and to Octavio León Vázquez for comments and suggestions. This research was supported by the Ladefoged Scholarship Award granted by the UCLA Department of Linguistics and by California State University Dominguez Hills Professional Development Fund. Any mistakes are our own.
Supplementary material
To view supplementary material for this article, please visit https://doi.org/10.1017/S0025100322000226