


1. Introduction
One of the most important parameters of modern turbulence theories and attempts to model turbulence is the average rate at which energy per unit mass, say  $\epsilon$, is dissipated through turbulence. It not only describes the actual dissipation of kinetic energy by deformation of the fluid elements (Batchelor Reference Batchelor1967), it is also important to discussions of interscale energy transfer because of its relation to the spectral flux of energy from large to small scales (Tennekes & Lumley Reference Tennekes and Lumley1972; George Reference George2014). Unfortunately the actual dissipation rate is also one of the most elusive quantities to obtain experimentally, mainly because of the small scale motions (typically fractions of a mm in laboratory flows) and small spectral amplitudes which must be resolved to measure it correctly.
This paper tries to extends the state of the art by combining measurements in a moderately high Reynolds number turbulent boundary layer ( $R_\theta = 7634$ with
 $R_{\theta} = \theta U_e/\nu$ where
 $U_e$ is the external velocity,
 $\theta$ is the momentum thickness and
 $\nu$ the kinematic viscosity) using dual plane stereo particle image velocimetry (DP-SPIV) and highly resolved direct numerical simulation (DNS) in a channel at comparable Reynolds number. The DNS is described in detail in § 3. The experiment takes advantage of the unique boundary layer (BL) facility at Laboratoire de Mécanique des Fluides de Lille which can achieve boundary layers of up to 30 cm in thickness at Reynolds numbers of up to
 $R_\theta = 20\,000$ at speeds of up to
 $10\ {\rm m}\ {\rm s}^{-1}$. The large length scales and low mean velocities allow state-of-the-art SPIV to resolve scales small enough to obtain reasonable estimations of the dissipation, while still insuring that the scattering particles follow the flow. But what really makes this experiment possible are two ‘tricks’ used to reduce the SPIV quantization noise which would otherwise have prevented accurate derivative measurement.
Particle image velocimetry (PIV) typically has resolutions of less than 1 : 100 relative to the mean velocity, and this ‘PIV noise’ is of order one (even much larger) when velocity differences at the scale of the Kolmogorov microscale are computed. When this noise is squared, it overwhelms the derivative. In the present contribution, by using cross-plane SPIV, the noise contribution to the ‘measured’ derivative moments could be removed. A second ‘trick’ was to use the continuity equation multiplied by one derivative and averaged so that all squared moments could be computed independently from only cross-moments. This could be used at all measurement locations. The experiment and the noise reduction techniques used are described briefly below, and in detail in Foucaut et al. (Reference Foucaut, George, Stanislas and Cuvier2021).
In the present contribution, after briefly describing the DNS and experiment used, the dissipation data obtained are presented and validated against DNS and previous experimental data. A particular emphasis is put on the behaviour of dissipation in the mesolayer. In a second step, the different classical hypotheses – local isotropy, local axisymmetry and local homogeneity – are examined in detail for the whole flow before focussing on the very near-wall region below  $x_2^+ = 100$ (
 $x_1$ being the streamwise,
 $x_2$ the wall-normal and
 $x_3$ the spanwise coordinates,
 $x_2^+ = x_2 u_{\tau}/\nu$ with
 $u_{\tau}$ the wall friction velocity). Finally the available DNS data are used to look at the spatial structure near the wall of the main components of the dissipation tensor, before drawing some conclusions.
2. What is the dissipation?
Before entering into the details of this contribution, it is important to clearly define the parameters of interest.
2.1. The definition of dissipation
The instantaneous rate of dissipation of kinetic energy,  $\tilde {\epsilon }$ (or simply dissipation) in any flow of any Newtonian fluid is defined to be
 \begin{equation} \tilde{\epsilon} = 2 \nu [\tilde{{\mathsf{s}}}_{ij} \tilde{{\mathsf{s}}}_{ij} - \tfrac{1}{3} \tilde{s}_{kk}\tilde{s}_{kk}]. \end{equation}
The tilde is used to represent an instantaneous quantity,  $\nu$ is the kinematic viscosity,
 $\tilde{{\mathsf{s}}}_{ij}$ is the instantaneous strain rate defined by
 \begin{equation} \tilde{{\mathsf{s}}}_{ij} = \frac{1}{2} \left[ \frac{\partial \tilde{u}_i} {\partial x_j} + \frac{\partial \tilde{u}_j}{\partial x_i}\right], \end{equation}
where  $\tilde {u}_i$ is the instantaneous velocity fluctuation. For an incompressible fluid flow like that considered herein,
 $\tilde{s}_{kk} = 0$, so the last term of equation (2.1) will be dropped in the remainder of this paper. The reason this is the true dissipation is not that the terms are all positive – in fact 3 of them are usually negative. But it is this full
 $\tilde {\epsilon }$ that shows up with negative sign in the entropy equation. So it always acts to reduce the kinetic energy locally, and send it irreversibly to internal energy.
2.2. The average dissipation rate
In turbulence studies, since the instantaneous flow is usually out of reach in practical conditions, it is the Reynolds averaged equations or spectral equations which are solved. So it is the average dissipation rate,
 \begin{equation} \epsilon \equiv \langle \tilde{\epsilon} \rangle = \langle 2 \nu \tilde{{\mathsf{s}}}_{ij} \tilde{{\mathsf{s}}}_{ij}\rangle, \end{equation}
that is of primary interest. Hereafter in this paper the symbol  $\epsilon$ will refer to the averaged dissipation rate, or simply ‘the dissipation’.
It is frequent in DNS, but also recently in reported experiments as well, to report on the averaged values of the ‘ pseudo-dissipation’, which is classically used in turbulence models of the turbulence kinetic energy (TKE) equation
 \begin{equation} \mathcal{D} \equiv \nu \left\langle \left[ \frac{\partial u_i}{\partial x_j}\right]^2 \right\rangle. \end{equation}
First note that  $\tilde {\mathcal {D}} = \nu (\partial \tilde {u}_i / \partial x_j))^2$ is not the instantaneous dissipation. The reason is of course that it contains both strain-rate and rotation-rate contributions, and the latter do not dissipate energy (Batchelor Reference Batchelor1967). But when averaged quantities are considered, the difference between
 $\epsilon$ and
 $\mathcal {D}$ is often slight. This is due to the fact that high Reynolds number turbulence is often nearly locally homogeneous (George & Hussein Reference George and Hussein1991). In homogeneous flows
 $\langle {\mathsf{s}}_{ij} {\mathsf{s}}_{ij} \rangle = \langle \frac {1}{2} \omega _i \omega _i \rangle = \langle \omega _{ij} \omega _{ij} \rangle$, where
 $\omega _i$ is the vorticity and
 $\omega _{ij}$ is the rotation-rate tensor (Tennekes & Lumley Reference Tennekes and Lumley1972; George & Hussein Reference George and Hussein1991).
If, instead of the TKE equation, the full Reynolds stress transport system is looked at, then the dissipation takes the shape of a tensor
 \begin{equation} {\boldsymbol{\epsilon}}_{ij} = 2\nu \left\langle \frac{\partial u_i}{\partial x_l}\frac{\partial u_j}{\partial x_l}\right\rangle + \nu \left\langle \frac{\partial u_l}{\partial x_i}\frac{\partial u_j}{\partial x_l}\right\rangle + \nu \left\langle \frac{\partial u_l}{\partial x_j}\frac{\partial u_i}{\partial x_l}\right\rangle, \end{equation}
and the ‘ pseudo-dissipation’ is also a tensor
 \begin{equation} \mathcal{D}_{ij} = 2\nu \left\langle \frac{\partial u_i}{\partial x_l}\frac{\partial u_j}{\partial x_l}\right\rangle. \end{equation}
2.3. Measuring the true dissipation
To obtain the average dissipation rate,  $\epsilon = 2 \nu \langle {\mathsf{s}}_{ij} {\mathsf{s}}_{ij} \rangle$ experimentally it is necessary to measure all its components. This in turn requires measuring the variance of each velocity derivative term together with a few covariances of them. There is a total of twelve terms which can be organized into three groups (George & Hussein Reference George and Hussein1991)
 \begin{align} \epsilon & = \nu \left\{2\left[\left\langle \left[ \frac{\partial u_1}{\partial x_1} \right]^2 \right\rangle + \left\langle \left[\frac{\partial u_2}{\partial x_2} \right]^2\right\rangle + \left\langle \left[\frac{\partial u_3}{\partial x_3} \right]^2 \right\rangle \right]\right. \nonumber\\ & \quad +\left[ \left\langle \left[\frac{\partial u_1}{\partial x_2}\right]^2 \right\rangle + \left\langle \left[\frac{\partial u_2}{\partial x_1}\right]^2 \right\rangle + \left\langle \left[\frac{\partial u_1}{\partial x_3} \right]^2\right\rangle \right. \nonumber\\ &\quad + \left. \left\langle \left[ \frac{\partial u_3}{\partial x_1} \right]^2\right\rangle + \left\langle \left[\frac{\partial u_2}{\partial x_3} \right]^2 \right\rangle+\left\langle \left[\frac{\partial u_3}{\partial x_2} \right]^2\right\rangle \right] \nonumber\\ & \quad \left. + 2 \left[\left\langle \frac{\partial u_1}{\partial x_2}\frac{\partial u_2}{\partial x_1} \right\rangle + \left\langle \frac{\partial u_1}{\partial x_3}\frac{\partial u_3}{\partial x_1}\right\rangle + \left \langle \frac{\partial u_2}{\partial x_3} \frac{\partial u_3}{\partial x_2} \right\rangle\right] \right\}. \end{align}
Note that the first nine are squared, but only the diagonals (top line) and cross-moments (bottom line) have a factor of 2 in front of them. The last line involves only cross-moments which are usually negative. Obviously any attempt to determine the dissipation by experiment is especially difficult because of the large number of velocity derivatives which must be measured and the difficulty of measuring them in real turbulent flows. As a result, all measurements to date have had to make assumptions about the turbulence which are not necessarily valid.
For the measurements preceding ours reported here (all with hot-wires and in turbulent boundary layers (TBL)) it was difficult to measure accurately because of the high spatial resolution required (Wyngaard Reference Wyngaard1968; George & Taulbee Reference George and Taulbee1992; Ewing, Hussein & George Reference Ewing, Hussein and George1995; Ewing & George Reference Ewing and George2000). Only in the past few decades has it been possible to measure more than as few derivatives at a time, and even this required extraordinary effort (cf. Balint, Wallace & Vukolavcevic Reference Balint, Wallace and Vukolavcevic1991; Tsinober, Kit & Dracos Reference Tsinober, Kit and Dracos1992; Honkan & Andreopoulos Reference Honkan and Andreopoulos1997; Andreopoulos & Honkan Reference Andreopoulos and Honkan2001; Gulitski et al. Reference Gulitski, Kholmyansky, Kinzelbach, Lüthi, Tsinober and Yorish2007). All used Taylor's frozen field hypothesis for the streamwise derivatives. More recent attempts have been made using PIV, but most of these also used Taylor's hypothesis in some form.
For some recent PIV measurements (e.g. Carlier & Stanislas Reference Carlier and Stanislas2005; Herpin et al. Reference Herpin, Coudert, Foucaut and Stanislas2012), spatial resolution has been less of a problem than with hot-wires; but as noted above, the limited dynamical range (typically less than 1 : 100) and the resulting noise present serious problems, since many of the derivatives needed are squared. Time-resolved PIV has not contributed significantly for two reasons. First of all, the data rates are simply not high enough yet to obtain a reasonable time derivative in air at the scales needed. But second, and more fundamentally, Taylor's frozen field hypothesis has always been a serious issue when using time derivatives (cf. Antonia, Phan-Thien & Chambers Reference Antonia, Phan-Thien and Chambers1980; George, Hussein & Woodward Reference George, Hussein and Woodward1989; Lumley Reference Lumley1995). The fundamental problem is that the convection velocity is fluctuating and this ‘leaks’ energy down the derivative spectrum, so serious over-estimates of the derivative moments are common (Champagne Reference Champagne1978). Even more serious problems with many measurements to date arise from the need to make assumptions about the statistics (e.g. isotropy, homogeneity, etc.) to fill in the missing terms.
2.4. The goal of this paper
This paper will present our data and compare them with previous attempts to measure the dissipation and velocity derivatives in turbulent boundary layers. Of particular interest will be the data of Balint et al. (Reference Balint, Wallace and Vukolavcevic1991), Honkan & Andreopoulos (Reference Honkan and Andreopoulos1997) and Andreopoulos & Honkan (Reference Andreopoulos and Honkan2001) who published experimental results of the dissipation rate obtained in a turbulent boundary layer with specially designed multiwire probes (Note that the experiments of Tsinober et al. (Reference Tsinober, Kit and Dracos1992) were of great interest as well, but we simply could not make their data fit our plots with the scaling parameters provided.). All of the DNS results for TBL (at least until very recently) are of much lower Reynolds number than the present experiment and therefore are of limited interest. Only Antonia, Kim & Browne (Reference Antonia, Kim and Browne1991) examined the different hypotheses using DNS results from a channel flow at low Reynolds number. Unfortunately, many of the more recent DNS results which are at Reynolds numbers comparable to the present data did not catalogue all of the necessary derivative moments to compute the true dissipation. For this reason, a specific channel flow DNS performed by Thais et al. (Reference Thais, Tejada-Martínez, Gatski and Mompean2011) was used for comparison here as all the necessary data were provided by the authors. The characteristics of this DNS are summarized in § 3. It was expected to not be too different from a boundary layer in the near-wall and log regions, nor was it.
This contribution presents the first measurements of all derivatives in a turbulent boundary layer at moderate Reynolds number using DP-SPIV. Stereo PIV is applied in two normal planes to compute all the derivatives of the three velocity components. Both the true dissipation rate,  $\epsilon$, and the pseudo-dissipation rate,
 $\mathcal {D}$, are evaluated. It also uses these new results and those of the channel flow DNS at comparable Reynolds number to evaluate previous measurements and theoretical predictions.
Then the assumptions usually made about the velocity derivatives and the dissipation (and enstrophy) inferred from them are examined in detail. Of particular interest is whether the velocity derivative moments in TBL can be assumed to be locally isotropic, locally axisymmetric or even locally homogeneous. Also considered are the tensors,  ${\boldsymbol{\epsilon}} _{ij}$ and
 $\mathcal {D}_{ij}$ which appear in the Reynolds stress balance equations. Finally, the spatial distribution of the building terms of the turbulence dissipation is examined near the wall.
3. Description of the channel flow DNS computation
At the time of this work, there were no easily accessible DNS data sets which included the velocity derivative cross-velocity moment data. For example, even the recent relatively high Reynolds number data (Hoyas & Jiménez Reference Hoyas and Jiménez2008) are missing these moments. Fortunately our colleagues (Thais and co-workers) made their  $Re_\tau = 3000$ data available to us for post-processing. So the DNS results used in the present work were obtained by Thais and co-workers using a massively parallel code described in Thais et al. (Reference Thais, Tejada-Martínez, Gatski and Mompean2011) for the direct numerical simulation of Newtonian or viscoelastic turbulent channel flow. The spatial discretization uses Fourier modes in the two periodic streamwise and spanwise directions and sixth-order compact finite differences in the normal direction. The Reynolds number based on friction velocity and half-channel height is
 $Re_\tau =3000$. The discretized equations were integrated on a domain of size
 $8 {\rm \pi}\times 2 \times 3 {\rm \pi}/2$ with a spatial resolution
 $5120 \times 768 \times 2048$ in the streamwise (
 $x_1$), normal (
 $x_2$) and spanwise (
 $x_3$) directions, respectively. The first grid point in the normal direction is located at
 $\varDelta _{x_2}^+=0.5$ from each wall and up to 18 points are used to discretize the first 10 wall units. The spatial discretizations in the streamwise and spanwise directions are
 $\varDelta _{x_1}^+=11$ and
 $\varDelta _{x_3}^+=7$, respectively. The simulation was performed on an IBM Blue Gene/Q computer running at the IDRIS/CNRS computing centre, Orsay, France.
Up to 40 velocity fields were recorded but only the last 7 were used to compute the dissipation terms of the present analysis. These fields are separated by a non-dimensional time of 1.5 based on the bulk velocity and the half-channel height. This corresponds to  $\Delta t^+=200$ in wall unit time. The dissipation terms were computed in physical space on the full domain using an eighth–order compact finite difference scheme for the derivatives in order to maintain accuracy.
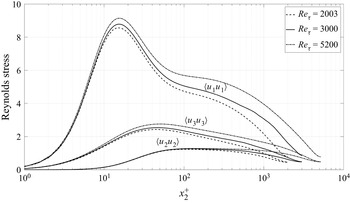
Figure 1 shows a comparison of the Reynolds normal stresses of the present DNS with the DNS of Hoyas & Jiménez (Reference Hoyas and Jiménez2006) at  $Re_\tau =2000$ and the recent DNS of Lee & Moser (Reference Lee and Moser2015) at
 $Re_\tau =5200$. The three simulations agree very well in the near wall region. The first peak of
 $u_1$, which weakly depends on the Reynolds number, lies within the two other DNS. The Reynolds number effect is clearly visible in the outer part, with the beginning of a plateau at the highest Reynolds number.
Comparison of the Reynolds stresses of the DNS of Thais et al. (Reference Thais, Tejada-Martínez, Gatski and Mompean2011) at  $Re_\tau =3000$ with the DNS of Hoyas & Jiménez (Reference Hoyas and Jiménez2006) at
 $Re_\tau =2003$ and the DNS of Lee & Moser (Reference Lee and Moser2015) at
 $Re_\tau =5200$.

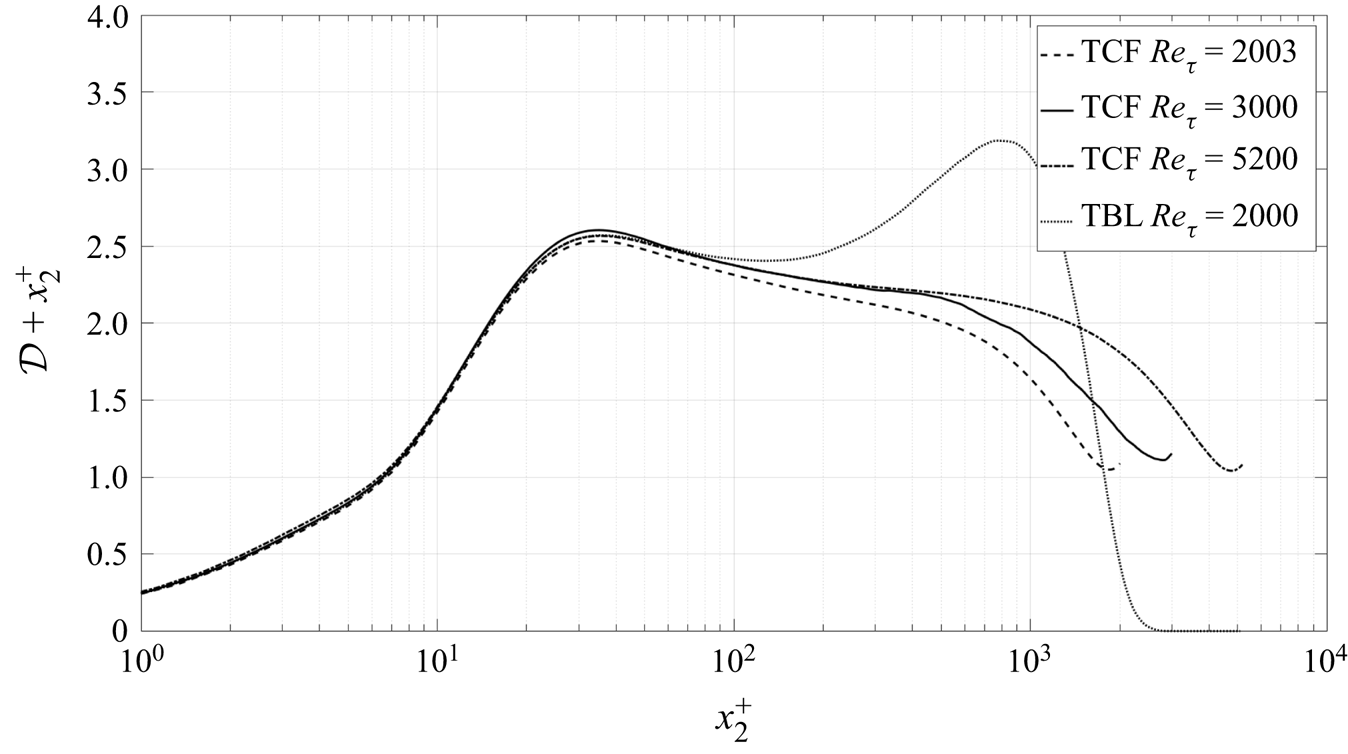
Figure 2 shows the homogeneous dissipation  $\mathcal {D}$ in inner variables along with that computed by Hoyas & Jiménez (Reference Hoyas and Jiménez2006) and Lee & Moser (Reference Lee and Moser2015) for a plane channel and the data of Sillero, Jimenez & Moser (Reference Sillero, Jimenez and Moser2013) for a zero pressure gradient (ZPG) turbulent boundary layer. Here,
 $\mathcal {D}$ was chosen instead of
 $\epsilon$ in order to compare the different data sets as not all of them provided the full dissipation. Also, the dissipation
 $\mathcal {D}^+$ has been premultiplied by the wall distance
 $x_2^+$. The reason for this representation will be justified in detail in the following, but it can already be noted that it emphasizes the Reynolds number influence in the outer part for the channel flow, the overlap region and the difference between the channel and the boundary layer in the same outer part.
Comparison of the premultiplied pseudo-dissipation  $\mathcal {D}x_2$ (2.4 of the channel flow DNS of Thais et al. (Reference Thais, Tejada-Martínez, Gatski and Mompean2011) at
 $Re_\tau =3000$ with the DNS of Hoyas & Jiménez (Reference Hoyas and Jiménez2006) at
 $Re_\tau =2003$, the DNS of Lee & Moser (Reference Lee and Moser2015) at
 $Re_\tau =5200$ and the boundary layer DNS of Sillero et al. (Reference Sillero, Jimenez and Moser2013).

4. The experiment
The experiment was carried out in the Lille turbulent boundary layer wind tunnel. The optically accessible test section has been extended to the full tunnel length, and is 1 m high, 2 m wide and 20 m long. The long length allows the development of the boundary layer so that its thickness is close to 30 cm at 20 m. The external flow has a slightly positive pressure gradient. The tunnel and flow quality have been documented in many previous papers (Carlier & Stanislas Reference Carlier and Stanislas2005; Stanislas, Perret & Foucaut Reference Stanislas, Perret and Foucaut2008; Herpin et al. Reference Herpin, Coudert, Foucaut and Stanislas2012).
Stereoscopic PIV is now a recognized method for measuring turbulent flows. Many researchers have previously used this method to compute statistics of the flow such as mean velocity, Reynolds stress tensor, probability density functions and even spectra (Adrian, Meinhart & Tomkins Reference Adrian, Meinhart and Tomkins2000; Foucaut et al. Reference Foucaut, Coudert, Stanislas and Delville2011; Herpin et al. Reference Herpin, Coudert, Foucaut and Stanislas2012). A detailed discussion of the measurement technique, and especially the validation of it, is available in Foucaut et al. (Reference Foucaut, George, Stanislas and Cuvier2021). Therefore we present only the briefest detail below.
4.1. The DP-SPIV set-up
Stereo PIV allows the measurement of the three components of the velocity in a plane with an accuracy of approximately 1 %–2 % (0.1 pixel), but the limited spatial resolution (typically millimetres) cannot easily resolve the smallest scales of the flow. To compute the dissipation components, both differentiation and statistical computations are involved; and additional difficulties arise from the noise amplification when derivatives have to be computed from discrete realizations (Foucaut & Stanislas Reference Foucaut and Stanislas2002).
The capabilities of the SPIV technique can be increased by the use of the light polarization to record velocity fields in two different planes simultaneously. When the planes are parallel, this method is called DP-SPIV (Kahler & Stanislas Reference Kahler and Stanislas2000). The dual plane technique allows the measurement of two velocity fields with an adjustable time delay or spatial separation between them. By varying this delay, the space–time correlation of the velocity field can be computed. And by varying the separation, the three-dimensional spatial correlation can be obtained. Ganapathisubramani et al. (Reference Ganapathisubramani, Hutchins, Hambleton, Longmire and Marusic2005a) used the dual plane technique to get the full gradient tensor and to study the near-wall flow structures.
In the present experiment, the field of view was imaged with two SPIV systems in two normal planes, both orthogonal to the wall. The flow was seeded using poly-ethylene glycol particles in the return circuit of the tunnel just after the fan. The particle size was of the order of  $1\ {\rm \mu}{\rm m}$ and the particle image size of the order of 1.8 pixel on the cameras. Following Raffel, Willert & Kompenhans (Reference Raffel, Willert and Kompenhans1998), such a size should lead to weak peak locking, but none was apparent in the velocity probability density functions (pdfs) shown in Foucaut et al. (Reference Foucaut, George, Stanislas and Cuvier2021).
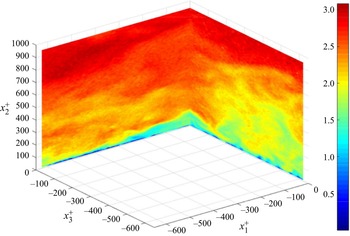
Figure 3 gives an example of instantaneous streamwise velocity field recorded with the present set-up. The images from both cameras were processed with a standard multi-grid and multi-pass algorithm with image deformation (Scarano Reference Scarano2002). The final interrogation window size was  $24 \times 32$ pixels for each plane. Such a size corresponds to a square window in the physical space of
 $1.4 \times 1.4\ {\rm mm}^2$ (
 $11.6 \times 11.6$ wall units). A mean overlap of approximately 66 % was used. The light sheet thickness varied from approximately 0.6 mm closest to the wall to 2 mm at the outermost location. Foucaut et al. (Reference Foucaut, George, Stanislas and Cuvier2021) present a detailed analysis of the spatial resolution effects on the measurements.
Example of an instantaneous streamwise velocity field using cross-plane SPIV.

4.2. Data processing and noise removal
The primary problem with using PIV for derivative measurement is the PIV noise. For example, the derivative ‘signal’ after processing, say  $s(t)$, can be presented as
 $s(t) = {d(}t) + n(t)$, where
 ${d}(t)$ is the true derivative as a function of time, and
 $n(t)$ is the ‘noise’ (or difference) between the true and measured signal;
 $n(t)$ can be thought of as a square wave of random amplitude (see Wänström et al. Reference Wänström, George, Meyer and Westergaard2007). So squaring and averaging yields
 $\langle s^2 \rangle = \langle d^2 \rangle + \langle n^2 \rangle$. Note that we have assumed the noise to be uncorrelated with the signal. For derivative measurement using SPIV,
 $\langle n^2 \rangle$ can be greater than
 $\langle d^2 \rangle$, even sometimes much greater.
If, however, both planes are perpendicular and cross each other, additional information about the spatial properties of the flow can be obtained (Ganapathisubramani et al. Reference Ganapathisubramani, Longmire, Marusic and Pothos2005b; Hambleton, Hutchins & Marusic Reference Hambleton, Hutchins and Marusic2006). But more importantly for the present experiment, it provides a unique opportunity to evaluate noise-free derivative moment by choosing each term in the derivative product from different planes (since the noise is uncorrelated between the two planes). For example, if  $s_1(t)$ and
 $s_2(t)$ measure the same velocity but from different planes, then their cross-correlation is given by
 \begin{equation} \langle s_1(t) s_2(t) \rangle = \langle d_1(t) d_2(t) \rangle + \langle n_1(t) n_2(t) \rangle. \end{equation}
But  $\langle d_1(t) d_2(t) \rangle = \langle d(t)^2 \rangle$ if they measure the same (or nearly the same) interrogation volume. And since the noise sources are statistically independent (or at least uncorrelated),
 $\langle n_1(t) n_2(t) \rangle = 0$. This eliminates a primary source of noise in the estimation of the dissipation since almost all the derivative moments are squared quantities.
The other ‘trick’ used here was to employ the continuity equation multiplied by one of the derivatives of interest, i.e.
 \begin{equation} \frac{\partial u_m}{\partial x_n} \left[ \frac{\partial u_1}{\partial x_1} + \frac{\partial u_2}{\partial x_2} + \frac{\partial u_3}{\partial x_3}\right] = 0 . \end{equation}
Setting  $m,n = 1$ for example yields:
 \begin{equation} \left[\frac{\partial u_1}{\partial x_1}\right]^2 ={-} \left[\frac{\partial u_1}{\partial x_1}\frac{\partial u_2}{\partial x_2} + \frac{\partial u_1}{\partial x_1}\frac{\partial u_3}{\partial x_3}\right]. \end{equation}
So all of the diagonal terms in the dissipation tensor can be computed from ‘noise-free’ cross-moments. Finally, derivatives were also computed using the ‘de-noising’ methodology of Foucaut & Stanislas (Reference Foucaut and Stanislas2002).
4.3. Temporal and spatial resolution
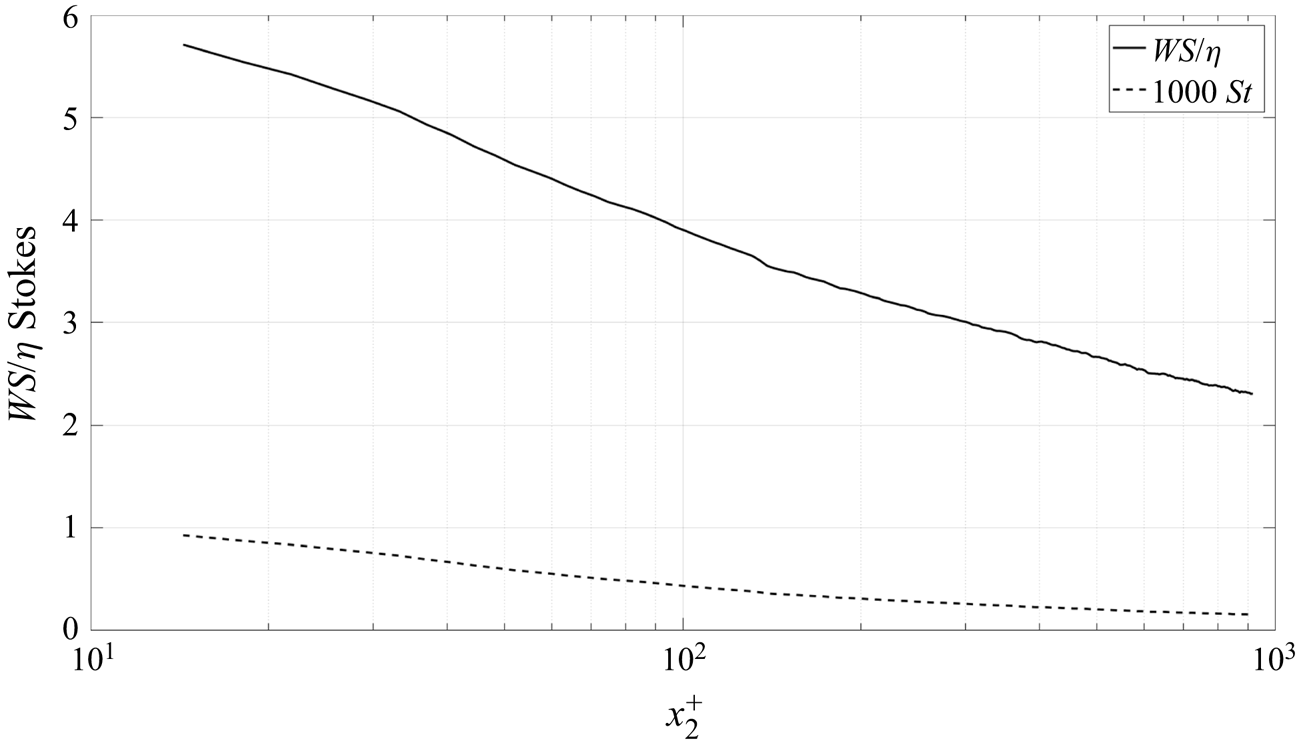
Figure 4 shows that the time scale ratio for the scattering particles (sometimes referred to as Stokes number,  $St^+$) is much less than one. So indeed the particles contributing to the velocity in the interrogation volume can be assumed to follow the flow at the dissipative scales.
Interrogation window size WS normalized by the Kolmogorov microscale,  $(\nu /\epsilon )^{1/4}$ and particle time scale normalized by the Kolmogorov microtime scale,
 $(\nu /\epsilon )^{1/2}$. Wall distance
 $x_2$ normalized by
 $\nu /u_\tau$ using the data in table 1.

Experimental flow parameters.  $U_e$ external velocity,
 $\delta$ boundary layer thickness,
 $\delta *$ displacement thickness,
 $\theta$ momentum thickness,
 $u_{\tau}$ wall friction velocity,
 $R_{e\theta}$ momentum Reynolds number,
 $R_{e\tau}$ friction Reynolds number,
 $C_f$ friction coefficient.

Also shown in figure 4 is the ratio of largest dimension of the SPIV interrogation window size, say  $WS$, to the Kolmogorov microscale,
 $\eta = (\nu ^3/\epsilon )^{1/4}$, estimated from the data. The values range from
 $2$ at the outermost points of our measurement to
 $6$ at the innermost. These are almost identical to those reported by Balint et al. (Reference Balint, Wallace and Vukolavcevic1991) and Honkan & Andreopoulos (Reference Honkan and Andreopoulos1997), suggesting any differences cannot be attributed to the size of the averaging volume. Here, thanks to the overlap of 66 % of the interrogation windows (which gives a grid point in the data every
 $4 \eta$ at worst, with 33 % of new information in the interrogation window), one can expect an effective spatial resolution slightly better than the interrogation window size
 $WS$ that is varying between 5
 $\eta$ and
 $\eta$ from the wall outward.
Since approximately 99 % of the dissipation lies at spectral wavenumbers  $k$ below
 ${k \eta =1}$, it requires
 $WS \le {\rm \pi}\eta$ (George & Taulbee Reference George and Taulbee1992) to resolve the entire derivative spectrum. But since
 $\epsilon$ is an integral under the dissipation spectrum which has a long exponential tail, somewhat larger ratios are indicated to be acceptable (Wyngaard Reference Wyngaard1968; Ewing et al. Reference Ewing, Hussein and George1995; Ewing & George Reference Ewing and George2000). So for most of our flow spatial filtering should not be an issue, except perhaps at the closest wall positions. The whole subject of spatial filtering is of considerable interest, and is addressed in detail in Foucaut et al. (Reference Foucaut, George, Stanislas and Cuvier2021).
5. Experimental results
This section presents the measured derivative moments and compares them with earlier measurements and DNS. For the purpose of conciseness, only some representative samples are presented here. The whole set of data and plots are made available as complementary electronic material to the paper.
5.1. Experimental parameters and velocity moments
The present experiment was carried out at a Reynolds number  $R_\theta$ of 7634 (
 $\delta ^+$ of 2598) which corresponds to a free stream velocity of
 $3\ {\rm m}\ {\rm s}^{-1}$. Table 1 summarizes the important boundary and integral parameters for this experiment.
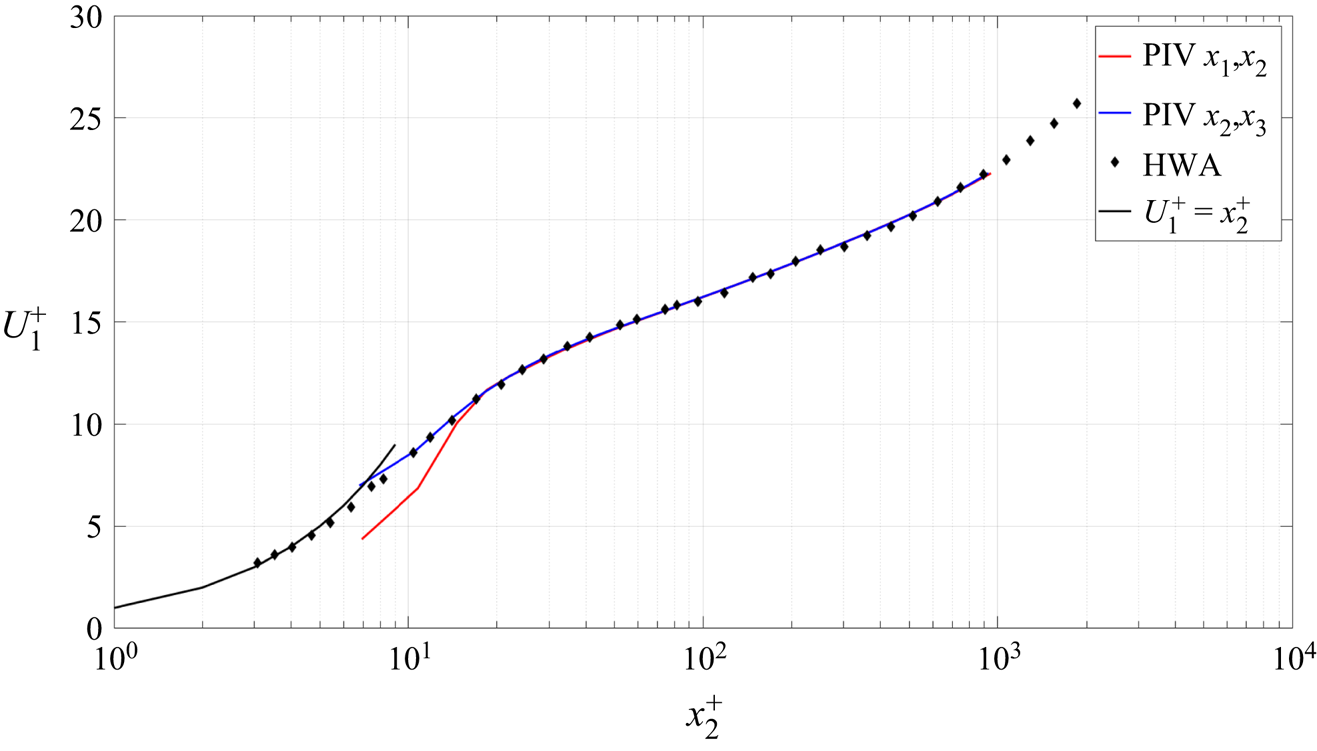
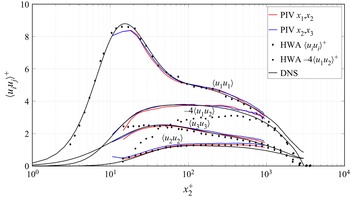
Figure 5 shows the mean streamwise velocity measured from the two PIV planes and compares it with hot-wire anemometry (HWA) data. Figure 6 gives the turbulence intensity profiles measured from the same two PIV planes, also compared with HWA and DNS data. These results are in very good agreement above 15 wall units, except for the spanwise turbulence intensity component  $\sqrt {\langle u_3^2 \rangle }$ from the hot-wire in figure 6. These data obviously depart from the PIV and the DNS below 40 wall units. This can be attributed to hot-wire errors resulting from the mean velocity gradient at the scale of the X-wire probe and cross-flow errors from the increasing local turbulence intensity near the wall, neither of which can be taken into account by calibration. For the same component, the data from the
 $x_1x_2$ plane are a bit lower very near the wall than the
 $x_2x_3$ and DNS ones as the
 $u_3$ component is out of plane in the
 $x_1x_2$ plane. As far as
 $\sqrt {\langle u_1^2 \rangle }$ is concerned, the peak level is slightly underestimated by both PIV planes and the
 $x_1x_2$ measurements seem more sensitive to the limited spatial resolution. Finally, also close to the wall,
 $\sqrt {\langle u_2^2 \rangle }$ is in good agreement between the PIV and hot-wire data (especially in the
 $x_1x_2$ plane), but departs from the DNS when approaching the wall. This can be attributed to a lack of spatial resolution in both cases, aggravated by the fact that this is the smallest component of the three. Beside these very near-wall problems, the agreement is quite good between the two PIV planes, the HWA and the DNS.
Mean velocity profiles of the two PIV planes compared with hot-wire data of Carlier & Stanislas (Reference Carlier and Stanislas2005) (with permission of Exp. Fluids).

Turbulence intensity profiles of the two PIV planes compared with hot-wire data of Carlier & Stanislas (Reference Carlier and Stanislas2005) and DNS data of Thais et al. (Reference Thais, Tejada-Martínez, Gatski and Mompean2011).

5.2. Measured derivative moments
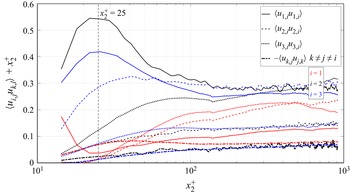
The derivatives were computed by the methods described briefly in § 4.2, and in detail in Foucaut et al. (Reference Foucaut, George, Stanislas and Cuvier2021). Based on the accuracy analysis performed in Foucaut et al. (Reference Foucaut, George, Stanislas and Cuvier2021), the data are supposed to be valid to within a few per cent for  $x_2^+> 25$, indicated by the vertical dashed line in the plots. But as will be seen, this analysis does not take into account the spatial filtering. The term
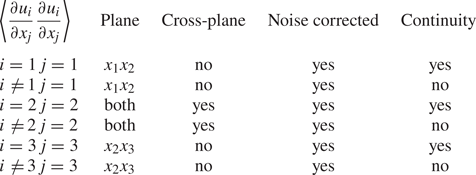
 $\langle (\partial u_3 / \partial x_1) (\partial u_1/\partial x_3) \rangle$ was computed only at the intersection of the two SPIV planes and cannot therefore be averaged along one of the two planes, so it shows more scatter than the other profiles. Table 2 summarizes how each derivative moment was obtained and which corrections were applied. Details on the corrections are given in Foucaut et al. (Reference Foucaut, George, Stanislas and Cuvier2021).
Summary showing how each squared derivative moment was obtained. Details on the corrections are given in Foucaut et al. (Reference Foucaut, George, Stanislas and Cuvier2021).

Figure 7 shows profiles of all twelve derivative moments contributing to the true dissipation  $\epsilon$ (2.7) as linear–log plots premultiplied by
 $x_2^+$. It is clear that the derivative moments are not all the same. Ratios of 10 or even more are observed near
 $x_2^+ = 20$. This has an interesting experimental consequence: it is probably not necessary to measure all the components of
 $\epsilon$ to have a good estimation of it. In particular, it should be noted that all cross-products are negative. The question of whether the derivative moments are locally homogenous, locally axisymmetric or locally isotropic will be addressed in detail in §§ 6 to 8, together with the question of their individual contributions to the total dissipation. Note that even though many moments peak strongly near the wall, some go to zero at
 $x_2 = 0$. Note also that none of our measurements go to zero at large values of
 $x_2$ since measurements were not taken outside of the overlap (or log) region.
Linear–log plot of all the SPIV dissipation derivatives moments premultiplied by  $x_2^+$ as a function of wall distance.

In figure 7 all the derivative moments have been multiplied on purpose by  $x_2$. This puts clearly in evidence what will be a key result of the present contribution: the fact that the dissipation terms behave at least approximately as
 $1/x_2^+$ in the overlap region. George & Castillo (Reference George and Castillo1997) and Wosnik, Castillo & George (Reference Wosnik, Castillo and George2000) argue from near asymptotics that the dissipation in the overlap region of a channel or pipe flow varies as
 $1/x_2$; i.e.
 $\epsilon ^+ = D / x_2^+$, where
 $D$ depends weakly on
 $\ln \delta ^+$ and is asymptotically constant. The result is exact for a parallel flow homogeneous in the streamwise direction. George & Castillo (Reference George and Castillo1997) argue it is at least approximately true for zero pressure gradient boundary layers even if it varies as a power law
 $\epsilon ^+ \propto D_i/{x_2^+}^{1-\gamma }$ since
 $\gamma$ is a small parameter which decreases with increasing
 $\ln \delta ^+$. In figure 7, all derivatives multiplied by
 $x_2^+$ are effectively nearly constant, but it is impossible to tell whether the power is exactly
 $-1$ or simply close to it. This is consistent with the arguments of George & Castillo (Reference George and Castillo1997) that the overlap region of a boundary layers is slightly different from channel flow due to the streamwise inhomogeneity of the flow. For the mean velocity and turbulence velocity moments this implies weak power law profiles instead of logarithmic profiles.
5.3. Comparison with DNS and previous hot-wire results
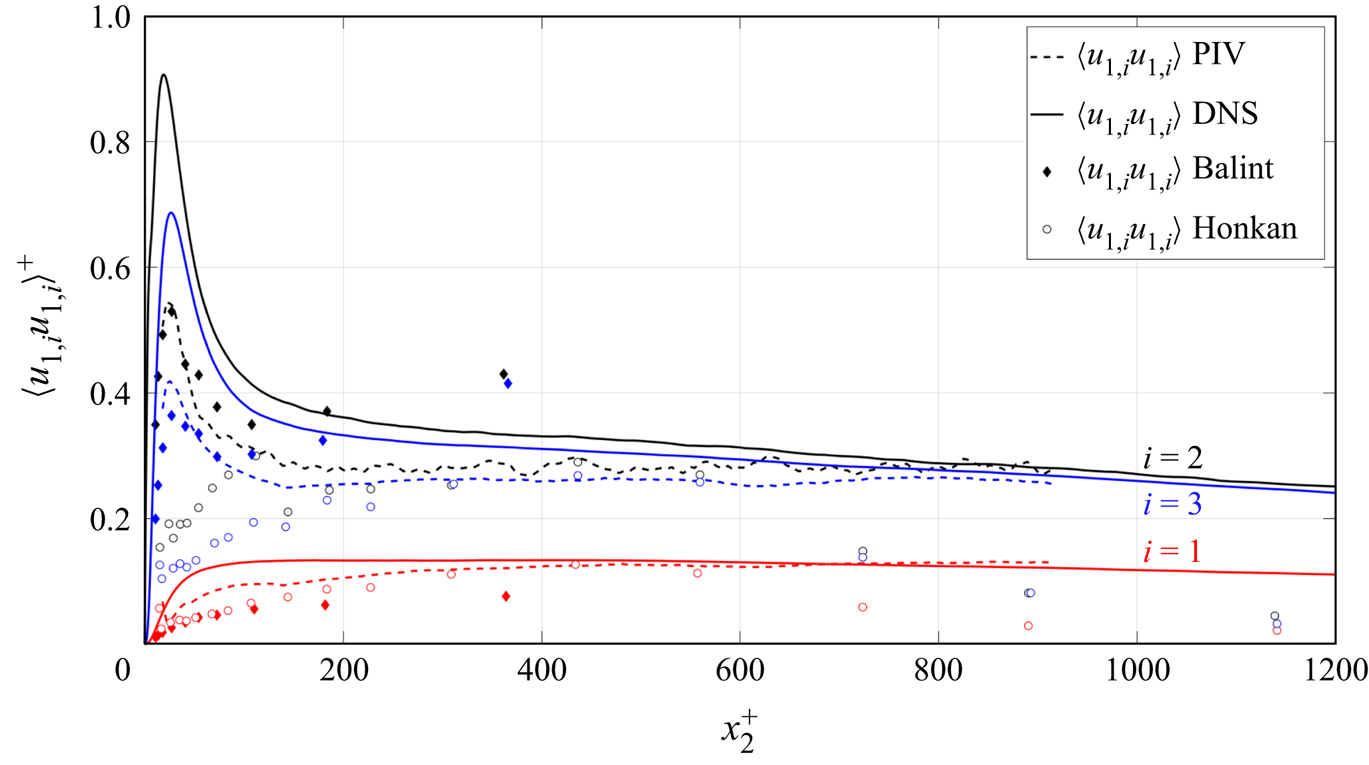
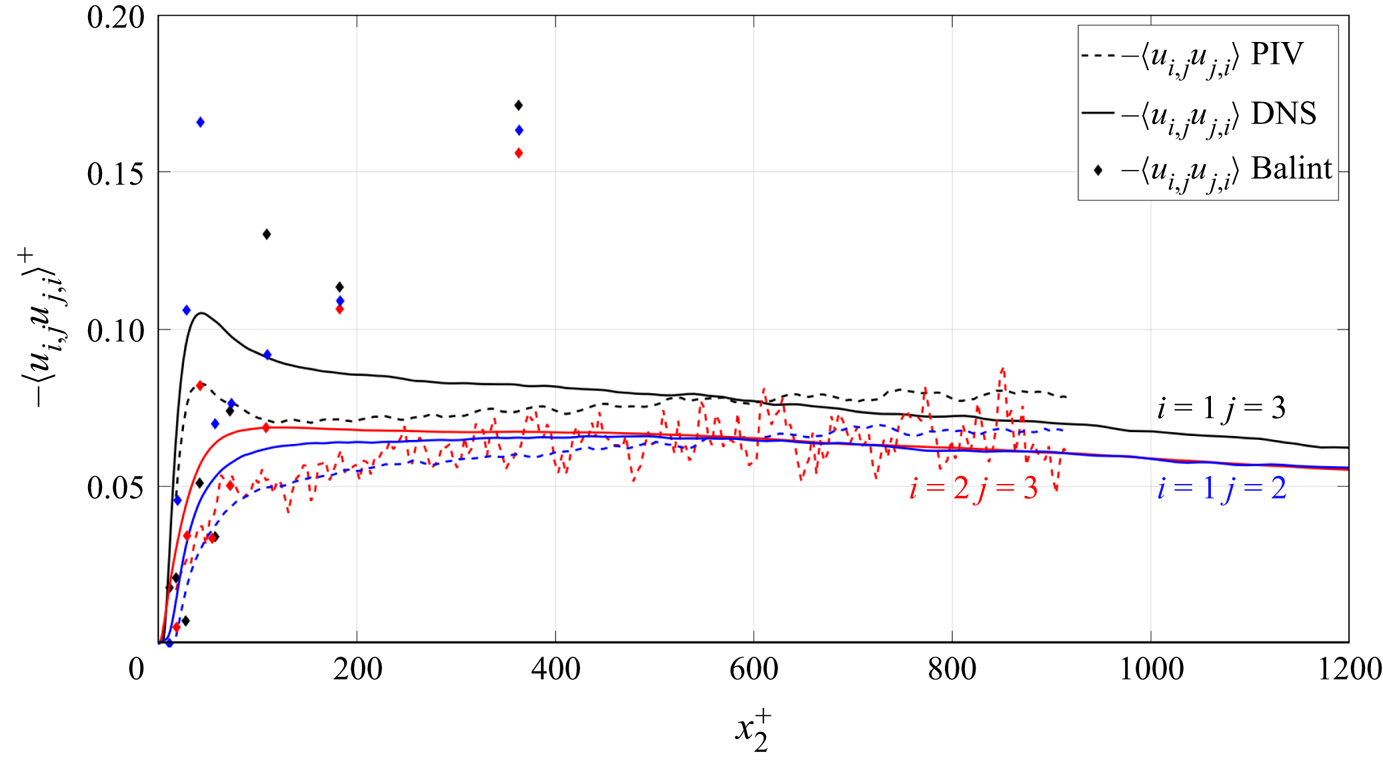
Figures 8 and 9 show respectively the normal moments involving  $u_1$ and the cross-derivative moments (the other moments comparisons are provided as supplementary material available at https://doi.org/10.1017/jfm.2022.699). These data are compared with the channel flow DNS described in § 3 and previous hot-wire measurements of Balint et al. (Reference Balint, Wallace and Vukolavcevic1991) and Honkan & Andreopoulos (Reference Honkan and Andreopoulos1997). All data are premultiplied by
 $x_2^+$ to evidence the differences. Despite an underestimation of the near-wall peak by SPIV due to the lack of spatial resolution in this region, the agreement between the SPIV and the channel flow DNS is quite gratifying, notably for
 $\langle u_{1,1}u_{1,1} \rangle$ and
 $\langle u_{2,3}u_{3,2} \rangle$. This agreement is fairly good for the other moments for
 $y^+ > 500$. For several moments, a difference of behaviour is observed in the overlap region: the SPIV data appear relatively constant while the DNS data decrease slowly away from the wall. As will be seen later, this is also observed for the dissipation. This phenomenon is attributed to the difference in flow nature between the SPIV boundary layer and the DNS channel flow.
Comparison of SPIV derivative moments involving  $u_1$ with DNS of Thais et al. (Reference Thais, Tejada-Martínez, Gatski and Mompean2011) and hot-wire results of Balint et al. (Reference Balint, Wallace and Vukolavcevic1991) and Honkan & Andreopoulos (Reference Honkan and Andreopoulos1997).

Comparison of SPIV derivative cross-products with channel DNS of Thais et al. (Reference Thais, Tejada-Martínez, Gatski and Mompean2011) and hot-wire results of Balint et al. (Reference Balint, Wallace and Vukolavcevic1991) and Honkan & Andreopoulos (Reference Honkan and Andreopoulos1997).

The situation is not the same for the previous measurements of Balint et al. (Reference Balint, Wallace and Vukolavcevic1991) and Honkan & Andreopoulos (Reference Honkan and Andreopoulos1997). For the variances, the results of Balint et al. (Reference Balint, Wallace and Vukolavcevic1991) are in reasonable agreement with the DNS and the present data, except for  $\langle u_{3,1} u_{3,1} \rangle$ (not shown) which is very low. The cross-derivative moments are quite far off. This underestimation of the variances could be due to the difference in Reynolds number (which is not that large), but more likely is a consequence of limitations of hot-wire techniques. Concerning the data of Honkan & Andreopoulos (Reference Honkan and Andreopoulos1997), it appeared in the course of the preparation of this paper that the
 $\epsilon$ values in Honkan & Andreopoulos (Reference Honkan and Andreopoulos1997) were by error multiplied by 2 (this was confirmed by one of the authors). It was supposed here that the same error affects the individual variances (the cross-moments were not provided in Honkan & Andreopoulos Reference Honkan and Andreopoulos1997), so all their moments were divided by 2. They then come globally much closer to the other data. As can be seen in figure 8, the agreement is quite good for
 $\langle u_{1,1}u_{1,1} \rangle$. It is also good for the other moments beyond
 $x_2^+ = 200$.
The agreement is good as well for all the moments not shown and provided as supplementary material figures. In any case, the hierarchy of the different variances is coherent with the other data (see extra material). Close to the wall, the present SPIV results definitely underestimate the DNS derivative moments due to the spatial filtering of the smaller scales by the finite SPIV interrogation window (which is approximately  $5\eta \times 5\eta$ in the present case). Farther away from the wall (outside
 $x_2^+ > 50$) the present results are in relatively good agreement with Balint et al. (Reference Balint, Wallace and Vukolavcevic1991) for some of the moments. It is difficult to find an explanation for the discrepancies as the technique to calculate these derivatives from the multiwire probe data is quite different from the SPIV approach. It is also different for the two HWA data of Balint et al. (Reference Balint, Wallace and Vukolavcevic1991) and Honkan & Andreopoulos (Reference Honkan and Andreopoulos1997), but involves in both cases a combination of first-order spatial and time derivatives with a Taylor hypothesis to convert them to streamwise derivatives. In the SPIV, all derivatives are computed spatially on a uniform grid and using an optimized derivative filter.
5.4. Dissipation and production
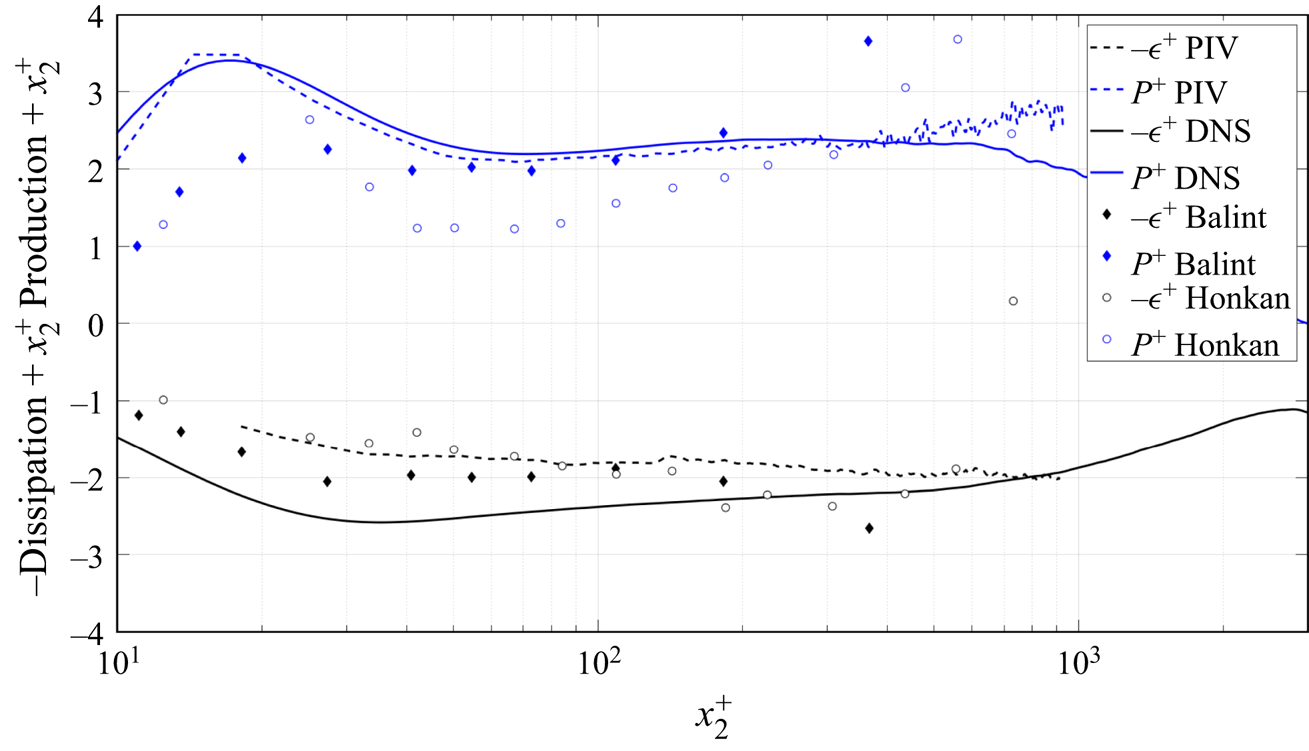
Figure 10 shows the dissipation and production rates from the SPIV and DNS, along with those of Balint et al. (Reference Balint, Wallace and Vukolavcevic1991), Honkan & Andreopoulos (Reference Honkan and Andreopoulos1997) and Andreopoulos & Honkan (Reference Andreopoulos and Honkan2001). (Note the dissipation data of Andreopoulos & Honkan (Reference Andreopoulos and Honkan2001) have been divided by 2 since the data reported in the paper were in error. This is in agreement with a discussion with Professor Andreopoulos.) The data are presented on a linear–logarithmic plot, premultiplied by  $x_2^+$. For the production term, which is based on the Reynolds stresses themselves, SPIV is in fairly good agreement with the DNS, and between
 $x_2^+ = 40$ and
 $200$ with Balint et al. (Reference Balint, Wallace and Vukolavcevic1991). The data of Honkan & Andreopoulos (Reference Honkan and Andreopoulos1997) and Andreopoulos & Honkan (Reference Andreopoulos and Honkan2001) appear to underestimate the production near the wall and to overestimate it above
 $x_2^+ = 400$. This could possibly be attributed to a constant additive noise. For the dissipation, the SPIV data are in good agreement near the wall with the measurements of Balint et al. (Reference Balint, Wallace and Vukolavcevic1991) and Andreopoulos & Honkan (Reference Andreopoulos and Honkan2001), but all of them are below the DNS data for
 $x_2^+$ lower than approximately
 $200$. This can be attributed to the difference in spatial resolution in the very near-wall region. The nearly horizontal dissipation data from approximately
 $100 \le x_2^+ \le 800$ of both the SPIV and the Honkan & Andreopoulos (Reference Honkan and Andreopoulos1997) data suggest a near
 $1/x_2^+$ behaviour in this region. This result is somewhat supported by the DNS data of Sillero et al. (Reference Sillero, Jimenez and Moser2013) presented in figure 2. This will be discussed in detail below but it is already interesting to note that, in the same region, the DNS data for
 $\epsilon$ seem to depart slightly from this
 $1/x_2^+$ behaviour.
The dissipation rate  $\epsilon$ and production rate in inner variables (linear–logarithmic) for DNS (Thais et al. Reference Thais, Tejada-Martínez, Gatski and Mompean2011) and SPIV along with Balint et al. (Reference Balint, Wallace and Vukolavcevic1991) and Andreopoulos & Honkan (Reference Andreopoulos and Honkan2001) data. The data are pre-multiplied by
 $x_2^+$.

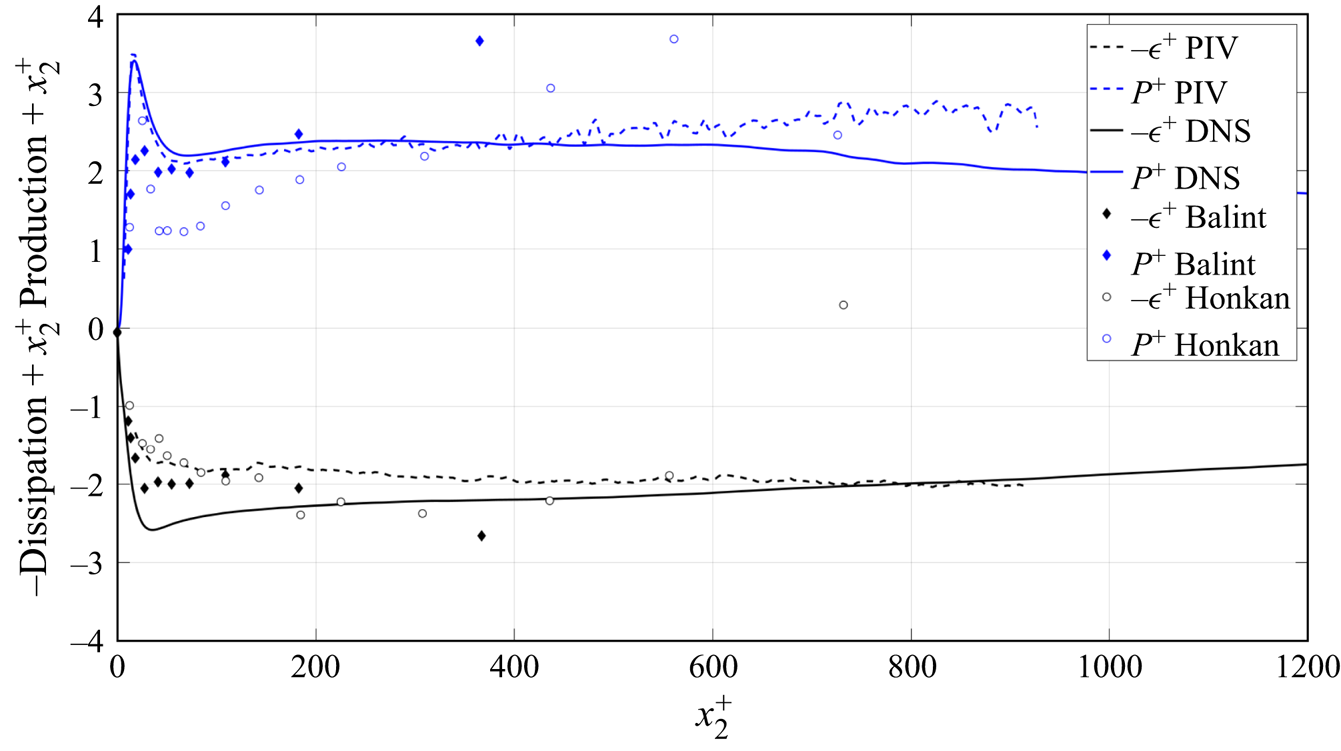
It is commonly assumed that the near-wall peaks mean that the near-wall region dominates the overall dissipation for the boundary layer. That the opposite is true is clear from a linear–linear plot of the present data in figure 11. The long tail with increasing distance from the wall is the primary contributor to the integrated dissipation across the boundary layer. In fact, since the near-wall peak is fixed in inner variables,  $x_2^+ = x_2 u_\tau /\nu$, while the tail is in outer variables, say
 $x_2/\delta _{99}$, the relative contribution to the integral shifts progressively away from the wall as the Reynolds number increases (cf. George & Castillo Reference George and Castillo1997). At high Reynolds number the dissipation contribution to the boundary layer should be just an integral under the ‘tail’, most of which is in the overlap (or ‘log’) region.
The dissipation rate  $\epsilon$ and production rate in inner variables (linear–linear) for DNS (Thais et al. Reference Thais, Tejada-Martínez, Gatski and Mompean2011) and SPIV along with Balint et al. (Reference Balint, Wallace and Vukolavcevic1991) and Andreopoulos & Honkan (Reference Andreopoulos and Honkan2001) data. The data are pre-multiplied by
 $x_2^+$.

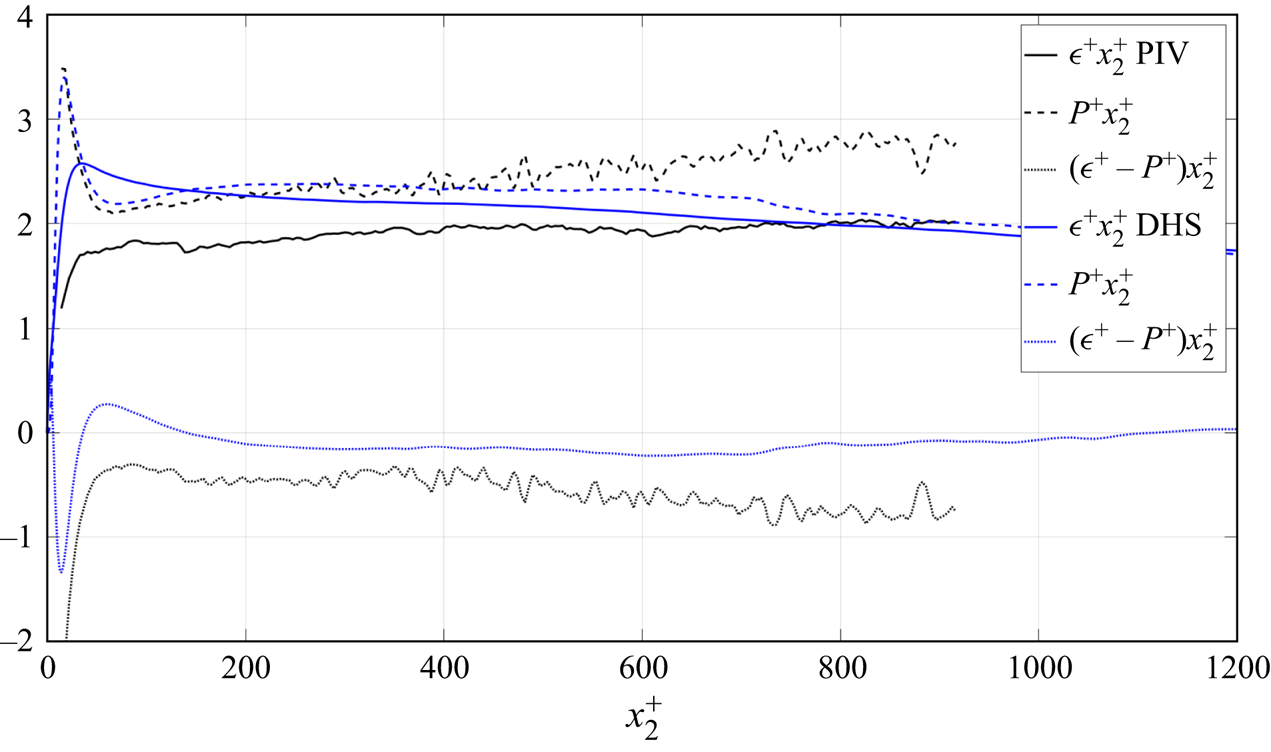
Figure 12 shows a plot of the production and dissipation times  $x_2^+$, along with a plot of the difference
 $\epsilon ^+ - \mathcal {P}^+$ (which is negative and corresponds to all the other terms of the transport equation for the TKE) as obtained from the boundary layer SPIV and channel DNS data. Looking first at the DNS, it is interesting to note that the peak of production is located at
 $x_2^+ = 15$, which is also the peak of TKE, while the peak of
 $\epsilon ^+$ is around
 $x_2^+ = 35$. The region where both terms are nearly equal is clearly visible and the difference (mostly diffusion) is nearly constant for
 $200 < x_2^+ < 800$. For SPIV, there is a larger difference between production and dissipation. Below
 $x_2^+ = 400$, part of this could be explained by the spatial filtering of PIV (corresponding to an interrogation window size
 $WS$ in figure 4 larger than 3 Kolmogorov units). Balint et al. (Reference Balint, Wallace and Vukolavcevic1991) also observed the same difference. They further noted that the suggestion of Tennekes & Lumley (Reference Tennekes and Lumley1972) that production and dissipation should be equal in the overlap region seemed to be only approximately satisfied in their measurements. The only other term in the energy balance that could be significant in this region is the turbulence transport term. The slight deviation from horizontal of the production is most likely due to the need for a virtual origin to account for the mesolayer (George & Castillo Reference George and Castillo1997; Wosnik et al. Reference Wosnik, Castillo and George2000), or that it should be described by a power law slightly different from
 $-1$.
Linear plot of the SPIV energy balance premultiplied by  $x_2$ in inner variables; i.e. production,
 $P^+ = x_2^+\langle uv \rangle ^+ \,{\rm d}U^+/{\rm d}\kern 0.06em x_2^+$ (broken), dissipation
 $x_2^+ \epsilon ^+$ (plain) and difference between these two terms
 $(\epsilon ^+ - P^+)x_2^+$.

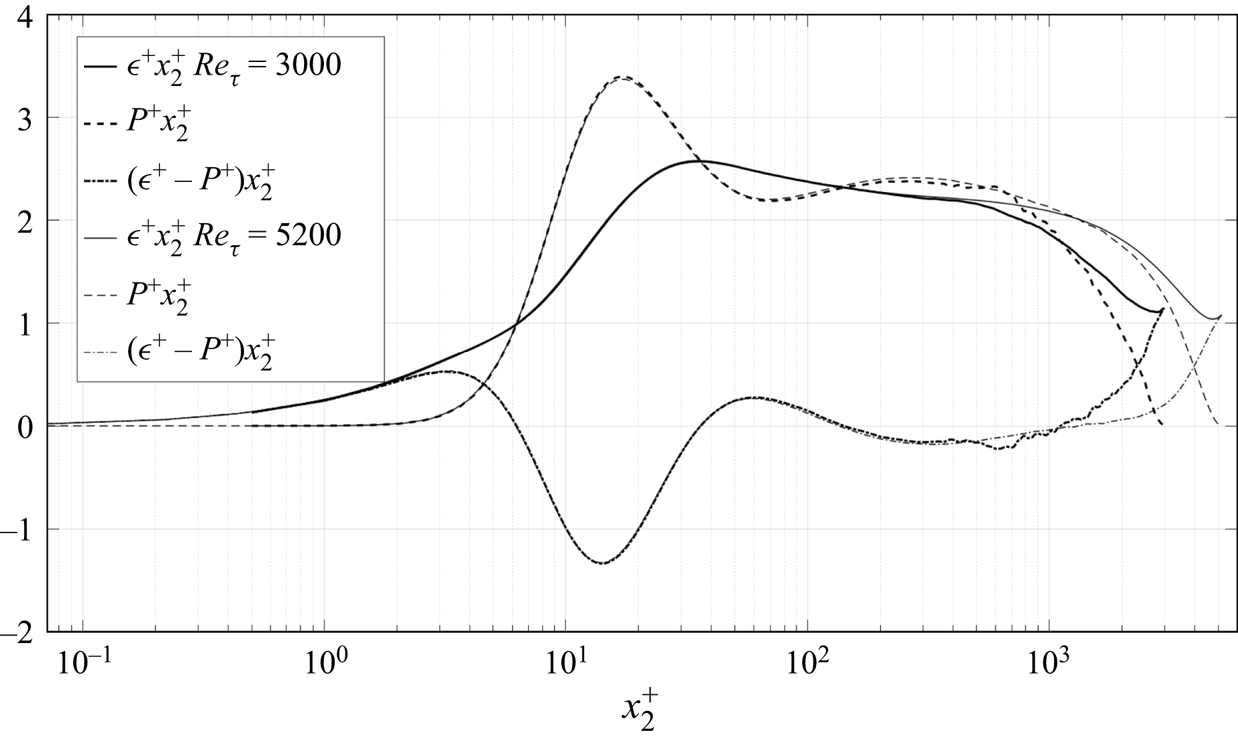
Figure 13 shows a similar plot for the channel DNS, this time in logarithmic representation. Two sets of data are provided: the present DNS data of Thais et al. (Reference Thais, Tejada-Martínez, Gatski and Mompean2011) at  $Re_{\tau } = 3000$ and the DNS of Lee & Moser (Reference Lee and Moser2015) at
 $Re_{\tau } = 5200$. Up to
 $x_2^+ = 600$, the general features are comparable to the boundary layer experimental data, and again there is an approximately 10 % discrepancy. But here the difference is definitely due to transport terms in the energy balance equation. Above
 $x_2^+ = 600$, the behaviour of the channel data changes significantly from the boundary layer. It is difficult to draw some definite conclusions as the boundary layer data extend only up to
 $x_2^+ = 1000$. If confirmed further away from the wall, this is most likely evidence of a different physics between the boundary layer and channel in the outer part, as seems to be supported by the DNS data of figure 2. It is of interest to note the effect of the Reynolds number between the two DNS which show a very similar behaviour and support the idea of a nearly
 $1/x_2$ behaviour of both production and dissipation in the overlap region when the Reynolds number is high enough. This idea is also supported by Smits & Marusic (Reference Smits and Marusic2011) in their figure 1.
Logarithmic plot of the DNS energy balance premultiplied by  $x_2$ in inner variables; i.e. production,
 $\langle uv \rangle ^+ \,{\rm d}U^+/{\rm d}\kern 0.06em x_2^+$ (broken), dissipation
 $x_2^+ \epsilon ^+$ (plain) and difference between these two terms (dotted), for two values of the Reynolds number by Thais et al. (Reference Thais, Tejada-Martínez, Gatski and Mompean2011) at
 $Re_{\tau } = 3000$ and Lee & Moser (Reference Lee and Moser2015) at
 $Re_{\tau } = 5200$.

It is easy to extend the near-asymptotic analysis of George & Castillo (Reference George and Castillo1997) to the transport terms. For example, for a streamwise homogeneous flow, they can be shown to be logarithmic; i.e.
 \begin{equation} \left\langle -\frac{1}{2} u_iu_i u_j \right\rangle^+{-} \frac{1}{\rho}\langle p u_j \rangle^+ + 2 \nu \langle u_i {\mathsf{s}}_{ij} \rangle ^+ = T\ln x_2^+ + S, \end{equation}
where  $T$ and
 $S$ are related to the logarithmic profile counterparts of the velocity profile. As a result, the derivative in the wall-normal direction is
 $1/x_2^+$, exactly as observed in figure 2. In the overlap region of a channel flow the mean convection terms of the equation for the turbulent kinetic energy are exactly zero and the viscous terms are negligible, so the overall energy balance reduces to just
 \begin{equation} 0 = \frac{{\rm d}}{{\rm d}\kern 0.06em x_2^+} \left\{-\frac{1}{2} \langle u_iu_iu_j \rangle^+{-} \frac{1}{\rho}\langle p u_j \rangle^+{+} 2 \nu \langle u_i {\mathsf{s}}_{ij} \rangle^+ \right\} -\langle uv \rangle^+ \frac{{\rm d}U^+}{{\rm d}\kern 0.06em x_2^+} - \epsilon^+ . \end{equation}
But, at high Reynolds number, in inner variables (i.e. normalized by  $u_\tau$ and
 $\nu$),
 ${-\langle u v \rangle ^+ = 1}$ and
 ${\rm d}U^+/{\rm d}\kern 0.06em x_2^+ = 1/\kappa$ (where
 $\kappa$ is the von Kármán parameter), so it follows immediately that all the surviving terms in the overlap region vary as
 $1/x_2^+$, and
 $0 = T + (1/\kappa ) - D$.
For the boundary layer, these same transport terms vary as a weak power law for a streamwise developing flow; i.e.
 \begin{equation} -\left\langle \frac{1}{2} u_iu_i u_j\right\rangle^+{-} \left\langle\frac{1}{\rho}p u_j \right\rangle^+ + 2 \nu \langle u_i {\mathsf{s}}_{ij} \rangle^+ = T_i {x_2^+}^\beta \end{equation}
and the same conclusions can be drawn.
6. Local isotropy
By far the most common assumption by all experimenters has been the assumption of local isotropy, an idea originally introduced by Taylor (Reference Taylor1935). (Note that the deductions from the local isotropy hypothesis are often confused with implications from just continuity and local homogeneity as noted by George & Hussein Reference George and Hussein1991.) When applied to velocity derivatives, local isotropy demands that all mean square derivatives obey the isotropic relations; in particular
 $$\begin{gather} \left\langle \left[ \frac{\partial u_1}{\partial x_1} \right]^2 \right \rangle = \left\langle \left[ \frac{\partial u_2}{\partial x_2} \right]^2 \right\rangle = \left\langle \left[ \frac{\partial u_3}{\partial x_3} \right]^2 \right\rangle , \end{gather}$$
 $$\begin{gather}\left\langle \left[ \frac{\partial u_1}{\partial x_2} \right]^2 \right \rangle = \left\langle \left[ \frac{\partial u_2}{\partial x_1} \right]^2 \right \rangle = \left\langle \left[ \frac{\partial u_1}{\partial x_3} \right]^2 \right \rangle = \left\langle \left[ \frac{\partial u_3}{\partial x_1} \right]^2 \right \rangle, \end{gather}$$
 $$\begin{gather}= \left\langle \left[ \frac{\partial u_2}{\partial x_3} \right]^2 \right \rangle = \left\langle \left[ \frac{\partial u_3}{\partial x_2} \right]^2 \right \rangle = 2 \left\langle \left[ \frac{\partial u_1}{\partial x_1} \right]^2 \right \rangle, \end{gather}$$
 $$\begin{gather}\left\langle \left[ \frac{\partial u_1}{\partial x_2}\frac{\partial u_2}{\partial x_1} \right] \right\rangle = \left\langle \left[ \frac{\partial u_1}{\partial x_3}\frac{\partial u_3}{\partial x_1} \right] \right \rangle = \left\langle \left[ \frac{\partial u_2}{\partial x_3}\frac{\partial u_3}{\partial x_2} \right] \right \rangle ={-}\frac{1}{2} \left\langle \left[ \frac{\partial u_1}{\partial x_1} \right]^2 \right \rangle . \end{gather}$$
Consequently, for local isotropy, there is only one independent derivative moment so any one can be chosen. The two most popular reduce the dissipation to
 \begin{equation} \epsilon = 15 \nu \left\langle \left[ \frac{\partial u_1}{\partial x_1} \right]^2 \right\rangle = \frac{15}{2}\nu \left\langle \left[ \frac{\partial u_2}{\partial x_1} \right]^2 \right \rangle . \end{equation}
Results of both (usually obtained using Taylor's hypothesis) are often cited side by side in the literature, even though they often yield very different answers. Antonia, Anselmet & Chambers (Reference Antonia, Anselmet and Chambers1986) and Antonia et al. (Reference Antonia, Kim and Browne1991) tabulate results from a large number of flows, almost none of which are consistent with the local isotropy assumption (see also George & Hussein Reference George and Hussein1991). Nonetheless, this local isotropy assumption is still widely used, mostly for the lack of easy alternatives. A certain amount of luck would be required to obtain a reasonable estimate from the measurement of a single derivative, especially when the Taylor hypothesis of frozen turbulence is used as well.
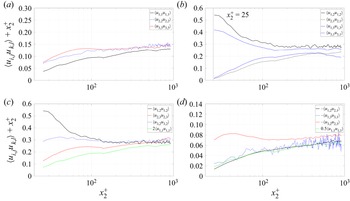
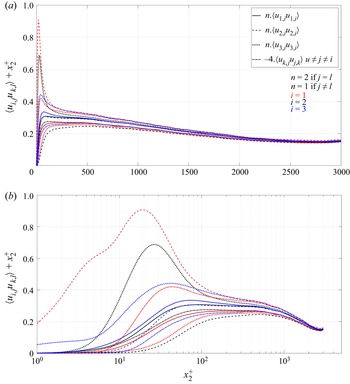
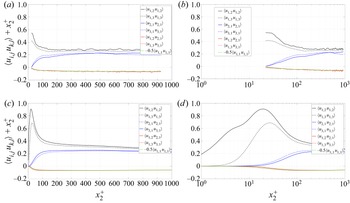
Figure 14 gives some of the SPIV derivative moments in inner variables multiplied by  $x_2^+$ in semi-log plots. The data have been plotted in groups (a) to (d) to show the expected equalities of (6.1)–(6.4), and multiplied by the appropriate factors to make them equal if the flow were locally isotropic. Figure 15 shows a more global plot with all the moments from the DNS data. Note that inside of
 $x_2^+=30$ the experimental data are affected by the limited spatial resolution, but the DNS data are not. And note also that the channel flow DNS data extend to the centre of the channel, while the boundary layer data extend only until approximately
 $x_2/\delta _{0.99} = 0.4$, which is near the outer limit of the overlap (or log) region.


Isotropy test of Thais et al. (Reference Thais, Tejada-Martínez, Gatski and Mompean2011) DNS data. See (6.1)–(6.4). Note that ordinates have been multiplied by  $x_2^+$.

Inside of  $x_2^+ = 100$, the departures from isotropy are catastrophic. The anisotropy very close the wall (
 $x_2^+ <5$) can be explained by a simple Taylor expansion of the variables there, since the continuity equation together with the boundary conditions dictates the behaviour in that region. This has already been discussed extensively by DNS and turbulence modellers (Manceau, Carlson & Gatski Reference Manceau, Carlson and Gatski2002; Gerolymos & Vallet Reference Gerolymos and Vallet2016). Outside of
 $x_2^+ = 100$, the departures from isotropy for both sets of data are of the order of 50 % or more, at least throughout the overlap region. The channel flow data show some tendency toward isotropy in the core region (
 $x_2^+ > 1000$ or so), but no definite assessment can be made for the boundary layer outside of the overlap region.
So local isotropy is clearly a very bad assumption for this boundary layer flow everywhere, at least within the overlap region and below. As they are relevant mostly below  $x_2^+ = 100$, the anisotropy diagrams for the dissipation tensors will be presented and discussed in § 9 below, and will be seen to show the same characteristics. In any case, as can be seen in figures 14 and 15, the streamwise mean square derivative,
 $\langle [\partial u_1/\partial x_1]^2 \rangle$, is a particularly bad representative of the rest. This is unfortunate since it has been historically most commonly used with time derivatives and Taylor's hypothesis to estimate dissipation in all flows.
Whether the smallest scales of motion themselves are isotropic is another matter which cannot be resolved with the current data. As noted above, this is a separate question from whether the isotropic derivative relations are approximately satisfied. (The measurements of Saddoughi & Veeravalli (Reference Saddoughi and Veeravalli1994) show that spectra from a very high Reynolds number at NASA/Ames agree reasonably well with the isotropic spectral relations at high wavenumbers. In the absence of anisotropic spectral relations, however, this does not constitute proof, since the anisotropic contributions to the spectral relations could be negligible. This is especially problematic since the anisotropy of the intensities in their experiment is only approximately 20 % or less.) Perhaps at higher Reynolds numbers the core region of the channel will tend toward isotropy – say outside of  $x_2^+ > 0.1 H^+$. This would be consistent with the spectral suggestions of George & Castillo (Reference George and Castillo1997) and the observations of George & Tutkun (Reference George and Tutkun2011) (using measurements at higher Reynolds number in the same Lille facility) that the outer part of the boundary layer only reaches a true multi-point Reynolds number independence when
 $\delta ^+ > 3000$ approximately, and even then only for
 $x_2^+ > 0.1 \delta ^+$. When these conditions are not satisfied, all scales of motion are affected by viscosity, so any Kolmogorov 41 type arguments simply cannot apply – including any tendency toward isotropy and an inertial range in the energy spectra (or structure functions).
7. Local axisymmetry
The theory of axisymmetric turbulence was developed in parallel using different methodologies by Batchelor (Reference Batchelor1954) and Chandrasekar (Reference Chandrasekar1950), but it was George & Hussein (Reference George and Hussein1991) who realized its potential applicability to the turbulence derivative moments and coined the term local axisymmetry. Also, Antonia et al. (Reference Antonia, Kim and Browne1991) were the first to apply these ideas to turbulent wall-bounded flows. One important condition, put forward by George & Hussein (Reference George and Hussein1991), is that local homogeneity is necessary for local axisymmetry to exist. Note that the whole idea of local in this context is that the axisymmetric relations only apply to quantities dominated by the smallest scales of motion. So the axisymmetric relations presented below only apply to the derivative moments, not to the velocity moments in general. George & Hussein (Reference George and Hussein1991) only developed the equations for an axis of symmetry which corresponded to the 1-axis. (Other orthogonal orientations can be obtained by simply permuting the preferred 1-axis with a different axis.) It was not obvious to them why the 1-axis should have been preferred, nor is it now. But the data seemed to suggest strongly that the derivative moments arrange into pairs (with always one single exception). Thus local axisymmetry (with the 1-axis as preferred) requires
 \begin{equation} \left.\begin{gathered}
\left\langle \left[ \frac{\partial u_1}{\partial x_2}
\right]^2 \right \rangle = \left\langle \left[
\frac{\partial u_1}{\partial x_3} \right]^2 \right
\rangle\quad \left\langle \left[ \frac{\partial
u_2}{\partial x_1} \right]^2 \right \rangle = \left\langle
\left[ \frac{\partial u_3}{\partial x_1} \right]^2 \right
\rangle, \\ \left\langle \left[ \frac{\partial
u_2}{\partial x_2} \right]^2 \right \rangle = \left\langle
\left[ \frac{\partial u_3}{\partial x_3} \right]^2 \right
\rangle\quad \left\langle \left[ \frac{\partial
u_2}{\partial x_3} \right]^2 \right \rangle = \left\langle
\left[ \frac{\partial u_3}{\partial x_2} \right]^2 \right
\rangle ,\\ \left\langle \left[ \frac{\partial
u_2}{\partial x_2} \right]^2 \right \rangle =
\frac{1}{3}\left\langle \left[ \frac{\partial u_1}{\partial
x_1} \right]^2 \right \rangle + \frac{1}{3}\left\langle
\left[ \frac{\partial u_2}{\partial x_3} \right]^2 \right
\rangle,\\ \left\langle \left[ \frac{\partial u_2}{\partial
x_3} \frac{\partial u_3}{\partial x_2}\right] \right\rangle
= \frac{1}{6}\left\langle \left[ \frac{\partial
u_1}{\partial x_1} \right]^2 \right\rangle -
\frac{1}{3}\left\langle \left[ \frac{\partial u_2}{\partial
x_3} \right]^2 \right \rangle,\\ \left\langle \left[
\frac{\partial u_1}{\partial x_2}\frac{\partial
u_2}{\partial x_1} \right] \right\rangle = \left\langle
\left[ \frac{\partial u_1}{\partial x_3} \frac{\partial
u_3}{\partial x_1}\right] \right\rangle ={-}
\frac{1}{2}\left\langle \left[ \frac{\partial u_1}{\partial
x_1} \right]^2 \right \rangle.
\end{gathered}\right\}
\end{equation}
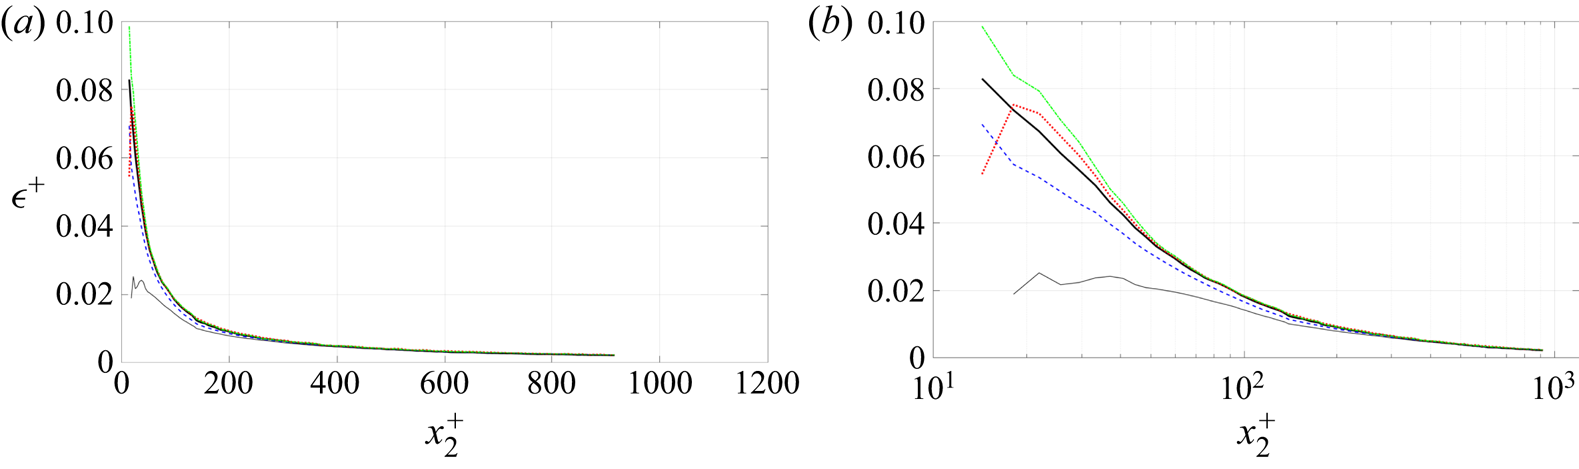
All of the above relations, which can be referenced as a ( $5\times 2$) matrix, can be and have been checked across the boundary layer using the data presented herein. Figure 16 shows some of them for SPIV and DNS data (the others are in the supplementary material). Interestingly, all appear to satisfy these relations outside of
 $x_2^+ > 100$ to an excellent approximation and some stay valid down to the wall. In fact they fail near the wall at approximately the same place as local homogeneity fails (as will be shown below).
Axisymmetry test of derivative moments from SPIV (a,b) and Thais et al. (Reference Thais, Tejada-Martínez, Gatski and Mompean2011) DNS (c,d) in both lin–lin (a,c) and lin–log plots (b,d). See (7.1): black corresponds to equation (1,1); blue to equation (1,2); red to equation (5,1) and green and red to equation (5,2). Note that ordinates have been multiplied by  $x_2^+$.

It is important to note that George & Hussein (Reference George and Hussein1991) pointed out that if the velocity derivative moments were strictly axisymmetric, then there could be no enstrophy (or dissipation) production direct from the mean shear, similar to the degeneracy of isotropy. So at least one derivative moment must not satisfy the axisymmetric relations – as in fact observed in figure 16 which shows that two relations are more approximate in the outer part and clearly fail below  $x_2^+ = 100$. As we shall see below, local homogeneity breaks down at approximately the same place, so the point appears to be moot. Interestingly, it is the equality involving the 2–3 derivative which fails most near the wall. It is the same derivative which dominates the vorticity amplification of streamwise vorticity. The present data appear to give strong support for the hypothesis of local axisymmetry outside of
 $x_2^+ =100$.
Inside  $x_2^+ =100$, is a different story. Both local axisymmetry and local isotropy fail. As noted above, the anisotropy diagrams presented in § 9.3 below exhibit the same behaviour. The reason for the failure of both inside
 $x_2^+ = 100$ will be obvious in the next section, and seen to be due to a complete failure of local homogeneity in this region, without which neither can be true.
In any case, a clear advantage of local axisymmetry is that only four derivative moments are independent, and they can be chosen for convenience. Of the many combinations possible, George & Hussein (Reference George and Hussein1991) suggested and used two for the dissipation, namely,
 \begin{equation} \epsilon \simeq \nu \left\{ \left\langle -\left[ \frac{\partial u_1}{\partial x_1} \right]^2 \right \rangle + 8\left \langle \left[ \frac{\partial u_2}{\partial x_2} \right]^2 \right \rangle + 2 \left\langle \left[ \frac{\partial u_1}{\partial x_2} \right]^2 \right \rangle + 2 \left\langle \left[ \frac{\partial u_2}{\partial x_1} \right]^2 \right \rangle \right\} ,\end{equation}
and
 \begin{equation} \epsilon \simeq \nu \left\{ \frac{5}{3} \left\langle \left[ \frac{\partial u_1}{\partial x_1} \right]^2 \right \rangle + 2 \left\langle \left[ \frac{\partial u_1}{\partial x_2} \right]^2 \right \rangle + 2 \left\langle \left[ \frac{\partial u_2}{\partial x_1} \right]^2 \right \rangle + \frac{8}{3} \left\langle \left[ \frac{\partial u_2}{\partial x_3} \right]^2 \right \rangle \right\}. \end{equation}
The first of these lends itself naturally to measurements in a plane (like planar PIV), but to our knowledge has not previously been used this way. The second is most useful for the particular configuration of parallel x-wires which can be rotated by 90 degrees. Another possibility, suited for SPIV measurements in a streamwise plane writes
 \begin{align} \epsilon &\simeq \nu \left\{ \frac{7}{3} \left\langle \left[ \frac{\partial u_1}{\partial x_1} \right]^2 \right \rangle + 4 \left\langle \left[ \frac{\partial u_2}{\partial x_2} \right]^2 \right \rangle + 2 \left\langle \left[ \frac{\partial u_1}{\partial x_2} \right]^2 \right\rangle + 2 \left\langle \left[ \frac{\partial u_2}{\partial x_1} \right]^2 \right\rangle \right\}\nonumber\\ &\quad + \nu \left\{ \frac{4}{3} \left\langle \left[ \frac{\partial u_3}{\partial x_2} \right]^2 \right \rangle + 4 \left\langle \frac{\partial u_1}{\partial x_2}\frac{\partial u_2}{\partial x_1} \right\rangle \right\}. \end{align}
Figure 17 gives a comparison of the three above estimates with the full dissipation for the SPIV data. The first estimate of (7.2) works well right to the wall because of cancellation of different terms in the sum (some derivatives which are too large are compensated by those which are too small). As noted by Antonia et al. (Reference Antonia, Kim and Browne1991) and more recently by Zhao, George & van Wachem (Reference Zhao, George and van Wachem2015) as well, the second one (7.3) fails inside of  $x_2^+ =200$. The last proposal (7.4) is fairly good down to
 $x_2^+ =50$, and then gives a slight overestimation. (In a recent paper, Zaripov, Li & Dushin (Reference Zaripov, Li and Dushin2019) apply (7.2) to high-speed planar PIV. The results shown in their figure 13 confirm the present results of figure 17 and the benefit brought by these axisymmetric formula for the estimation of the dissipation in PIV experiments.)

8. Local homogeneity
As it will be at the heart of the following discussions, it is worth mentioning here that an important consequence of the hypothesis of homogenous turbulence is that the indices of derivative moments such as those appearing in the equations for the dissipation tensor can be permuted, i.e.
 \begin{equation} \left\langle \frac{\partial u_i}{\partial x_m}\,\frac{\partial u_j}{\partial x_n} \right \rangle = \left\langle \frac{\partial u_i}{\partial x_n}\,\frac{\partial u_j}{\partial x_m} \right \rangle . \end{equation}
If the flow is also incompressible, then it follows immediately that
 \begin{equation} \left\langle \frac{\partial u_i}{\partial x_j}\,\frac{\partial u_j}{\partial x_i} \right\rangle = \left\langle \frac{\partial u_i}{\partial x_i}\,\frac{\partial u_j}{\partial x_j} \right \rangle = 0, \end{equation}
which cancels the cross-products appearing at the right of the equations for the dissipation tensor and scalar dissipation. The immediate consequence is that, in homogeneous incompressible turbulence, both  $\mathcal {D}_{ij} = {\boldsymbol{\epsilon}} _{ij}$ and
 $\mathcal {D} = \epsilon$. This is more general than the fact that the cross-products simplify themselves between the dissipation and the viscous diffusion in the equations for the Reynolds stresses and for the TKE. Here, both are zero.
The basic ideas behind local homogeneity were first introduced by Taylor (Reference Taylor1935), although he did not identify them as such. So these results were often confused with his conclusions from local isotropy, at least until George & Hussein (Reference George and Hussein1991). (Taylor's long forgotten results were independently rederived by George & Hussein (Reference George and Hussein1991), and they coined the phrase locally homogeneous, at least in the context of turbulence derivatives. Most turbulence models previously thought to depend on local isotropy or an isotropic dissipation assumption, in fact needed only local homogeneity.)
8.1. What is local homogeneity
The very idea of local homogeneity has been at the core of turbulence thinking since the beginning of modern turbulence theory (cf. Taylor Reference Taylor1935; Kolmogorov Reference Kolmogorov1941), and was the rationale behind applying spectral and structure function relations to the smallest scales of inhomogeneous flows. Curiously, while the phrase local isotropy has been in common use since Batchelor (Reference Batchelor1953), to the best of our knowledge the actual term local homogeneity appears to have first been introduced by George & Hussein (Reference George and Hussein1991). As with local isotropy and local axisymmetry, the whole idea of local homogeneity is that it only applies to statistical quantities dominated by the smallest scales of motion – in this context, the derivative moments. Thus transport terms need not be zero, and only the derivative moment relations of (8.1) need apply. This leads to the following relevant equalities:
 \begin{gather} \left.\begin{gathered} \left\langle \frac{\partial u_1}{\partial x_1} \frac{\partial u_2}{\partial x_2} \right \rangle = \left\langle \frac{\partial u_1}{\partial x_2} \frac{\partial u_2}{\partial x_1} \right\rangle \quad \left\langle \frac{\partial u_1}{\partial x_1} \frac{\partial u_2}{\partial x_3} \right\rangle = \left\langle \frac{\partial u_1}{\partial x_3} \frac{\partial u_2}{\partial x_1} \right\rangle \quad \left\langle \frac{\partial u_1}{\partial x_2} \frac{\partial u_2}{\partial x_3} \right\rangle = \left\langle \frac{\partial u_1}{\partial x_3} \frac{\partial u_2}{\partial x_2} \right\rangle,\\ \left\langle \frac{\partial u_1}{\partial x_1} \frac{\partial u_3}{\partial x_2} \right\rangle = \left\langle \frac{\partial u_1}{\partial x_2} \frac{\partial u_3}{\partial x_1} \right\rangle \quad \left\langle \frac{\partial u_1}{\partial x_1} \frac{\partial u_3}{\partial x_3} \right\rangle = \left\langle \frac{\partial u_1}{\partial x_3} \frac{\partial u_3}{\partial x_1} \right\rangle \quad \left\langle \frac{\partial u_1}{\partial x_2} \frac{\partial u_3}{\partial x_3} \right\rangle = \left\langle \frac{\partial u_1}{\partial x_3} \frac{\partial u_3}{\partial x_2} \right \rangle,\\ \left\langle \frac{\partial u_2}{\partial x_1} \frac{\partial u_3}{\partial x_2} \right \rangle = \left\langle \frac{\partial u_2}{\partial x_2} \frac{\partial u_3}{\partial x_1} \right \rangle\quad \left\langle \frac{\partial u_2}{\partial x_1} \frac{\partial u_3}{\partial x_3} \right\rangle = \left\langle \frac{\partial u_2}{\partial x_3} \frac{\partial u_3}{\partial x_1} \right \rangle\quad \left\langle \frac{\partial u_2}{\partial x_2} \frac{\partial u_3}{\partial x_3} \right\rangle = \left\langle \frac{\partial u_2}{\partial x_3} \frac{\partial u_3}{\partial x_2} \right\rangle. \end{gathered}\right\} \end{gather}
It has been noted already that, thanks to (8.2), an immediate consequence of local homogeneity and incompressibility is that  $\mathcal {D}$ as defined by (2.4) is equal to the true dissipation,
 $\epsilon$ as given by (2.3). For clarity,
 $\mathcal {D}$ has been referred to by George & Hussein (Reference George and Hussein1991) as the pseudo-dissipation and by others as the homogeneous dissipation. Some have erroneously construed this to mean that
 $\mathcal {D}$ is somehow more fundamental than
 $\epsilon$. Nothing could be further from the truth:
 $\epsilon$ is always the true dissipation;
 $\mathcal {D}$ only equals it in a homogeneous flow, and contains other terms involving rotation when the flow is not homogenous. Another consequence of homogeneity is that the mean square strain rate and mean square rotation rate are equal; i.e.
 $\langle \omega _{ij} \omega _{ij} \rangle = 2\langle {\mathsf{s}}_{ij} {\mathsf{s}}_{ij} \rangle$.
8.2. Tests of local homogeneity from experiment and DNS
The large number of derivative moment combinations available in the present experiments and DNS makes it possible to exhaustively test the local homogeneity hypothesis provided by (8.3), even for derivative combinations which do not appear in either the dissipation or the enstrophy.
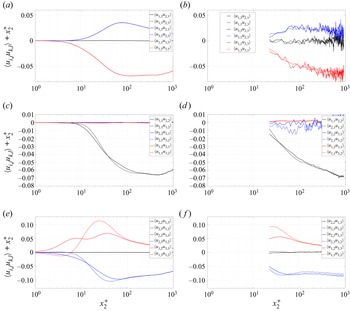
Figure 18 shows plots of the various pairs of cross-derivative moments from the BL experiment and channel DNS, which should fulfil equations (8.3) if the turbulence can be considered locally homogeneous. To help identification, (8.3) are considered here as a ( $3\times 3$) matrix of equalities which are referred to in the legend of the figure. The close correspondence of the derivative pairs outside of
 $x_2^+ =100$ is truly remarkable. Figure 18 also makes it clear that the derivative combinations which do not appear in either the dissipation or the enstrophy are in a range more than an order of magnitude smaller. A careful analysis shows that they also fulfil the local homogeneity condition in the overlap region. The general conclusion is then that outside of
 $x_2^+ =100$, local homogeneity is an excellent approximation.
Homogeneity test for derivative moments from Thais et al. (Reference Thais, Tejada-Martínez, Gatski and Mompean2011) DNS (a,c,e) and SPIV (b,d, f). Following (8.3), terms of the same colour should superimpose. Note that ordinates have been multiplied by  $x_2^+$. The correspondence with (8.3) is: (a,b) (1,2), (2,2), (3,2); (c,d) (1,1), (2,1), (3,1); (e, f) (1,3), (2,3), (3,3).

Consequently, the full dissipation  $\epsilon$ and the pseudo-dissipation
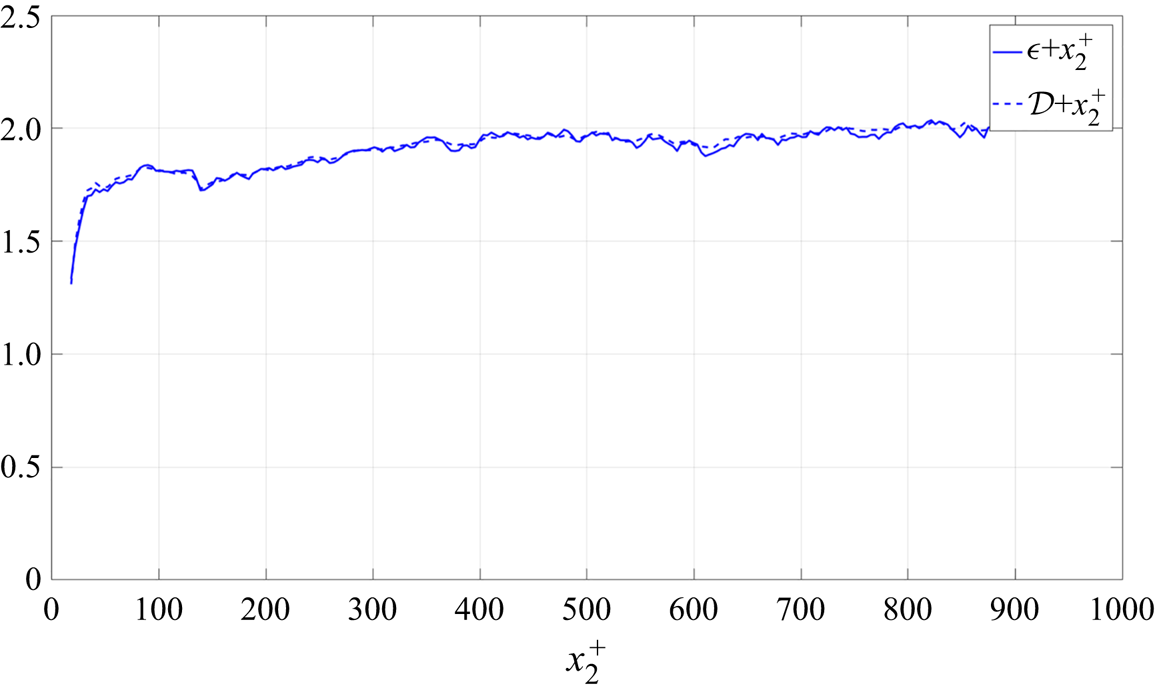
 $\mathcal {D}$ should be very close in this region. This is verified in figure 19, which provides both
 $\epsilon$ and
 $\mathcal {D}$ from the SPIV data. As can be seen, the difference is hardly visible between the two terms, confirming the validity of the local homogeneity hypothesis in the overlap and outer regions of the boundary layer.
Comparison of premultiplied full  $\epsilon$ and pseudo-
 $\mathcal {D}$ dissipation in the overlap region from SPIV data in linear–linear representation.

Inside of  $x_2^+=100$ is a different story. Note that only the DNS channel data are reliable in this region. Looking at figure 18 and at (8.3), not only are equations (2,3) and (3,3) not satisfied but all these terms should be zero due to incompressibility.
As mentioned earlier, the absence of local homogeneity inside of  $x_2^+=100$ eliminates any possibility of eventual local axisymmetry or local isotropy. This is a matter of concern as under such conditions we cannot expect to have
 ${\boldsymbol{\epsilon}} _{ij} = \mathcal {D}_{ij}$. This fact is addressed in more detail in the next section.
9. Dissipation in the near-wall region  $x_2^+ < 100$

All of our experimental and DNS data provide overwhelming evidence that the conditions for local homogeneity are not met even approximately inside of  $x_2^+ = 100$. Yet, as assumed by most of the turbulence community, the present data seem to indicate that
 $\mathcal {D} \approx \epsilon$, even close to the wall. The question which rises immediately is whether any other hypothesis exists which can explain what is happening in this very near-wall region.
9.1. The near-wall data
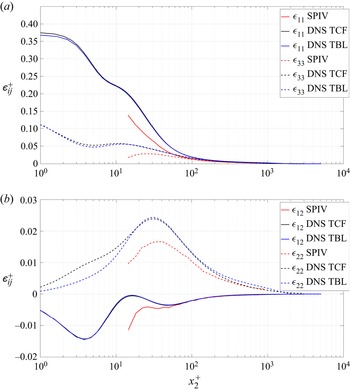
To answer this question we examine first the shape of the dissipation tensor  ${\boldsymbol{\epsilon}} _{ij}$. Figure 20 gives a lin–log plot of the main components of this tensor in the near-wall region. Data are compared from the SPIV boundary layer experiment, the present channel DNS of Thais et al. (Reference Thais, Tejada-Martínez, Gatski and Mompean2011) and the boundary layer DNS of Sillero et al. (Reference Sillero, Jimenez and Moser2013). Panel (a) gives the
 $\epsilon _{11}$ and
 $\epsilon _{33}$ diagonal terms and panel (b)
 $\epsilon _{22}$ and the main cross-term
 $\epsilon _{12}$. The first thing to notice is that the cross-term
 $\epsilon _{12}$ is negative (consistent with the fact that
 $\langle u_1u_2\rangle$ is also negative) and an order of magnitude smaller than the diagonal terms, except for
 $\epsilon _{33}$. This cross-term is in fairly good agreement with the data of Jakirlić & Hanjalić (Reference Jakirlić and Hanjalić2002) in their figure 21 and with their model given in that paper by (5.1) and (5.2). A second point to notice is that the SPIV data, although partly affected by spatial filtering, give the same tendencies as the DNS. Another very remarkable point is the nearly perfect superposition of the channel and boundary layer DNS down to the wall, which means that the dissipation physics is very similar between the two flows (This is in spite of the fact that their Taylor expansions from the wall are different, namely the non-zero second-order term arising from the streamwise pressure gradient in the channel mean velocity.). Finally, one should point out the strong anisotropy between the three diagonal terms, with a clear domination of
 $\epsilon _{11}$ over the two others.
Diagonal terms,  $\epsilon _{11}$,
 $\epsilon _{22}$, and
 $\epsilon _{33}$, of the dissipation tensor, together with the shear stress component dissipation,
 $\epsilon _{12}$ from the SPIV boundary layer experiment (SPIV), the channel (Thais et al. Reference Thais, Tejada-Martínez, Gatski and Mompean2011) DNS (TCF) and the boundary layer DNS of Sillero et al. (Reference Sillero, Jimenez and Moser2013) (TBL).

Now the key question is the behaviour of the pseudo-dissipation  $\mathcal {D}_{ij}$ compared with the true dissipation tensor
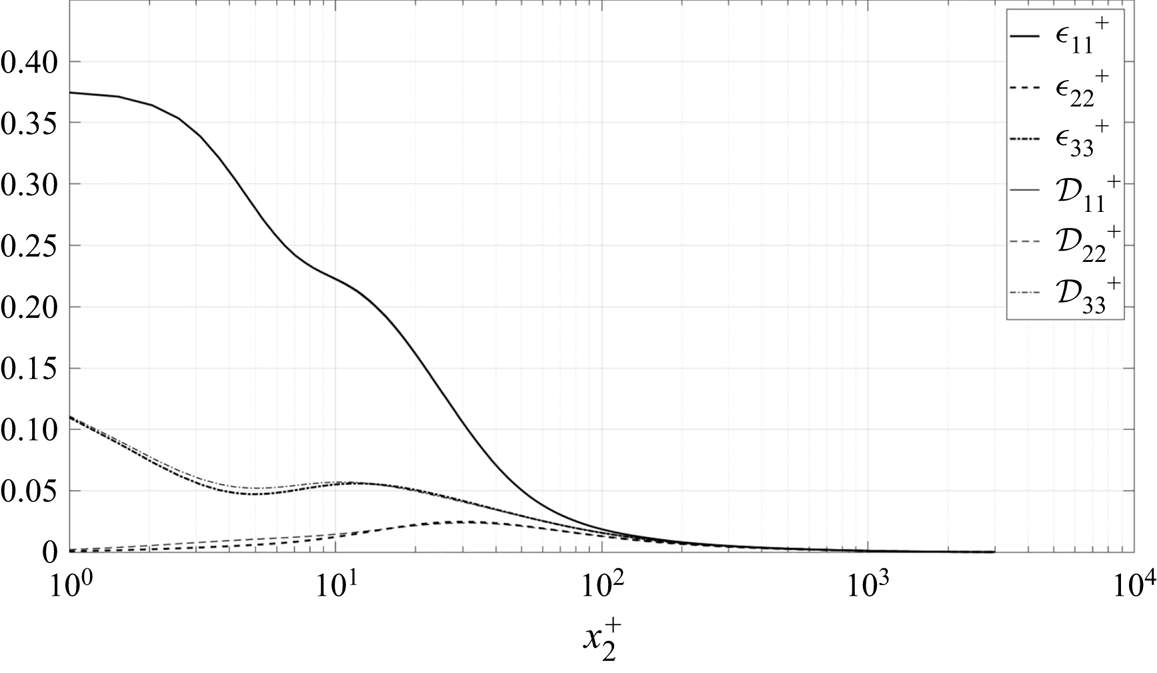
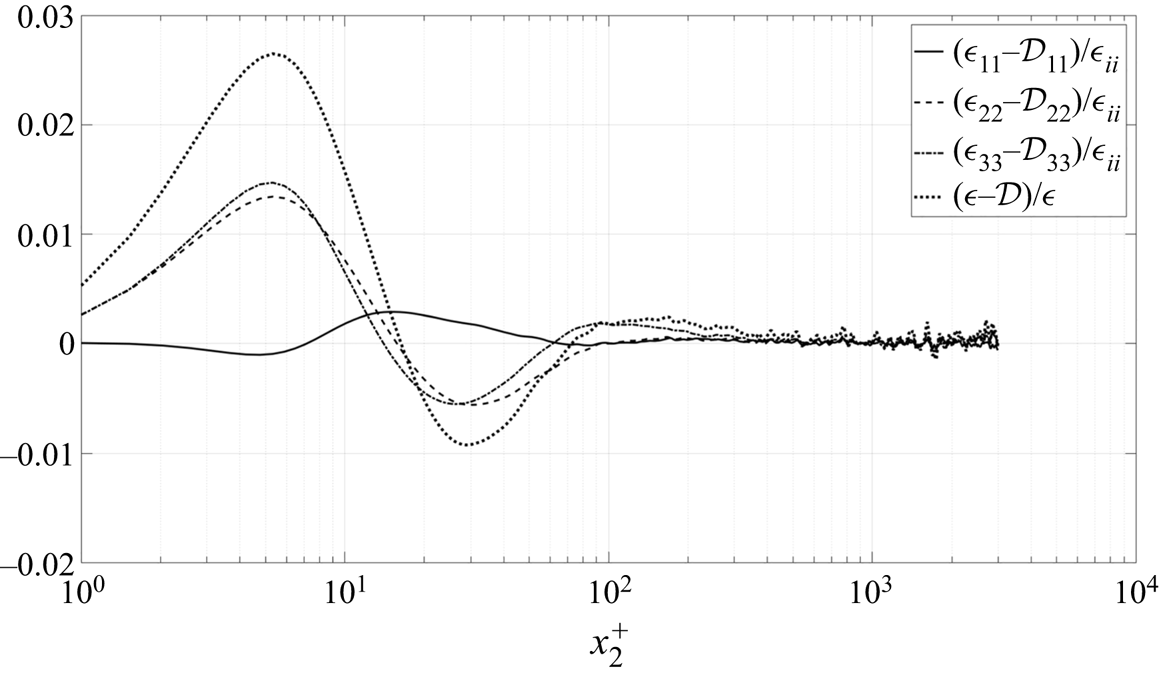
 ${\boldsymbol{\epsilon}} _{ij}$. Figure 21 gives a lin–log plot of the three diagonal components of
 ${\boldsymbol{\epsilon}} _{ij}$ (which, as shown above are the dominating ones) compared with the corresponding terms of
 $\mathcal {D}_{ij}$. The data are from the channel DNS. As can be seen, there is little difference between the corresponding components. This near equality was also noted by Antonia et al. (Reference Antonia, Kim and Browne1991) in their low Reynolds number channel DNS analysis. It is not obvious why this is true given our conclusions about the departures from local homogeneity based on figure 18.
Comparison between the true dissipation tensor diagonal terms  $\epsilon _{ii}$ and the pseudo-dissipation ones
 $\mathcal {D}_{ii}$ using data from the Thais et al. (Reference Thais, Tejada-Martínez, Gatski and Mompean2011) channel DNS.

9.2. Cross-derivative relations if the flow is only homogeneous in a plane
Clearly none of the above analysis explains the near equality (if not exact equality) of  ${\boldsymbol{\epsilon}} _{ij}$ and
 $\mathcal {D}_{ij}$ near the wall. One possibility that does not seem to have been previously considered is that this behaviour might be a direct consequence of homogeneity only in the (
 $x_1,x_3$) plane. Certainly, all experiments and DNS considered herein (and elsewhere) have one feature in common: they are homogeneous in the plane parallel to the wall. Note that this is exactly true for the channel, but approximately true for the boundary layers (and most free shear flows as well) due to their slow spreading rate.
What we would need to be true for  $\mathcal {D}_{ij}$ and
 ${\boldsymbol{\epsilon}} _{ij}$ to be equal is for the cross-derivative terms,
 $\langle \partial u_i/\partial x_j ~ \partial u_j /\partial x_i\rangle$, to sum to zero without being able to use the fully homogeneous condition of (8.1) to permute the indices. But this can be deduced from the continuity equation only if the following equalities hold:
 $$\begin{gather} \left\langle \frac{\partial u_1}{\partial x_1} \frac{\partial u_2}{\partial x_2} \right\rangle = \left\langle \frac{\partial u_1}{\partial x_2} \frac{\partial u_2}{\partial x_1} \right \rangle , \end{gather}$$
 $$\begin{gather}\left\langle \frac{\partial u_1}{\partial x_1} \frac{\partial u_3}{\partial x_3} \right\rangle = \left\langle \frac{\partial u_1}{\partial x_3} \frac{\partial u_3}{\partial x_1} \right\rangle , \end{gather}$$
 $$\begin{gather}\left\langle \frac{\partial u_2}{\partial x_2} \frac{\partial u_3}{\partial x_3} \right\rangle = \left\langle \frac{\partial u_2}{\partial x_3} \frac{\partial u_3}{\partial x_2} \right \rangle . \end{gather}$$
In planar homogeneity parallel to the wall, (8.1) is restricted to permutation of  $m$ and
 $n$ only equal to
 $1$ and
 $3$. The development of all the possibilities leads to the conclusion that only three equalities are meaningful and that only (9.2) is valid in plane homogeneous turbulence. This is confirmed by figure 18(a), which also shows that the two other equalities are exactly true in plane homogeneous turbulence, but neither of these appears in the dissipation. Figures 18(e) and 18( f) clearly show that the two other equalities (9.1) and (9.3) are violated below
 $x_2^+ = 100$. So we have exactly what we need for only the 1–3 derivative moments. Unfortunately,without assuming homogeneity in the 2-direction as well, it is impossible to derive a similar result for the other two mixed moments.
Figures 21 and 22 respectively plot the component dissipations and their differences. The clear and obvious conclusion is that  $\mathcal {D}_{ij}$ and
 ${\boldsymbol{\epsilon}} _{ij}$ (as well as
 $\mathcal {D}$ and
 $\epsilon$), which must be fundamentally unequal, are in fact very close in practice down to the wall. Whether these slight differences are significant enough for turbulence modellers to worry about is beyond the scope of this paper. But it surely provides an interesting question for theoreticians to ponder!
Difference between the normal components  $\epsilon _{ii}$ and
 $\mathcal {D}_{ii}$ of the full and pseudo-dissipation tensors and between
 $\epsilon$ and
 $\mathcal {D}$, data from the Thais et al. (Reference Thais, Tejada-Martínez, Gatski and Mompean2011) channel DNS.

9.3. The dissipation anisotropy very near the wall
Figure 21 provides interesting information about the dissipation of the normal stresses. As can be seen, below  $x_2^+ = 100$ this dissipation becomes very anisotropic, with
 $\mathcal {D}_{11}$ dominating the two other terms. A now classical way to examine the same data in terms of anisotropy is to look at the so-called ‘Lumley triangle’ formed by plotting the second and third invariants of the dissipation anisotropy tensor (see Chacin & Cantwell Reference Chacin and Cantwell2000). As in the region of interest (
 $x_2^+ < 100$)
 ${\boldsymbol{\epsilon}} _{ij}$ and
 $\mathcal {D}_{ij}$ differ slightly, it is of interest to look at the anisotropy of both. The two invariants are obtained in the following manner for the full dissipation tensor
 ${\boldsymbol{\epsilon}} _{ij}$:
 $$\begin{gather} II_\epsilon = {\boldsymbol{\epsilon}} _{ij} {\boldsymbol{\epsilon}} _{ij}/2 \end{gather}$$
 $$\begin{gather}III_\epsilon = {\boldsymbol{\epsilon}} _{ij}\epsilon_{jk}\epsilon_{ki}/3, \end{gather}$$
with similar relations for  $II_\mathcal {D}$ and
 $III_\mathcal {D}$.
Figure 23 plots  $II$ vs
 $III$ for both
 ${\boldsymbol{\epsilon}} _{ij}$ and
 $\mathcal {D}_{ij}$ in the case of the channel DNS. Also shown are the usual limiting lines. Two insets provide an enlarged view of two regions of interest. To the best of our knowledge this is the first time the diagrams for
 ${\boldsymbol{\epsilon}} _{ij}$ and
 $\mathcal {D}_{ij}$ have been plotted together. Antonia et al. (Reference Antonia, Kim and Browne1991) did the same plot for
 ${\boldsymbol{\epsilon}} _{ij}$ in the case of a channel flow at two Reynolds numbers of 3300 and 7900 (their figure 7b). The agreement with the present plot is very good, with most of the flow close to the axisymmetric limit. A difference can be observed very near the wall where the turbulence is further from the one component limit (0.03, 0.2) in the present data compared with (0.05, 0.25) for Antonia et al. (Reference Antonia, Kim and Browne1991). Comparing
 ${\boldsymbol{\epsilon}} _{ij}$ and
 $\mathcal {D}_{ij}$, one point of interest is that the curves begin to diverge only below
 $x_2^+=10$, and significantly around
 $x_2^+ = 5$. This is far below
 $x_2^+ = 100$ where local homogeneity was questioned.
Lumley triangle for both  ${\boldsymbol{\epsilon}} _{ij}$ and
 $\mathcal {D}_{ij}$ computed from the present DNS data, with a zoom in of the near-wall region.

Very similar results have been presented and discussed in detail for DNS channel flow for  $\mathcal {D}_{ij}$ in the comprehensive papers by Antonia et al. (Reference Antonia, Kim and Browne1991) and Gerolymos & Vallet (Reference Gerolymos and Vallet2016). (Note that the latter incorrectly label
 $\mathcal {D}_{ij}$ the dissipation.) Antonia et al. (Reference Antonia, Kim and Browne1991) also noticed that the preferred axis very close to the wall seemed to switch from the streamwise direction to normal to the wall, They apparently did not notice the failure of local homogeneity. Therefore we note that our results are virtually identical to the above contributions, and refer the reader to their papers. We do note three things, however. First, the very near-wall region (
 $x_2^+ < 5$) is nearly two-dimensional, not surprising given the suppression of the normal velocity component by the wall. Second, the diagram rapidly tends toward the axisymmetric asymptote, but never quite arrives. This is consistent with the idea of ‘local’ (but not complete) axisymmetry outside of
 $x_2^+ = 100$. And finally, we note that what might be interpreted as a trend toward isotropy appears to contradict the detailed analysis of § 6 and of the above conclusions. Note that it is arguable whether there is a trend toward isotropy at all since all curves in figures 14 and 15 maintain the same relative distance from each other. Regardless, any tendency toward isotropy is well into the core region or outer boundary layer which was not considered in this paper.
9.4. Potential link to the near-wall turbulence structure
It is of interest at this stage to try to understand better the physical origin of the anisotropy detailed above and the mechanisms at the origin of this dissipation. In the last 50 years, a large amount of research has been devoted to the study of the specific organization of turbulence near the wall (e.g. Theodorsen Reference Theodorsen1952; Kline et al. Reference Kline, Reynolds, Schraub and Runstadler1967; Panton Reference Panton1997; Zhou et al. Reference Zhou, Adrian, Balachander and Kendall1999). Even if the outer part organization is still a subject of intensive research with much to understand, especially at high Reynolds numbers (see Smits & Marusic Reference Smits and Marusic2011), the inner layer organization is fairly well characterized and understood (e.g. Kline & Portela Reference Kline and Portela1997; Jiménez & Pinelli Reference Jiménez and Pinelli1999). A global picture including indications of scales is provided by Lin et al. (Reference Lin, Laval, Foucaut and Stanislas2008) and reproduced in figure 24. The classical low- and high-speed streaks are sketched together with the quasi-streamwise vortices and sweeps and ejections. What is interesting is that the characteristic dimensions provided in this picture range from approximately  $x_2^+ = 100$ to approximately
 $x_2^+ = 20$ (50 to 10 Kolmogorov units). It is clear from this sketch that this near-wall organization is very far from the classical picture of homogeneous isotropic turbulence and of any cascade. The main difference is that production is now at scales which are the same as the dissipative scales.
Sketch of the very near-wall turbulence organization proposed by Lin et al. (Reference Lin, Laval, Foucaut and Stanislas2008).

It is interesting to note that although this ‘turbulence organization’ research has been very active around the world, it has stayed relatively disconnected from the modelling community and has not yet stimulated significant progress on the modelling side leading to a universal near-wall model (the WALLTURB European research project, which is at the origin of the present contribution, was aimed at that). Having in hand detailed information on a key unknown of turbulence, the dissipation tensor, and knowing now that most of its anisotropy is occurring in the region where the turbulence organization is reliably characterized, it is worth trying to see if this organization has any relation to the dissipation behaviour very near the wall. The pseudo-dissipation  $\mathcal {D}_{ij}$ given by (2.6) can now be considered as the relevant tensor to represent dissipation and can be developed into the following for the diagonal terms and the main off-diagonal term
 $\mathcal {D}_{12}$:
 $$\begin{gather} \mathcal{D}_{11} = 2\nu \left\langle \left[\frac{\partial u_1}{\partial x_1}\right]^2\right\rangle + 2\nu \left\langle \left[\frac{\partial u_1}{\partial x_2}\right]^2\right\rangle + 2\nu \left\langle \left[\frac{\partial u_1}{\partial x_3}\right]^2\right\rangle, \end{gather}$$
 $$\begin{gather}\mathcal{D}_{22} = 2\nu \left\langle \left[\frac{\partial u_2}{\partial x_1}\right]^2\right\rangle + 2\nu \left\langle \left[\frac{\partial u_2}{\partial x_2}\right]^2\right\rangle + 2 \nu \left\langle \left[\frac{\partial u_2}{\partial x_3}\right]^2\right\rangle, \end{gather}$$
 $$\begin{gather}\mathcal{D}_{33} = 2\nu \left\langle \left[\frac{\partial u_3}{\partial x_1}\right]^2\right\rangle + 2 \nu \left\langle \left[\frac{\partial u_3}{\partial x_2}\right]^2\right\rangle + 2\nu \left\langle \left[\frac{\partial u_3}{\partial x_3}\right]^2\right\rangle, \end{gather}$$
 $$\begin{gather}\mathcal{D}_{12} = 2\nu \left\langle \frac{\partial u_1}{\partial x_1}\frac{\partial u_2}{\partial x_1}\right\rangle + 2\nu \left\langle \frac{\partial u_1}{\partial x_2}\frac{\partial u_2}{\partial x_2}\right\rangle + 2\nu \left\langle \frac{\partial u_1}{\partial x_3}\frac{\partial u_2}{\partial x_3}\right\rangle. \end{gather}$$
These show clearly the different velocity derivative moments contributing to each pseudo-dissipation component.
Figure 25 gives a plot of each of these moments for each of the pseudo-dissipation tensor terms of (9.6) to (9.9). For the first  $\mathcal {D}_{11}$ term, the dominating contribution is clearly
 $\langle [{\partial u_1}/{\partial x_2}]^2\rangle$ which is maximum at the wall. The second pseudo-dissipation component
 $\mathcal {D}_{22}$ is an order of magnitude smaller than the first one (as is the corresponding Reynolds stress). The peak of the two main contributing moments,
 $\langle [{\partial u_2}/{\partial x_2}]^2\rangle$ and
 $\langle [{\partial u_2}/{\partial x_3}]^2\rangle$, is located around the peak of TKE (
 $x_2^+ \simeq 15-20$), which is also the location of the centre of the quasi-streamwise vortices as found by Lin et al. (Reference Lin, Laval, Foucaut and Stanislas2008). The last diagonal
 $\mathcal {D}_{33}$ term is, like the first one, largely dominated by one moment,
 $\langle [{\partial u_3}/{\partial x_2}]^2\rangle$, which is again maximum at the wall. Both
 $\mathcal {D}_{11}$ and
 $\mathcal {D}_{33}$ show a intriguing kink around
 $x_2^+ \simeq 15- 20$. As could be expected, these three diagonal terms are mainly dominated by the moments corresponding to gradients normal to the wall, which consequently also dominate the scalar pseudo-dissipation
 $\mathcal {D}$.
Derivative moments contributing to the main terms of the pseudo-dissipation tensor  $D_{ij}$.

In order to get a better insight into the structures contributing the most to these dissipative terms, figures 26 and 27 were built from the DNS of Thais et al. (Reference Thais, Tejada-Martínez, Gatski and Mompean2011) in planes parallel to the wall at  $x_2^+ = 3$ and
 $x_2^+ = 30$, respectively. The low (blue) and high (green) speed streaks are evidenced by thresholding the streamwise velocity fluctuations at the classical value of
 $\pm$ one root mean square (rms). The
 $Q$ criterion, which is indicative of the presence of vortices, is given in red. The threshold was chosen to evidence the mostly vortical structures. The dominating moments of each of the diagonal terms of the
 $\mathcal {D}_{ij}$ tensor are also given in red. The threshold is twice the local mean value, that is the value on the curves of figure 25.
Instantaneous view of the derivative moments contributing to the main terms of the pseudo-dissipation tensor  $\mathcal{D}_{ij}$ at
 $x_2^+ = 3$. High-speed streaks: green, low-speed streaks: blue. In red: (a)
 $Q$ criterion, (b) main term of
 $\mathcal {D}_{11}$. (c) Main term of
 $\mathcal {D}_{22}$. (d) Main term of
 $\mathcal {D}_{33}$.

Instantaneous view of the derivative moments contributing to the main terms of the pseudo-dissipation tensor  $D_{ij}$ at
 $x_2^+ = 30$. High-speed streaks: green, low-speed streaks: blue. In red: (a)
 $Q$ criterion. (b) Main term of
 $\mathcal {D}_{11}$. (c) Main term of
 $\mathcal {D}_{22}$. (d) Main term of
 $\mathcal {D}_{33}$.

Looking first at figure 26 for  $x_2^+ = 3$, it appears clearly from the
 $Q$ criterion that the vortical activity is very limited. A striking similarity appears between this
 $Q$ criterion and the term
 $[\partial u_2/\partial x_3]^2$, which is the dominant term of
 $\mathcal {D}_{22}$, indicating that this kind of dissipation is linked to strain rate which appears mostly on the side of the high-speed streaks. The contrast is clear compared with
 $[\partial u_1/\partial x_1]^2$ and
 $[\partial u_2/\partial x_3]^2$ for which the red regions are much larger in scale and mostly located inside the high-speed streaks.
Looking now at figure 27 for  $x_2^+ = 30$, the first thing to notice from
 $Q$ is that the number of vortical structures is much larger, that they are mostly streamwise oriented and elongated and that they effectively appear mostly between the streaks, as sketched in figure 24. What is also clear from the moments is that all the dissipative activity is now strongly linked to these vortical structures and all at a comparable scale.
The conclusion which can be drawn from these two figures is that the dissipation very near the wall has two distinct physical origins. The first one, which dominates at the wall, is strongly linked to the high-speed streaks, appears at spanwise scales comparable to them and is probably related to the sweeping motions associated with these streaks. The second origin of dissipation is the vortical activity which is maximum around  $x_2^+ = 20$ and which, looking back at figure 25, affects clearly all the components of
 $\mathcal {D}_{ij}$ at different levels and through different terms. It is interesting to notice at this stage that this wall location is also the place of a peak of production of TKE. (Part of the present results have been recently confirmed by the contribution of Zaripov, Li & Saushin (Reference Zaripov, Li and Saushin2020) who did study the extreme events of dissipation near the wall with the help of high-speed planar PIV. Their figure 7 is in fairly good agreement with what is observed in figure 26 here: the dissipation very near the wall, which is dominated by
 $[\partial u_1/\partial x_2]^2$ is mostly located at the bottom of the high-speed streaks. As the technique used by these authors has access only to the information in the
 $x_1,x_2$ plane, they do not see the dissipation terms observed here further away from the wall at
 $x_2^+ = 30$ where they locate a high TKE production linked to the streamwise vortices.)
In both of the cases evidenced in figures 26 and 27, we are very far from the classical Kolmogorov cascade and from the dissipation of TKE through the smallest eddies. (The streamwise vortical structures are typically 10 Kolmogorov units in diameter and approximately 50 in length.) Consequently, any attempt to model the near wall dissipation on the basis of the Kolmogorov theory has little chance to succeed. This probably explains the large number of near-wall corrections available in the Reynolds-averaged Navier–Stokes (RANS) literature.
10. Summary and conclusions
For both turbulence modelling and theoretical developments it is of prime importance to characterize the dissipation rate. This key parameter is difficult to access in practice as it involves all the terms of the strain-rate tensor and measurement requires a very good spatial resolution. With this objective, a specific SPIV experiment was carried out in the turbulent boundary layer which allowed derivative measurements of all three velocity components in all three space directions. Also, as a matter of validation and comparison, the data of a specific channel flow DNS at the same Reynolds number were processed to provide the same information.
This paper shows the measured dissipation in a boundary layer up to  $x_2^+ \le 1000$ (
 $x_2/\delta _{99} < 0.4$), and compares it with previous measurements and a channel flow DNS at similar Reynolds number. All of the experimental results show some evidence of spatial filtering, but taken together with the DNS give considerable insight into the dissipation.
For the first time, in the present experiment, all 12 terms contributing to the turbulence energy dissipation were measured directly using only spatial derivatives, and without any additional hypotheses. The results show that these terms behave quite differently in the inner part of the boundary layer. Despite an obvious spatial filtering, the hierarchy between the terms is in very good agreement with the DNS, except that the boundary layer data show generally a slightly better  $1/x_2$ behaviour in the overlap region than the channel flow DNS. This could be attributed to the difference in flow type, but needs further investigation. Both the SPIV and the DNS data confirm that all the derivative cross-products are negative. Compared with the variances, they are approximately an order of magnitude smaller.
As far as the full dissipation is concerned, a thorough comparison with the data of Honkan & Andreopoulos (Reference Honkan and Andreopoulos1997) showed that, after dividing their  $\epsilon$ by 2 (in agreement with the authors) and removing the noise, they are in relatively good agreement with the present data and those of Balint et al. (Reference Balint, Wallace and Vukolavcevic1991). The three experiments were run at different Reynolds numbers (the present one being the highest) but at very comparable spatial resolutions when compared with the Kolmogorov scales. Therefore, apart from the noise and the difference in measurement techniques, the differences between them can be attributed to the difference in Reynolds number or in the method used to assess the derivative moments. The difference in Reynolds number is too small to account for the differences. So it is most likely that the data processing is the most reliable explanation. As detailed in Foucaut et al. (Reference Foucaut, George, Stanislas and Cuvier2021), a very careful procedure was used to denoise and validate the SPIV data. Finally, these SPIV data are very consistent with the DNS results.
Another important result of the present contribution is that the theoretical behaviour (George & Castillo Reference George and Castillo1997; Wosnik et al. Reference Wosnik, Castillo and George2000) of the dissipation in the inertial layer as  $\epsilon ^+ \approx \alpha {x_2^+}^{-1}$ (or weak power law behaviour) is confirmed for the boundary layer with
 $\alpha \approx 2.0$. For the channel flow DNS, this is at least approximately true for
 $30 \le x_2^+ \le 600$, but a clear departure is observed in the outer region beyond
 $x_2/H = 0.2$, consistent with the very different physics in the outer flows. Also, it is observed that
 $\epsilon ^+$ and
 $D^+$ are nearly indistinguishable over the range of the measurements. This is quite surprising, since the hypothesis of local homogeneity near the wall breaks down inside
 $x_2^+ = 100$.
Having all the velocity derivative moments available from both experiment and DNS made it possible to check the classical hypotheses used to simplify turbulence theory. The results show that local isotropy is clearly a very bad assumption for this boundary layer flow within the overlap region and below. As evidenced by figures 14 and 15, several of the conditions set by (6.1)–(6.4) are violated by the derivative moments, and consequently, the estimation of the full dissipation on the basis of one single moment as done in (6.5) is quite risky. The streamwise mean square derivative,  $\langle [\partial u_1/\partial x_1 ]^2 \rangle$, is a particularly bad representative of the rest of the dissipation.
As far as local axisymmetry is concerned, it is observed that all conditions provided by (7.1) are fulfilled except two, as evidenced by figure 16. Nevertheless, in agreement with the observations of Antonia et al. (Reference Antonia, Kim and Browne1991) and Zhao et al. (Reference Zhao, George and van Wachem2015), local axisymmetry provides a very good approximation above  $x_2^+ = 100$ and a reasonable one for
 $30 < x_2^+ < 100$, allowing us to propose simplified equations to evaluate the full TKE dissipation
 $\epsilon$ on the basis of only four derivative moments. These should be particularly useful to experimentalists using planar SPIV, since all the necessary terms can be measured in a plane.
The local homogeneity hypothesis appeared in fact to be the most interesting one as it implies directly that  ${\boldsymbol{\epsilon}} _{ij} = \mathcal {D}_{ij}$ and consequently that
 $\epsilon = \mathcal {D}$. As for local axisymmetry, the data show that local homogeneity is limited to the region above
 $x_2^+ = 100$. (Note that local homogeneity is a requisite for either local axisymmetry or local isotropy to be possible.) The data clearly show that local homogeneity is not valid below
 $x_2^+ = 100$.
In seeming contradiction to the breakdown of local homogeneity, the full dissipation tensor can hardly be distinguished from the pseudo one below this wall distance. The analysis performed in § 9 shows that supposing homogeneity in planes parallel to the wall is enough to validate only one of the moments equalities demanded by (8.2) to have  ${\boldsymbol{\epsilon}} _{ij} = \mathcal {D}_{ij}$.
Looking at  $\mathcal {D}_{ij}$, which on the basis of the present results can be considered as representative of the dissipation of the Reynolds stresses, it appears that the different moments building each component of this tensor do not have the same weight. The moments based on wall-normal derivatives are mostly dominant, especially very near the wall. Looking at what is known of near-wall turbulence organization and at some snapshots of the different terms in planes parallel to the wall, it appears that near-wall dissipation is based on two different physical phenomena. One dominating very near the wall is associated with the high-speed streaks and with the sweeping motions embedded in them. The second one is clearly related to the quasi-streamwise vortices which have been observed by numerous authors around
 $x_2^+ = 20$ and which are at the origin also of the near-wall turbulence production. Both phenomena occur at fairly different scales. They appear in any case very different from the classical Kolmogorov cascade model. To go further, it would be of interest to extract, from a sufficient number of independent realizations, length scales and intensity scales of the different dominant terms of
 $\mathcal {D}_{ij}$ evidenced here. This would most probably help a better modelling of the near-wall dissipation which is critical to turbulence modelling (e.g. Jakirlić & Hanjalić Reference Jakirlić and Hanjalić2002).
From the authors point of view, the main contribution of the present work is to validate quantitatively, on the basis of both experimental and DNS high quality data, the hypothesis made at the early stage of turbulence modelling to replace the full dissipation tensor in the Reynolds stress equation and the full dissipation in the TKE equation by the corresponding pseudo-dissipation terms. This hypothesis was done at that time for the purpose of simplification (fewer terms to model) and because very little was known about dissipation. In approximately half a century, both direct simulation and experimental techniques have made enough progress to allow today a detailed analysis of the numerous dissipation components and an a posteriori validation of this well-known hypothesis. It should be noted, however, that our theoretical conclusions are very much dependent on the assumptions that certain derivative relations do not commute. If it can be argued that they do, then all of these conclusions near the wall will be purely a consequence of plane homogeneity. This will be especially problematic since all of the data are also homogeneous in planes. So fully three-dimensional flows could behave very differently.
Finally, the results obtained here clearly evidence that, except very near the wall ( $x_2^+ < 100$), the local homogeneity hypothesis is remarkably good. So the local axisymmetry can be quite helpful as well to measure more accurately the scalar dissipation.
Supplementary material
Supplementary material is available at https://doi.org/10.1017/jfm.2022.699.
Funding
This work was supported through the International Campus on Safety and Inter modality in Transportation (CISIT). This work was carried out within the framework of the CNRS Research Federation on Ground Transports and Mobility, in articulation with the Elsat2020 project supported by the European Community, the French Ministry of Higher Education and Research, the Hauts de France Regional Council. Centrale Lille is acknowledged for providing regular financial support to the visits of Prof. William K. George and the ‘Région Nord Pas-de-Calais’ for supporting his visit in 2009. This research has granted access to the HPC resources of (CCRT/CINES/IDRIS) under the allocation i20142b022277 and i20162a01741 made by GENCI (Grand Equipement National de Calcul Intensif). L. Thais is acknowledged for providing the data of his DNS of channel flow.
Declaration of interests
The authors report no conflict of interest.
Author contributions
C.C. performed the PIV processing, J.M.F. performed the PIV postprocessing and the corresponding figures. J.P.L. performed the DNS postprocessing and the corresponding figures. W.K.G. and M.S. performed jointly the analysis and the writing of the paper.
Data availability statement
The data that support the findings of this study are openly available at https://turbase.cineca.it/init/routes/#/logging/view_dataset/66/tabmeta.