I. INTRODUCTION
There is growing concern over materials being out of specification, because of issues ranging from unanticipated contamination to willful adulteration. Oftentimes the means of screening for quality assurance are based solely on meeting simple specification requirements. Such testing may fail to find undesirable material changes and contamination, or open the door for adulteration by indicating precisely what is being evaluated, as well as what is not. One notable example was the recent addition of melamine as a means of boosting detected protein levels in wheat gluten and rice protein concentrate, ingredients used in both pet food (Byron, Reference Byron2007; FDA, 2007) and dairy products, including infant formula (WHO, 2008). The quality control methods for testing protein levels in these products were based upon total nitrogen assays, and as melamine is very high in nitrogen (67% by weight), it enabled the protein test to be “deceived”, erroneously boosting the apparent protein level of the raw materials to which they were added. Unfortunately, the adulterated protein sources made it into products such as pet food and infant formula, leading to dire health consequences. Similar concerns play out across industry where manufacturers suffer significant loss of time and profits when materials of insufficient quality enter their processes, and such events occur even if the incoming material met an initial design specification test.
While the addition of reliable test methodologies or comprehensive 100% screening would likely eliminate many issues, such procedures are often both cost and time prohibitive particularly for high volume, and low cost products. Therefore, because of the growing demand for improved screening, we have undertaken a research program for the development of a new means of testing. This method employs a series of unrelated or “orthogonal” material measurements, each of which is low cost and non-destructive in nature. The output of these tests is then used to build a signature for a given material, facilitating the rapid screening of a population of samples to identify any which are somehow different than the rest. To test our new screening method, we chose to investigate a series of alloy standard materials. The differing diagnostic methods included techniques such as X-ray fluorescence (XRF) but also employed material property measurements such as thermal expansion, density, hardness, magnetic properties, and ultrasonic testing. For brevity, this manuscript documents only the observations regarding the use of XRF screening. The use of principal component analysis (PCA) routines can provide a means of effectively analyzing large datasets of XRF spectra to look for similarities and differences characteristic of a given material. We report the results of our PCA analysis methods for screening stainless steel alloys as a means of verification of similar vs. different alloy materials.
II. EXPERIMENTAL
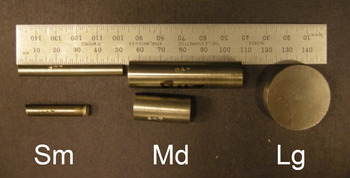
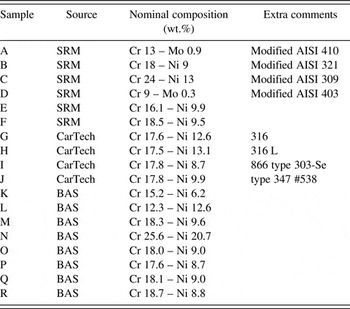
Samples were selected from various steel alloy reference materials. The selected alloys are listed in Table I. These alloys have different sources. Samples A–F were NIST Standard Reference Materials (SRM), Samples G–J were from Carpenter Technology Corporation (CarTech), and Samples K–R were from the Bureau of Analyzed Samples (BAS). The nominal alloy compositions for the major elements are also given in Table I. The purpose of selecting standard alloy materials was to have an established, well-characterized set of materials prior to our XRF characterization and other diagnostic techniques. The variety of alloys could serve as a means of testing our screening methodology for establishing a materials signature of each alloy, and thereby be able to distinguish a given alloy from other alloys. Additionally, some of the alloys had different form factors as shown in Figure 1. While all the samples were cylinders, these cylinders had differing diameters where the small (S) rods were ¼ inch in diameter, the medium (M) rods were ½ inch in diameter, and the large (L) pucks were 1¼ inches in diameter. It was reasonable to assume that all samples of the same alloy would have the same elemental composition in terms of weight percent (wt.%) of each metal regardless of their S, M, or L form factor. A large portion of the discussion documented within this paper serves to demonstrate that “Sample A” in our study, a Modified AISI 410 alloy (Cr 13 -Mo 0.9), was truly the same composition regardless of form factor. Additional discussion has been given regarding the ability to separate Sample A from the other alloys in a meaningful way using PCA of XRF data.
Appearance of different form factors for small (S) ¼″ diameter rod, medium (M) ½″ diameter rod, and large (L) 1.25″ diameter puck.

Alloys used in XRF analysis (balance of composition is Fe).

XRF data were collected using a Bruker M4 Tornado μ-XRF instrument. X-rays were generated via a microfocused X-ray source employing rhodium (Rh) radiation. The beam was concentrated using a polycapillary optic to create a focused 25 µm spot-size on each sample. The X-ray source was operated at 50 kV and 200 µA. A silicon drift detector (SDD) was employed for fast data collection of the energy dispersive XRF spectra (~30 s spectrum−1). Samples were mounted vertically so as to view and analyze the flat, top-surface of the cylinder. Each cylinder was secured to the x–y–z translation stage using double-sided adhesive tape on the underside of cylinder. A total of 100 separate XRF spectra were collected on each sample using a 10 × 10 grid with separations between each spot of ~100 µm. The entire analysis chamber was evacuated to 19 mbar during data collection. XRF spectra were analyzed using PCA via in-house generated algorithms written in MATLAB® (Matlab, 2016).
III. RESULTS AND DISCUSSION
A. The problem
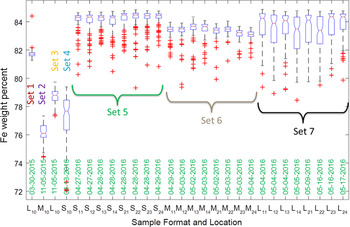
It became evident from our XRF analysis that over time we were seeing disconcerting issues regarding the semi-quantitative analysis of the analyzed samples, when utilizing the Bruker M4 software routines to obtain the elemental analyses. Figure 2 is illustrative of this point. It shows the Fe content values (in wt.%) for replicate measurements made over time on Sample A. The wt.% values were derived via the software embedded within the M4 data collection routines and plotted within MATLAB® (Matlab, 2016). Figure 2 warrants discussion as it shows many issues. First, we point out that each dataset represents 100 measurements and the boxplot used to represent each dataset denotes the distribution of these XRF data. Each plotted rectangular box represents the interquartile (IQR) where the lower and upper edge on the box designate a 25–75% range for the lower and upper bounds of the dataset, respectively. The horizontal line across the box (where the notch in the box is observed) indicates the median value. The whiskers that extend above and below the bounds of the box denote the extent of the data range outside of the IQR, and the data points that were determined as outliers from this distribution have been shown as (+) symbols, which fall outside of the range designated by the whiskers. More details regarding box plots can be found elsewhere (Boxplot, 2016).
Quantitative Fe content (wt.%) derived from Sample A over the course of time with differing form factors. See text for details.

There were seven sets of XRF data collected on the Sample A alloy over the course of 14 months. The initial XRF analysis for Sample A (Set 1) was performed on the large puck (L) and was collected on 03-30-2015; the result showed a tight distribution for Fe composition just below 82 wt.% Fe with only a couple of outlier data points at higher values. The label for this dataset, plotted on the far left of Figure 2, was (L10) where L designates the large puck form factor, the first value in the subscript represents the sample side that was exposed to the beam (1 = top) and the second digit in the subscript represents the quadrant on that surface where the data were collected. The value of (0) means that the data were simply collected from the middle of the puck's top (i.e. flat) surface. The second set of data (Set 2) shows the results for Sample A collected on the medium form factor cylinder. M10 data were collected on 11-05-2015 from the middle area on the top surface of the cylinder. Note that the Fe content centered around 76 wt.%, which is a significantly different value from the L10 (Set 1) sample measured 7 months earlier. With this observation, it might be thought that perhaps the medium form factor had a different material composition from that of the large form factor Sample A. The large form factor Sample A (L10) was run again (Set 3) on 11-05-2015. However, the wt.% value obtained for L10 from Set 3 did not replicate the Set 1 result. Likewise, when the small form factor sample (S10) was collected (Set 4) approximately 5 months later on 04-13-2016 the results showed a large standard deviation and an inconsistent result compared to Set 1.
To address concerns about varying composition for identical alloy samples with different form factors, these three form factors were re-measured multiple times during the April–May 2016 time-frame after a careful check and adjustment of the energy calibration of the SDD (via the K α emission line of a pure Zirconium metal standard). Set 5 consisted of data collected from the small form factor (S) and was measured on the top and bottom (i.e. flat surfaces) in four separate quadrants as denoted by the second digit in the subscript. For example, S11 refers to the top surface upper-right quadrant of the cylinder. Likewise, S21 refers to the same quadrant of the sample on the bottom surface of the cylinder. Four separate quadrants were measured to see if there was composition variation across the flat surfaces of the cylinder. Fortunately, the average values and distributions for the Fe content within the small form factor Sample A tended to cluster together at about 84 wt.% regardless of measurement location, which suggested that the alloy was compositionally uniform on the scale of the measurements. Similar measurements were made on the medium form factor Sample A (Set 6), and the large form factor Sample A (Set 7). While all of these compositions fell in the range of ~82–84 wt.% Fe content, the discrepancy between these measurements and those taken on previous dates indicated a serious systematic error. The bottom line is that if these samples are the same alloy composition, one would expect that the results would be much more consistent in terms of a uniform and predictable Fe concentration. If we observe this level of variation for an effectively identical alloy, how would one ever expect to distinguish this alloy from one that we expect to be compositionally different? This was a major concern for our assurance program.
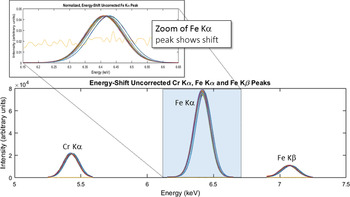
Careful inspection of our XRF spectra revealed drift of the detector's energy calibration over the course of time. These issues inadvertently impacted the quantification of the alloy composition. Figure 3 illustrates the detector energy drift issue. To generate this figure, all the Sample A XRF spectra were normalized to have the same maximum intensity (scaled to the Fe K α emission line) and then were plotted together on one graph. One can see from the lower part of Figure 3 (which displays the 5–7.5 keV range) that the Cr K α, Fe K α, and Fe K β emission lines all tend to show some variability on the energy axis. The zoomed region for just the Fe K α emission line more visibly illustrates the shifting of the Fe K α peak along the energy axis for different spectra. The variability in chemical composition was traced back to a detector drift error, as the quantitative analysis routines assume a very well positioned set of emission lines. Small deviations in peak location resulted in changes to the integrated peak area and final reported wt.% values. One spectrum within this dataset was flagged as an outlier because it did not display any emission lines at all, but only background signal. This spectrum (which can be seen as a high background line in the zoomed portion of the Fe K α peak in Figure 3) was ultimately removed from the dataset prior to further processing. The unusual spectrum was ultimately associated with an error in the acquisition software and was not considered a valid XRF measurement (and therefore removed).
XRF spectra from Sample A (Sets 1–7) showing peak shift along the energy axis. All spectra have been normalized to have identical Fe K α intensity.

Correction of these systematic errors is commonplace, and routine calibration checks will help to alleviate such issues in XRF analysis. However, even if consistent energy calibrations to account for detector drift are performed, it is not likely that these functions will all result in an identical correction of the spectrum over the course of months of analysis. Because our effort focuses more on comparing XRF spectra to look for commonalities and differences, instead of relying on the semi-quantitative analysis values generated by the M4 software routines, we decided to simply work with the raw spectra themselves. One can perform energy axis corrections external to the M4 software and afterward evaluate the data with existing in-house PCA methods to look for similar vs. different materials signatures. This is what we decided to do.
B. Correction of energy axis for raw data
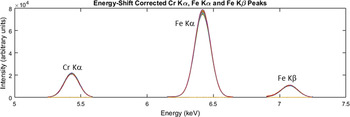
Correction of the spectrum along the energy axis was straightforward. We employed the Cr K α, Fe K α, and Fe K β emission lines to derive a linear shift correction function and forced the Fe K α peak at 6.404 keV to be the intercept of the energy-axis correction function. This correction function was applied to all spectra collected. Note that while the form of the correction function is identical, the actual correction of each spectrum could vary in terms of the coefficients of the linear function. The resulting “energy-shifted” data for the Sample A series are shown in Figure 4 where all the spectra are superimposed on one another. As one can see, all the spectra now line up very well and there is essentially no error on the energy axis from sample to sample.
XRF spectra for Sample A (Sets 1–7) after correction for detector drift. All spectra are now superimposed and located in the proper location for their respective emission lines.

C. PCA analysis with varimax rotation on sample A spectra
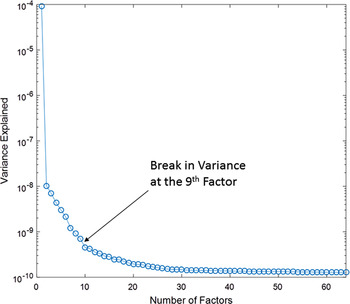
Once all the spectra for Sample A were corrected, the next step in the process of understanding our data was to perform PCA on the entire series of Sample A spectra. Note: henceforth within this paper the capitalized term “Factor” will denote a PCA-derived component extracted from the large array of XRF spectra so as to differentiate it from the term “form factor”, which simply denotes the shape of the rod or puck. Details regarding the PCA process can be found elsewhere (Rodriguez et al., Reference Rodriguez, Kotula, Griego, Heath, Bauer and Wesolowski2012). Briefly, the data were first Poisson-scaled. Next, the mean within the energy domain was computed and a scaling matrix was created. This was followed by PCA to determine the important Factors. Finally, these Factors were Poisson-unscaled. The eigenvalue plot for this analysis is shown in Figure 5. This graph serves to demonstrate which Factors derived from the PCA analysis of the XRF data are the most important in terms of describing the dataset. Eigenvalue plots typically have a characteristic “L” shape, where the most relevant Factors cluster on a steep slope. There is typically a break in the data where one may choose to separate the most relevant Factors from those that can be assigned to the noise level. This was the case for our data. Figure 5 clearly shows a break in the data between the 9th and 10th Factors. Therefore, our analysis truncated the relevant Factors at the 9th Factor and assigned Factors 10 and above as associated with noise in the data. One additional step was performed during the Factor analysis, once the 9 PCA Factors were derived. This additional step involved a varimax rotation of these 9 Factors for the purposes of spectral simplicity. The benefit of doing this matrix rotation was that it tended to isolate the derived Factors to be associated with a specific XRF emission line. Keenan (Reference Keenan2009) demonstrated that varimax rotations served well for spatial simplicity in spectral image analysis. The same concept holds true for our case, the difference being that we employ the matrix rotation for spectral simplicity. The Factor rotation made data interpretation straightforward as each derived Factor could simply be assigned to a given element.
Eigenvalues derived from PCA of Sample A data.

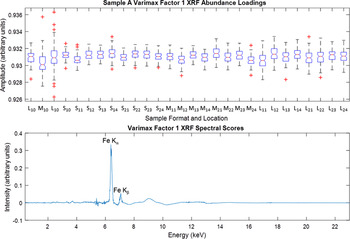
The benefits of the varimax rotation were immediately seen when the 9 Factors were analyzed. We do not present all of the observed Factors, but select three as illustrative of the set. The first Factor was easily assigned as the iron component and is shown in Figure 6. This Factor is the strongest Factor in the data in terms of describing the variance. The bottom plot in Figure 6 is essentially composed of the Fe emission lines. Both the Fe K α and Fe K β lines are observed. There is some deviation in the background level, especially near 9 keV, but in general this component can be assigned as the Fe signal in the XRF data and is proportional to relative concentration. The very good news from the PCA analysis is that one observes a consistent value in terms of amplitude for the abundances throughout all of the Sample A spectra (see the top portion of Figure 6). While the amplitude values shown for Factor 1 do not directly correspond to the wt.% Fe content, they are proportional to the wt.% Fe and the consistency of the observed amplitude value from PCA is in marked contrast to Figure 1 where there was clear inconsistency for the Fe content. Therefore, it appears that the correction method for the energy axis is indeed working. In fact, one could even draw a horizontal line across the top portion of Figure 6 at amplitude value = 0.931 and bisect nearly all the boxplot results shown. Certainly this line would fall within the extended whisker range of each data. It is worth noting something regarding the second L10 measurement (3rd from left on amplitude plot). This sample showed a significantly larger whisker range than other samples and had 6 outlier data points. Careful inspection of this particular dataset suggests that some XRF spectra in this set (Set 3) contained experimental artifacts, which affected the abundance values for Fe in the spectra. This led to the significant outliers observed.
Varimax rotation results for Factor 1 depicting the Fe spectrum (bottom plot) and this Factor's relative abundance (top plot).

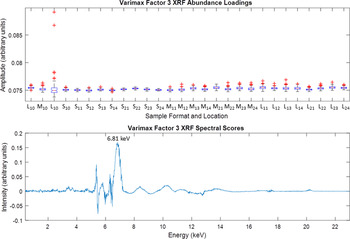
In regard to outlier data points mentioned above, Figure 7 speaks to this issue. This figure shows the results for Factor 3. The lower portion of Figure 7 shows that the spectrum for Factor 3 looks like a single peak centered at 6.81 keV. Note that the breadth of this peak is significantly larger in full-width-at-half-maximum than the Fe K α peak observed in Figure 6. The large breadth of this peak suggests that it is likely because of a diffraction artifact event rather than a true emission line. This is further supported by the fact that no X-ray emission line matches the 6.81 keV energy (CoK α at 6.93 keV comes close but misses by 120 eV and no Co is expected in Sample A). This phenomenon is not new and diffraction peaks have been observed and documented before in other samples (Rodriguez et al., Reference Rodriguez, Kotula, Griego, Heath, Bauer and Wesolowski2012). The unfortunate location of this peak at 6.81 keV means that it falls between the Fe K α and Fe K β emission lines and its presence in some of the spectra likely impacts the iron concentration for those spectra in which it appears. In this regard, it is important to point out that the abundance of this Factor is very weak, being an order of magnitude lower in amplitude as compared with Factor 1. However, there is one striking feature about Factor 3; this Factor shows significant outliers of higher concentration for the problematic L10 sample mentioned above (i.e. Set 3). We observe at least two major outliers (amplitude >0.085) in the top portion of Figure 7, whereas all the other amplitudes for Factor 3 tend to cluster at the same magnitude (~0.075 on the amplitude scale). This type of observation is very characteristic of the sporadic nature of diffraction artifacts and serves to illustrate how they can be isolated via PCA methods. It also suggests that Set 3 has a few problematic spectra that skew the results, leading to a significant number of Fe concentration outliers as seen in Figure 6. There were additional diffraction artifact peaks that were extracted by PCA. For example, Factor 8 (not shown) manifested a broad peak centered at 4.83 keV and a similar skewed distribution for exaggerated amplitude specifically for the problematic L10 sample.
Varimax rotation results for Factor 3 showing a diffraction artifact peak at 6.81 keV (bottom plot) and this Factor's relative abundance (top plot).

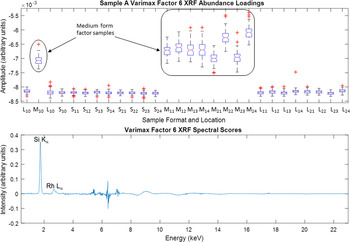
One very interesting result was that of Factor 6. This Factor, extracted via PCA with varimax rotation, is highlighted in Figure 8. The figure illustrates the weak presence of Si in the sample. Sample A (Modified AISI 410 alloy) is well known to contain a small concentration of Si, so the presence of Si was not a surprise. The bottom portion of Figure 8 clearly shows a sharp peak characteristic of an X-ray emission line and its location at 1.74 keV is easily diagnosed as the Si K α energy. In addition, there was a very small peak associated with the Rh X-ray source. The real surprise here was the abundance behavior for Si in these samples. The top portion for Figure 8 shows how this abundance varies across the different sets of data for the Sample A alloy. Note here that the scale of the amplitude is very low, so this suggests a low concentration of Si present in the sample (likely <1 wt.%). The amplitude value looks to be relatively constant for all the L and S samples, but there is a marked jump in amplitude (concentration) for all of the M samples. The data clearly show that the M samples have a statistically higher Si content than the other alloy samples. The origin of this extra Si is not clear. It is possible that it could be residual contamination from previous polishing of the samples. Or this could be a real difference associated with a different alloy lot for the medium form factor rods. The PCA analysis easily identified this difference and associated it with the analyses of the medium form factor cylinder for the Sample A alloy.
Varimax rotation results for Factor 6 showing the Si K α emission line (bottom plot) and Si relative abundance (top plot).

D. PCA on all XRF spectra
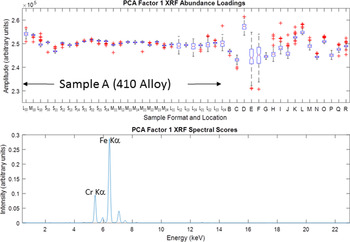
As mentioned earlier, the use of the entire set of XRF spectra can be of great value because our objective is to distinguish between similar and dissimilar alloys. Therefore, the use of quantitative elemental composition derived from the measured XRF spectra may not be as useful as simply employing the full spectrum obtained from each measured alloy and evaluating them in context. In effect, the spectrum obtained for one alloy (such as Sample A) can be thought of as a signature of that material within a large dataset encompassing many different alloys. Once we established that the required energy axis corrections to the raw XRF spectra enabled consistent and reproducible results for the Sample A alloy, we felt confident to expand the PCA analysis to the larger array of alloys as listed in Table I. Similar datasets on these samples (i.e. a grid of 100 XRF spectra) were obtained on samples B–R. These datasets were combined with Sample A data (Sets 1–7) and PCA was performed on this large array of spectra for the purposes of testing the use of PCA to group similar vs. dissimilar alloys. The PCA was performed twice, the initial PCA analysis was performed “without correction” (w/oC) and subsequently preformed “with correction” (wC). For the w/oC case, the raw XRF spectra were taken “as is” without any modification. Specifically, we did not apply any scaling of the spectrum intensity, nor did we perform the energy axis corrections for the XRF spectra as outlined above. For the PCA attempt in the wC dataset, all XRF spectra were preprocessed via intensity scaling and the XRF spectra were corrected for any shift on the energy axis because of detector drift (according to the previously outlined protocol). We did not perform the varimax rotation for this larger dataset (A–R XRF spectra) for either of these cases (w/oC or wC), but performed a simple PCA component extraction for each test case. Figure 9 shows the resulting boxplot for the w/oC dataset. Factor 1 for this set of data is shown on the bottom portion of Figure 9 and looks like an XRF spectrum for the K lines of Fe and Cr. It is no surprise that this Factor dominates the dataset, because the majority of the spectra are from Sample A and Fe and Cr are the dominant elements for this alloy. The top portion of Figure 9 shows the abundance values for this Factor. This is where one might expect to see some separation of Sample A abundance from the other alloys B–R. One can see some general grouping of Sample A on the left portion of the graph in terms of relative abundance, but even within the Sample A data there is variation of abundance. When one compares the abundance values for sample A to that of B–R results, most of the alloys in the B–R sets cannot be uniquely distinguished from those of Sample A because of the large window of possible abundance amplitude values generated from the uncorrected datasets for Sample A. This is reminiscent of Figure 1, which showed a large degree of variation in composition for the different datasets collected on Sample A. It is clear from Figure 9 that a simple PCA analysis on the uncorrected XRF spectra is not sufficient to enable separation of similar vs. dissimilar alloys so as to flag alloys with differing chemical signatures.
Factor 1 for PCA analysis on the full set of XRF spectra (samples A–R) without scaling and energy axis corrections applied (without correction – w/oC) and without application of varimax rotation.

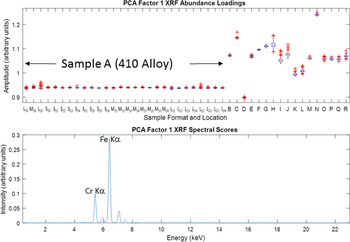
The second PCA attempt, with the scaling and energy corrections applied prior to Factor analysis (i.e. wC), had a significantly different result. Figure 10 shows the resulting Factor 1 output from the PCA on the wC data. The bottom portion of the plot shows a very similar component extracted from the Factor analysis as was observed in Figure 9, that of an XRF spectrum composed of Fe and Cr K lines. However, the top portion of the plot showing the abundances for this Factor yields a dramatically different outcome. All the abundances for Sample A (410 Alloy) are now grouped together at the same amplitude scale (~0.94 on the Y-axis). The alignment of all these Sample A datasets is stunning in its consistency; even the outlier data points associated with the problematic L10 sample still remain isolated from all the other alloy samples represented (B–R). This excellent result unambiguously verifies Sample A data as having a consistently unique signature compared to the other alloys investigated, and PCA analysis on wC data can reliably flag alloys of differing compositions with relative ease. Note that samples M, O, P, Q, and R also cluster. This may be related to their similar Cr compositions.
Factor 1 for PCA analysis on the full set of XRF spectra (samples A–R) with both scaling and energy axis corrections applied (with correction – wC), and without application of varimax rotation.

The results of the above analysis on XRF spectra renew confidence in the use of PCA to test and isolate materials having differing compositions. Therefore, XRF should prove very useful as one of several orthogonal diagnostic methods for establishing a materials signature, thereby averting quality control problems of similar nature to those discussed in the introduction section of this manuscript. With proper correction and processing of XRF data, very robust distinctions for material signatures are possible. When these results are viewed within a larger picture of additional orthogonal diagnostics methods, this new method of screening should prove even more rigorous, with improved isolation of materials signatures via multiple vectors.
IV. CONCLUSIONS
We have successfully demonstrated a means of materials screening via XRF analysis through the use of PCA on full XRF spectra. Adjustments of the collected XRF spectra, such as scaling and correction of the energy axis of the spectrum (to compensate for errors associated with detector drift), are required to achieve quality results for materials signature determination and isolation via Factor analysis. The results of PCA on a large set of XRF spectra collected on various alloys definitively isolated Sample A (410 Stainless steel alloy) from all other measured alloys. The use of varimax rotation during PCA can serve as a means of obtaining spectral simplicity and can be employed for the isolation of individual emission lines during Factor analysis. The use of varimax rotation can also screen out artifacts such as spurious diffraction peaks present in a small subset of the collected XRF spectra. When PCA with varimax rotation was applied to XRF data for the 410 alloy, the analysis clearly denoted a higher concentration of Si present in the medium form factor rods as compared to the large puck and small diameter alloys. While the origin of a differing Si content in the medium rods remains unclear, the results show that PCA methods have strong sensitivity to even small changes in elemental composition.
ACKNOWLEDGEMENTS
Supported by the Laboratory Directed Research and Development program at Sandia National Laboratories, a multi-mission laboratory managed and operated by Sandia Corporation, a wholly owned subsidiary of Lockheed Martin Corporation, for the US Department of Energy's National Nuclear Security Administration under contract DE-AC04-94AL85000.