


The concept of the linguistic variable has dominated our approach to the study of linguistic variation since its beginning in the 1960s. We frequently find discussions of pairs of variables—whether they are merged or not, or move in parallel or in chain, but these generally move within a single system. This paper launches an effort to take the linguistic system itself as a central focus and the competition between two such systems as the variable process. The concept of “system” is so deeply associated with our understanding of language that any change in language may be seen as a change in the language system. A rise in the height of the vowel in man is said to be systematic if it is found in all other tokens of short-a before front nasals, and change in that specification (e.g., “in syllables closed by front nasals”) can be considered systematic change. The present report deals with change at a higher level of organization than a pair of features, as one system competes with another. This reorganization divides a previously uniform community into two separate blocks of speakers, defined by the institutional character of their schooling. What was first seen as an effect of higher education will emerge as an expansion of a new phonological system through an elite network of early, middle, and high school populations.
The term competing systems is not unrelated to Kroch's concept of competing grammars, but it differs in what is being measured. Grammar competition may be tracked by the frequency of discrete outputs of each grammar (Kroch, Reference Kroch1989), but here the individual speaker is characterized by overall degree of conformity to each of the competing systems.Footnote 1
The area of phonology undergoing change is the organization of the short-a word class in the city of Philadelphia.Footnote 2 The traditional system of tense and lax forms found for the mainstream community in earlier studies gives way to the incoming nasal system in subgroups of the community oriented to the educational system. We will draw from three databases:
-
• LCV: The study of Linguistic Change and Variation in Philadelphia, based on recordings of 120 speakers in long-term studies of socially stratified neighborhoods in the 1970s (Labov, Reference Labov2001).
-
• PNC: The Philadelphia Neighborhood Corpus, including forced alignment and vowel extraction (FAVE) analyses of 388 transcribed recordings drawn from yearly studies of neighborhoods from 1973 to 2012 by members of the class on the Study of the Speech Community (Labov & Rosenfelder, Reference Labov and Rosenfelder2013; Labov, Rosenfelder, & Fruehwald, Reference Labov, Rosenfelder and Fruehwald2013).
-
• IHELP: The project on the Impact of Higher Education on Local Phonology, based on 106 transcribed interviews with Philadelphia college students and their friends and families from 2012 to 2014.
IHELP was designed to obtain maximum data on the reorganization of the short-a system by the population of college students most affected. Twelve undergraduates were recruited and trained to interview their friends from high school and college with methods that concentrated the vocabulary crucial to the definition of the short-a system, along with experience relative to the evaluation of the Philadelphia dialect. The sample focused on the speakers most affected by higher education in an elite, nationally oriented research institution, the University of Pennsylvania. Expanding through their friends and associates, we added students from other colleges, including some in the Philadelphia region and elsewhere.
In this report, we will trace the progress of competing systems through six successive approaches to defining this change in the pattern of the speech community.
-
1. The temporal reorganization of the traditional tense/lax assignment of allophones of /æ/ will be displayed by date of birth, combining PNC with IHELP data.
-
2. Competition between phonological systems will be shown in the proportions of speakers whose output is dominated by one system or the other as measured by Pillai scores.
-
3. The progress of the nasal system will be correlated with race and institutional characteristics of speakers’ high schools.
-
4. Regression analyses will define the relative influence of the dimensions identified.
-
5. Personal histories will be compared for pairs of individuals who are identical in the dimensions identified so far but differ in their use of the phonological systems.
-
6. The flow of the nasal system across educational institutions will be displayed by bipartite social networks that use the concept of institutions as surrogates of social networks.
THE TRADITIONAL PHILADELPHIA SYSTEM
Throughout the Mid-Atlantic states, short-a shows a division into tense and lax forms (Ferguson, Reference Ferguson and Smith1975; Labov, Reference Labov, Fasold and Schiffrin1989; Labov, Ash, & Boberg, Reference Labov, Ash and Boberg2006:chap. 17; Trager, Reference Trager1934). Lax forms are centered on a short, low front nonperipheral [æ]. The tense forms are differentiated from the lax target by a number of phonetic traits: fronting, lengthening, raising from lower mid to high position, and a developing inglide: [æ:˔, ε:, e:ə, i:ə]. These tense forms are socially salient, as shown by matched guise tests and self-report tests (Labov, Reference Labov1966:chap. 11–12, Reference Labov2001:193–233). On the other hand, the conditions for distribution into tense and lax classes are extremely complex and not at all salient.Footnote 3 The Philadelphia version, which we focus on here, is governed by a set of complex conditions. The core distribution can be stated informally as:
-
1. Short-a is tense in syllables closed by front nasals, front voiceless fricatives, and three affective adjectives mad, bad, glad, but lax in the irregular verbs ran, swam, began, in function words can, am, and, an, and elsewhere. The syllable is closed by inflectional boundaries so that the vowel is tense in pan and panning but not in panel.
To this we can add some more specific conditions:
-
2. Short-a is lax in polysyllabic words with zero onset before voiceless fricatives (tense ask but lax aspirin, asterisk, athletic) but variable with other coda clusters (master, plaster).
-
3. Short-a is lax in learned words (alas, wrath) and onomatopoetic words (wham, bam).
Throughout the past few decades, lexical diffusion of the tensing process has been found in Philadelphia before nasals in open syllables (planet) and before /l/ (pal, personality) (Banuazizi & Lipson, Reference Banuazizi, Lipson and Paradis1998; Labov, Reference Labov, Fasold and Schiffrin1989; Roberts & Labov, Reference Roberts and Labov1995). This has been described as a “split” system distinguishing two phonemes /æ/ and /æh/ (Labov et al., Reference Labov, Ash and Boberg2006:chap. 17) with the tense form joining the subset of long and ingliding vowels. But the evidence of this report agrees with the position of Kiparsky (Reference Kiparsky and Goldsmith1995) that these developments are generated by a rule—a very complex rule with lexical specifications and analogical extensions, but nonetheless an allophonic rule system rather than the random distribution that marks a phonemic opposition.
In the 1970s, basic pattern 1 was found to be uniform across all social classes, from upper class to lower working class (Kroch, Reference Kroch, Guy, Feagin, Schiffrin and Baugh1996; Labov, Reference Labov2001). Figure 1 is drawn from the studies of Philadelphia in the 1970s, measuring the phonetic tenseness of short-a in the four categories defined by pattern 1. The value of F2 is stratified socially for the three tense environments, but all social groups differentiate them from the lax set. This traditional system was found to be quite stable in Conn's (Reference Conn2005) restudy of Philadelphia vowels.
Distribution of F2 of short-a by social class and phonetic environment (from Kroch, Reference Kroch, Guy, Feagin, Schiffrin and Baugh1996).

THE NASAL SYSTEM
In many areas of North America, a simpler rule dictates the phonetic realization of short-a. In the nasal system, all /æ/ before front nasal consonants are tense; all others are lax (Labov et al., Reference Labov, Ash and Boberg2006:174). In some regions, such as Eastern New England, the prenasal vowels cluster in high front position, separated by as much as 600 Hz from the main body of short-a with low front [æ]. There is evidence that the nasal system is expanding in many areas where it is in contact with other systems. In New Haven, Johnson (Reference Johnson1998) found the traditional Mid-Atlantic pattern giving way to the nasal system. In the Midland area, Boberg and Strassel (Reference Boberg and Strassel2000) found that the complex allophonic distribution of short-a tensing was being replaced by the nasal system. Durian (Reference Durian2012) reported the same development in Columbus, Ohio, and Fogle (Reference Fogle2008) reported it in Indianapolis. In her study of the corridor between Chicago and St. Louis, Friedman (Reference Friedman2014:Figure 4.3) found a steady increase of difference of short-a before nasals and elsewhere, reaching 800 Hz for those born after 1980. Becker and Wong (Reference Becker and Wong2009) found that the traditional New York City system, similar in its complexity to the Philadelphia system, is showing “change, potentially, towards the nasal system,” especially among members of ethnic minorities. Studies of sound change in progress on the west coast indicate a steady increase in the direction of the nasal short-a system (Hall-Lew, Cardoso, Kemenchedjieva, Wilson, Purse, & Saigusa, Reference Hall-Lew, Cardoso, Kemenchedjieva, Wilson, Purse and Saigusa2015).
In earlier characterizations of the nasal system, vowels before velar nasals were often not included. Friedman (Reference Friedman2014) summarized the lax tendency of velar nasals in a range of Eastern and Midland dialects. However, recent studies of the expansion of the nasal system show tensing velar nasals playing a prominent role. Becker and Wang (Reference Becker and Wong2009:15) reported that younger White New Yorkers showed no significant difference in the F1 of /æ/ before velar and other nasals. Eckert (personal communication) found consistent tensing of short-a before velar nasals among young Californians.
A defining feature of the Northern Cities Shift (NCS) is that there is no significant difference between the prenasal and preoral allophones of /æ/: it is thus the opposite of the nasal system. Dinkin (Reference Dinkin2011) found that the nasal system effectively blocked the expansion of the NCS in New York state, and that in the fringes of the Inland North communities, the phonetic distance between prenasal and preoral /æ/ was increasing in apparent time. Our Michigan State University colleagues in the IHELP project have found a weak version of the NCS in the Lansing area and a strong expansion of the nasal system among college students (Wagner, Mason, Nesbitt, Pevan, & Savage, Reference Wagner, Mason, Nesbitt, Pevan and Savage2015).Footnote 4
In Philadelphia, occasional traces of the nasal system have been found in the year-by-year reports of the course on the Study of the Speech Community. In 2003, a group working in the Jewish community in Northeast Philadelphia found a nasal short-a system, with varying degrees of influence from the Philadelphia short-a system. An immediate impetus for the IHELP project was the finding that the nasal system was quite uniform in the speech of college students who had graduated from elite Philadelphia high schools (Labov et al., Reference Labov, Rosenfelder and Fruehwald2013:Table 6). Prichard (Reference Prichard2016) found evidence of this Philadelphia shift to the nasal system in the decline of tense /æh/ in preoral contexts among younger subjects with higher education.
In some of these situations, the nasal system replaces a short-a configuration that is phonologically quite simple, like the continuous system or the general raising of the NCS (see Labov et al., Reference Labov, Ash and Boberg2006:chap. 13). In the Midland cities, the nasal system replaces a pattern of complex allophony, but without lexical or grammatical conditioning. In Philadelphia, we have the opportunity to observe the competition of the nasal system with a phonological system of full complexity, where the feature of nasality is only a part of the system. We will trace the consequences of this collision across time and across the various components of the speech community.
THE REORGANIZATION OF ALLOPHONES
This report is aimed at an understanding of the nature and mechanism of the transition from the traditional Philadelphia system to the nasal system. This must involve at least the nine subcategories of short-a words listed in Table 1. For a child who has grown up in a household with the traditional system, a shift to the nasal system must involve the conversions shown in Table 1. Four formerly lax classes must be realized as tense and three tense classes must be converted to lax. We may ask the following questions: Is it a single phonological reorganization or a sequence of phonetically defined sound changes? How does it spread through the community, and what determines who is affected?
Conversion of Philadelphia system to the nasal system

To answer the first of these questions we consider three possible modes of transmission:
-
1. The tense/lax opposition is first merged, and then the nasal allophones raised to tense position.
-
2. The transition from one allophonic system to another is made one allophone at a time, until eventually the system is reorganized.
-
3. One allophonic system replaces another as a whole. That is, æF (and), ærsb (ran), æNV (manage), æNG (hang), æN (man) are realized together in the tense domain, and æS (class), æmsb (mad), æL (valley), æ (cat) are shifted together into the lax domain.
We can look for evidence for these modes of transition through the speech community by adjoining the new IHELP corpus to the PNC. The PNC is derived from a series of 56 neighborhood studies carried out yearly from 1972 to 1988 and every two years since. Seven of these neighborhood studies were part of the National Science Foundation–supported LCV project in the 1970s (Labov, Reference Labov2001) and 50 were the work of students in the course on the Study of the Speech Community at the University of Pennsylvania. A total of 399 PNC interviews have been transcribed and their vowel systems analyzed by the FAVE program (Rosenfelder, Fruehwald, Evanini, & Yuan, Reference Rosenfelder, Fruehwald, Evanini, Seyfarth, Gorman, Prichard and Yuan2014). The interviews followed the methods described in Labov (Reference Labov, Baugh and Sherzer1984) to obtain speech close to the vernacular of everyday life, along with a variety of formal inquiries into particular linguistic variables. The IHELP research project recruited 12 undergraduate students to interview their friends and family in the years 2012–2014, with particular attention to attitudes toward the Philadelphia dialect. Data on short-a patterns was enriched by semantic differential questions (e.g., what is the difference in meaning between stammer and stutter?).
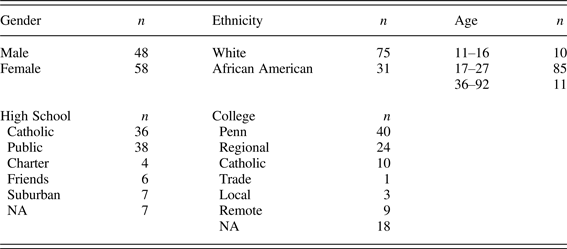
A total of 106 interviews were transcribed and analyzed by the FAVE program. Table 2 shows the distribution of subjects by gender, ethnicity, age, high school, and college. The age divisions correspond to the focus on undergraduates (n = 85), with a smaller number of older and younger members of their families. Later sections of this report will show major divisions among the high schools that bear upon the use of the nasal system, and some consideration will be given to the college types, where Penn predominates as a result of the location of the research. The classification of colleges is determined primarily by the proportions of students from the Philadelphia area.
IHELP subjects interviewed and transcribed
The traditional Philadelphia system has been maintained through most of the 20th century as shown in Figure 2, a generalized additive model analysis of the most stable section of the population: 175 White speakers with high school level education born before 1960. The tenseness of the nine short-a subcategories is given by the measure of the front diagonal (F2 – 2 × F1), shown on the y-axis. A higher number represents a tenser token. Date of birth is displayed along the x-axis. The three tense categories (æN, æS, æmbg) remain tense throughout; the six lax categories (æ, æNV, æNG, ærsb, æF, æL) remain lax and widely separated.
Stability of the traditional short-a system for 175 White speakers of the PNC with high school education born before 1960: height along the front diagonal by date of birth.
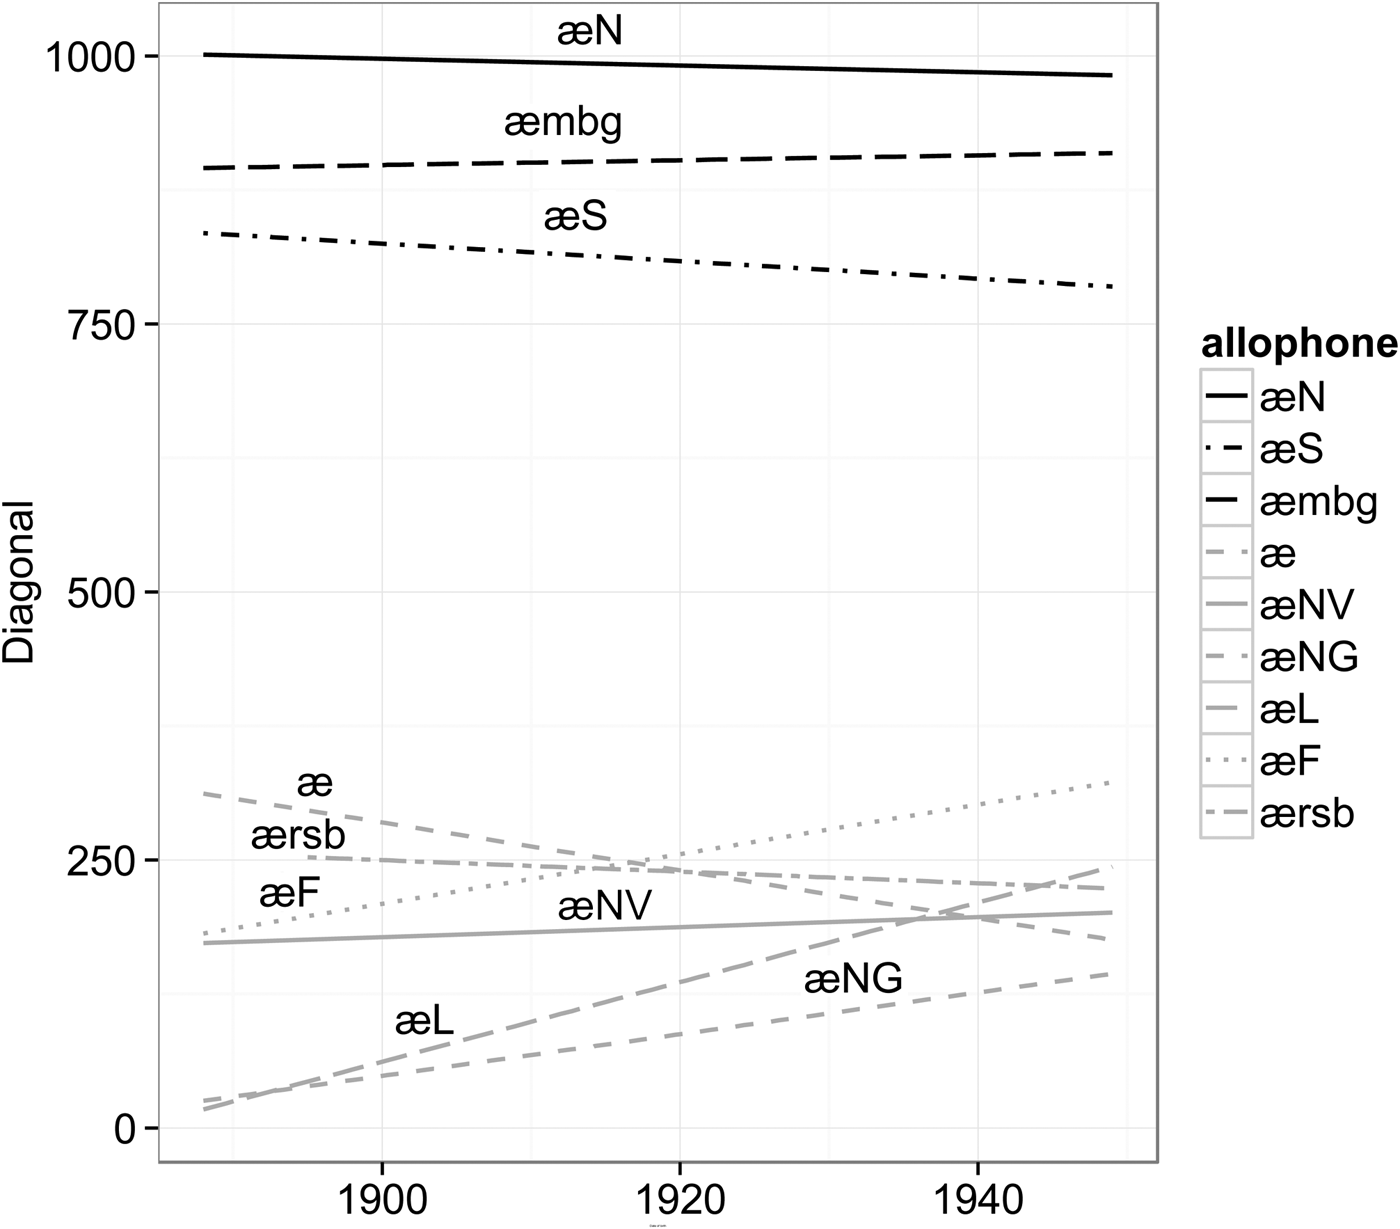
Figure 2 reflects the stability of the traditional short-a pattern in Philadelphia as it was first described in Ferguson (Reference Ferguson and Smith1975) and Labov (Reference Labov, Fasold and Schiffrin1989). It shows the calm separation of allophones characteristic of the White working class neighborhoods. The PNC data indicates some changes in speakers with higher education, but this is in sharp contrast with the IHELP study, which is aimed specifically at the population in which the shift to the nasal system is concentrated.
To follow the reorganization of the Philadelphia short-a systems as a whole, we can adjoin the two databases, PNC and IHELP, and follow the history of the various short-a allophones. Figure 3 combines the FAVE analyses of short-a for 388 speakers from the PNC with 70 White IHELP speakers: a total of 115,888 short-a tokens. Again, the vertical axis is height along the front diagonal and the horizontal axis is date of birth. The data is analyzed with a locally weighted scatterplot smoothing (LOESS) regression curve, which allows us to study the joint fluctuations of the nine short-a categories over time. Just as the generalized additive model analysis of Figure 2 emphasizes the stability of the traditional system among the White PNC speakers with no more than a high school education, the LOESS analysis of Figure 3 allows us to follow changes in the relation of allophones when White PNC speakers of all education levels and all White IHELP speakers are included.Footnote 5 While Figure 2 focuses on the stable White population of PNC, Figure 3 follows the joint development of all White PNC and IHELP speakers. In the upper part of the diagram those born before 1980 show the three major tense categories at high values on the front diagonal—æN (man), æmbg (mad), and æS (class). It is interesting to observe that they rise and fall together in the minor fluctuations across the decades. This uniformity of behavior in the tense tokens suggests the existence of a more abstract phonological category “tense” governing all three conditions (Fruehwald, Reference Fruehwald2013). At lower left, the six lax categories are also well defined throughout the first two-thirds of the century but do not covary as tightly.Footnote 6 It is among the youngest speakers that we see these categories move together. Starting with those born around 1980, two tense allophones begin to be realized as lax: æS and æmbg, while the four lax pre-nasal allophones æF, æNV, æNG, and ærsb raise along the periphery and are realized as tense. One category that had been subject to sporadic raising, short-a before /l/ (Banuazizi & Lipson, Reference Banuazizi, Lipson and Paradis1998; Labov, Reference Labov, Fasold and Schiffrin1989), abandons any such tendency and settles in as a particularly low allophone.
Transition of traditional Philadelphia system to nasal system: LOESS diagram of height along the front diagonal (F2 – 2 × F1) by date of birth, adding IHELP sample to PNC. Bottom line: number of tokens and type word for each allophone. Number of tokens measured:

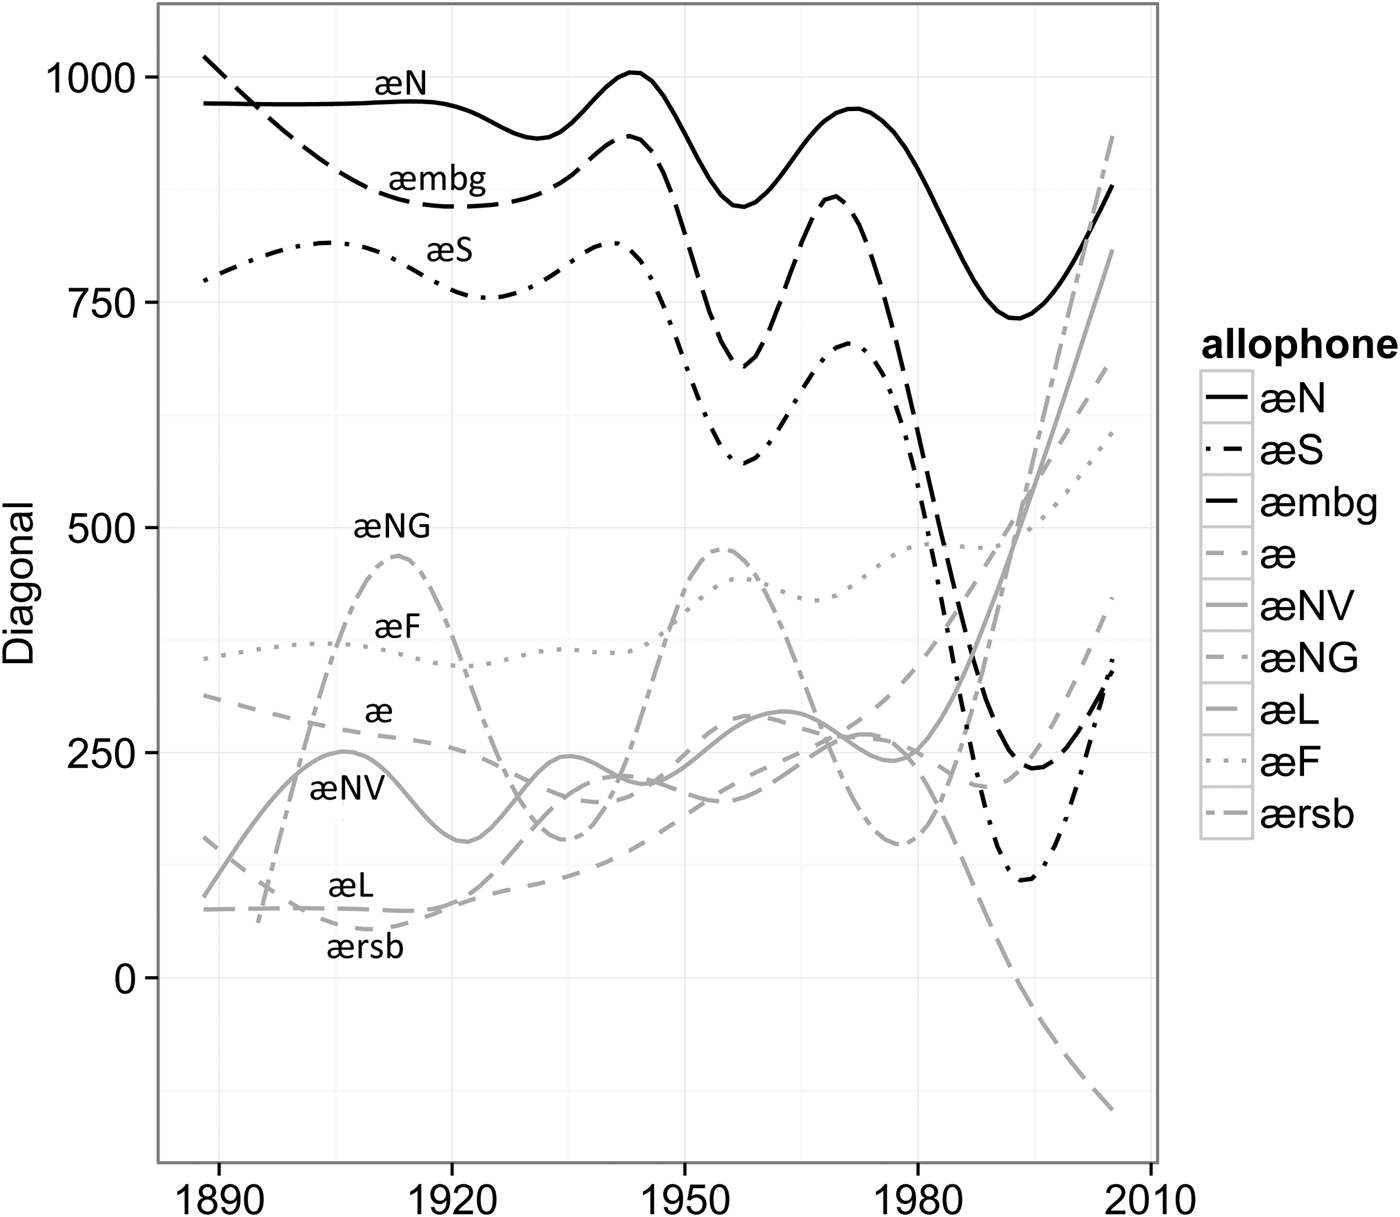
Table 3 presents the results of a regression analysis of the allophonic components of the short-a class for the population most engaged in the shift to the nasal system: 55 White college students with dates of birth from 1983 to 1995. A total of 20,715 short-a tokens are involved. The small differences between the three nasal allophones that are shifting from the lax to the tense class—æV, æG, and ædF—do not reach significance even at the .05 level. This confirms the finding of Figure 3 that the shift to the nasal system is the adoption of the general phonological condition
/æ/ → [tense]__[+nas]
Regression analysis of position on the front diagonal of short-a allophones for 55 White college students with dates of birth from 1983 to 1995 (n = 20,715).
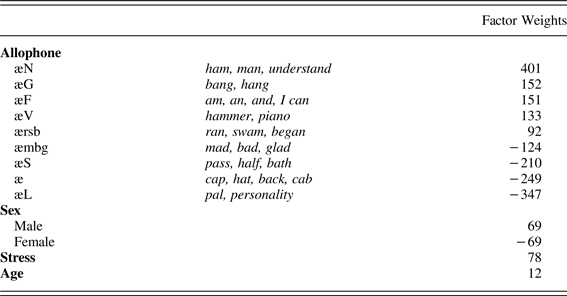
Factor weights determined by Rbrul (Johnson, Reference Johnson2016).
rather than the step-by-step process:
-
1. Remove constraint on tensing of function words.
-
2. Remove constraint on tensing in open syllables.
-
3. Remove constraint on tensing before back consonants.
MEASURING CONFORMITY TO SHORT-A SYSTEMS BY PILLAI SCORES
We therefore see that the change we are tracing in Philadelphia is not an evolution of distinct linguistic variables, but a competition in the community between two systems. In previous studies, we have followed the addition of a lexical item planet to the tense class (Roberts & Labov, Reference Roberts and Labov1995), the expansion of the tense class to include vowels before /l/ (Banuazizi & Lipson, Reference Banuazizi, Lipson and Paradis1998), and the inclusion of derivational suffixes in the definition of syllable closing, tensing classic, classify, passive.
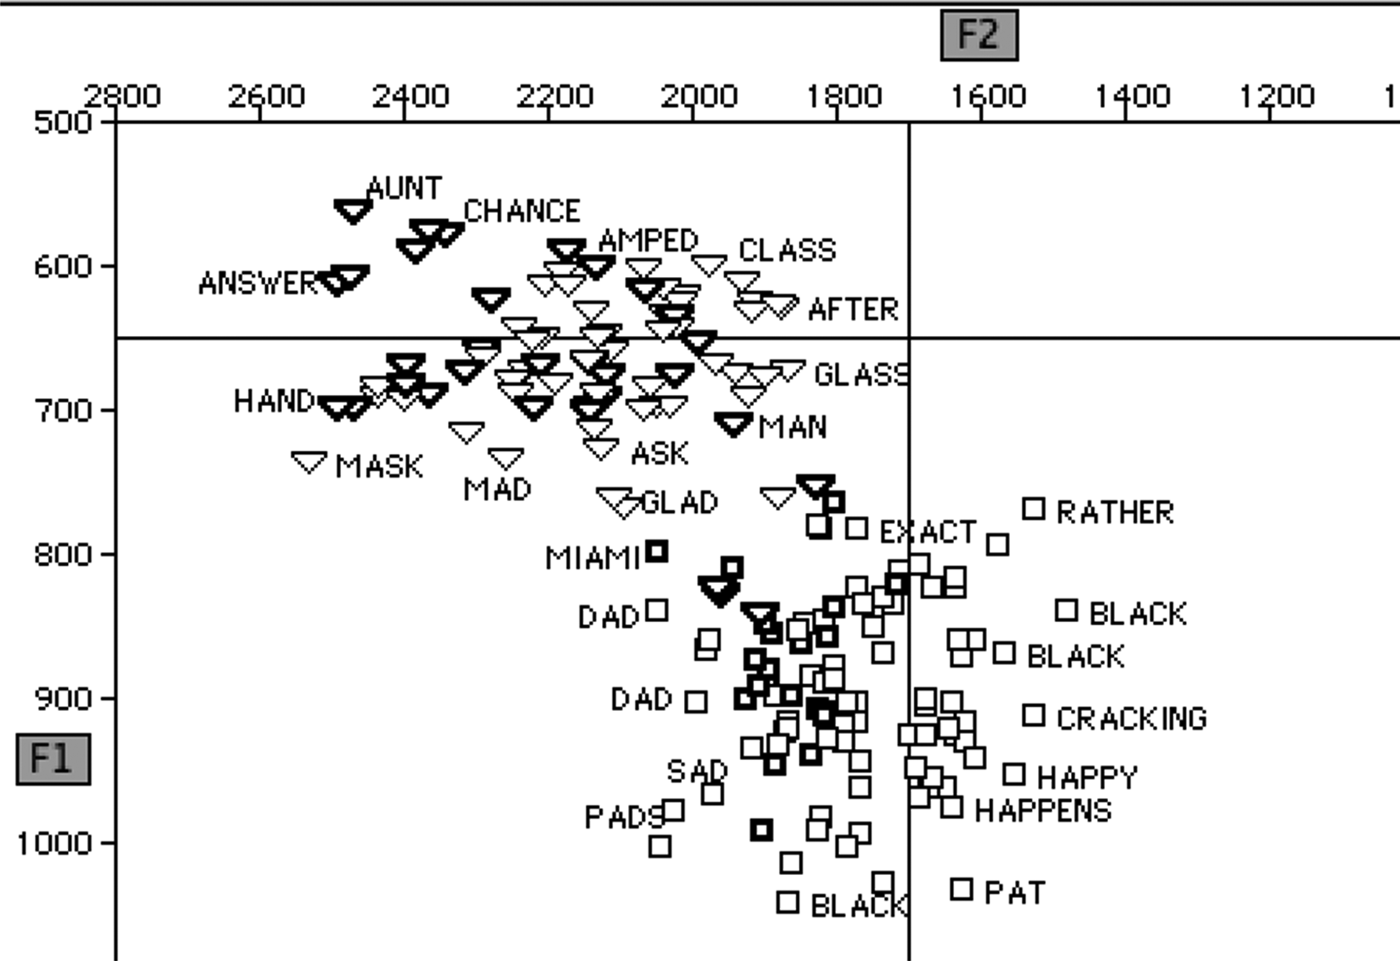
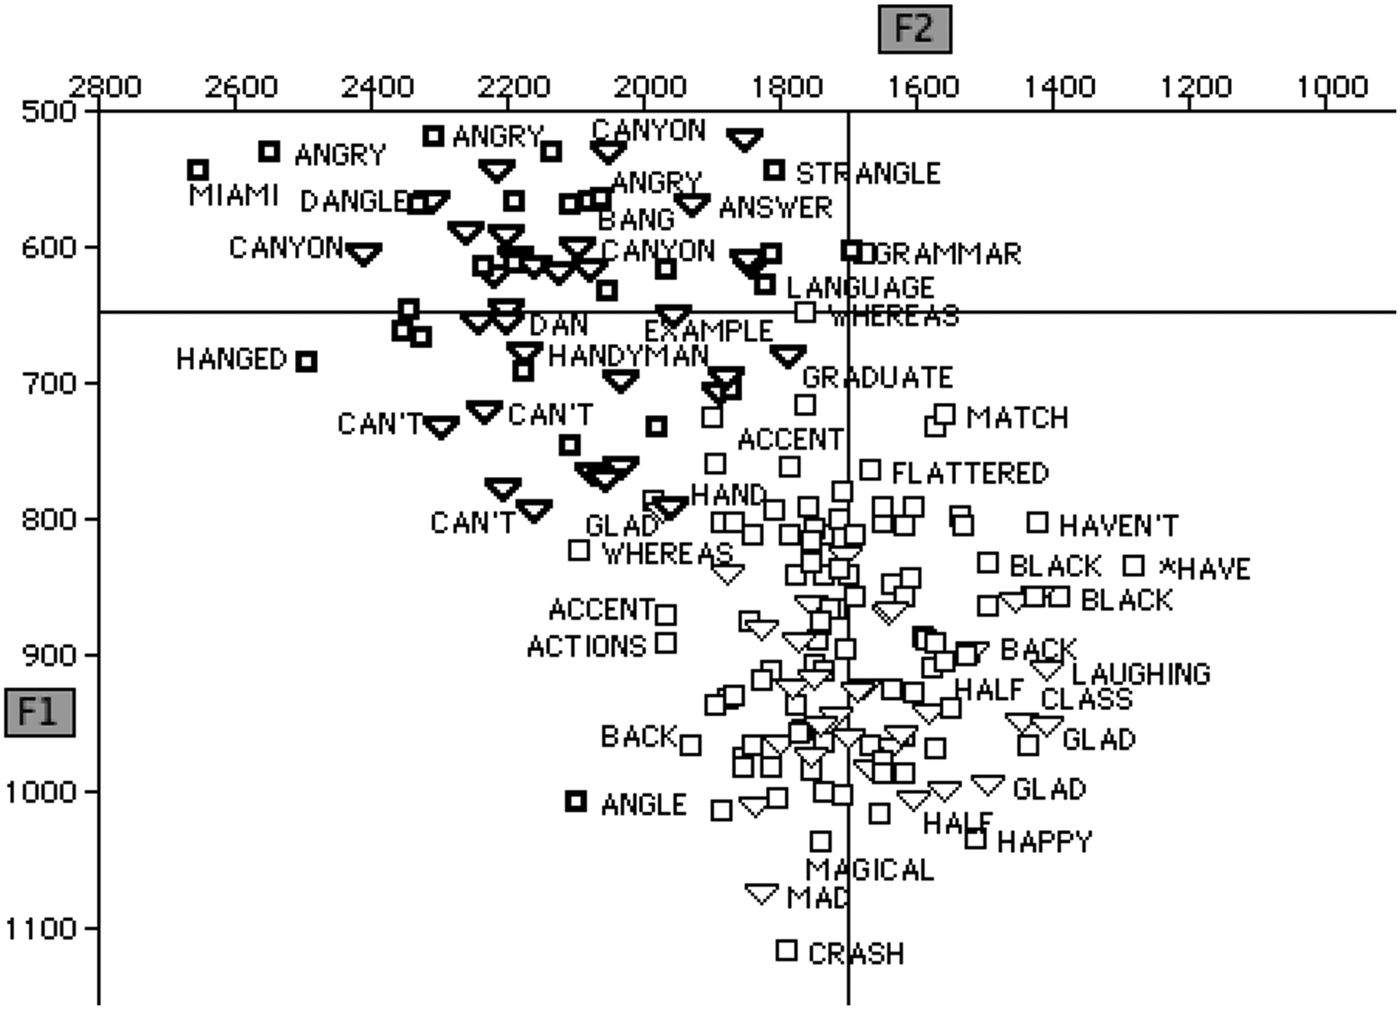
In what follows, we will not be tracing the path of individual allophones, but rather for any given speaker, the degree of conformity to the traditional Philadelphia system and the degree of conformity to the innovative nasal system. Each system defines a cluster of tense and a cluster of lax vowels, where the maximum conformity would produce a bimodal distribution of two completely separate clusters. We have explored this reorganization with a number of measures of separation or bimodality. The one used in this report is the Pillai-Bartlett statistic, introduced by Hay, Warren, and Drager (Reference Hay, Warren and Drager2006) and Hall-Lew (Reference Hall-Lew2010) to measure the degree of a vowel merger. It uses multivariate analysis of variance to measure separation, evaluating both the distance between the two distributions and their variances.Footnote 7 The output is bounded by 0 (no difference in the two distributions) and 1 (maximum separation). Figure 4 shows the normalized F1–F2 distribution of short-a vowels of Antonio L, the 55-year-old father of Christine L. He is the IHELP subject with the highest Pillai score for the traditional system (.769): tense vowels (triangles) are firmly separated from lax vowels (squares). Figure 5 displays the corresponding diagram for the highest Pillai nasal system score (.727): Leah G., 16.Footnote 8 The separation of nasal (highlighted) and oral codas is almost complete. One token of angle is lax rather than tense. At the boundary between the tense and lax distributions, one token of hand is slightly overlapped with one raised token of glad, widely separated from the two lax tokens of glad at lower right.
Traditional short-a system of Antonio L., 55, graduate of North Catholic High School. Triangles: traditionally tense. Squares: traditionally lax. Highlighted symbols: nasal coda. Pillai score (traditional) .769.
Nasal short-a system of Leah G., 16, student at Masterman High School. Triangles: traditionally tense. Squares: traditionally lax. Highlighted symbols: nasal coda. Pillai score (traditional) .727.
We will apply this measure to the short-a output of the 106 IHELP subjects individually, assigning each of them two Pillai scores: one for their conformity to the traditional Philadelphia short-a system, and one for their conformity to the nasal system. Since White and Black speakers show radically different patterns in this distribution, we will begin by plotting Pillai scores for the 70 White subjects in Figure 6: for the traditional Philadelphia system on the horizontal axis, and for the nasal system on the vertical axis. It is apparent that subjects fall into two different distributions: a traditional group with scores on the x-axis from .2 to .6 and on the y-axis below .3; and a nasal group with scores on the x-axis below .2 and scores covering the whole range of the y-axis up to .8.
Pillai scores for the short-a systems for White IHELP speakers with those born before 1985 indicated in gray.
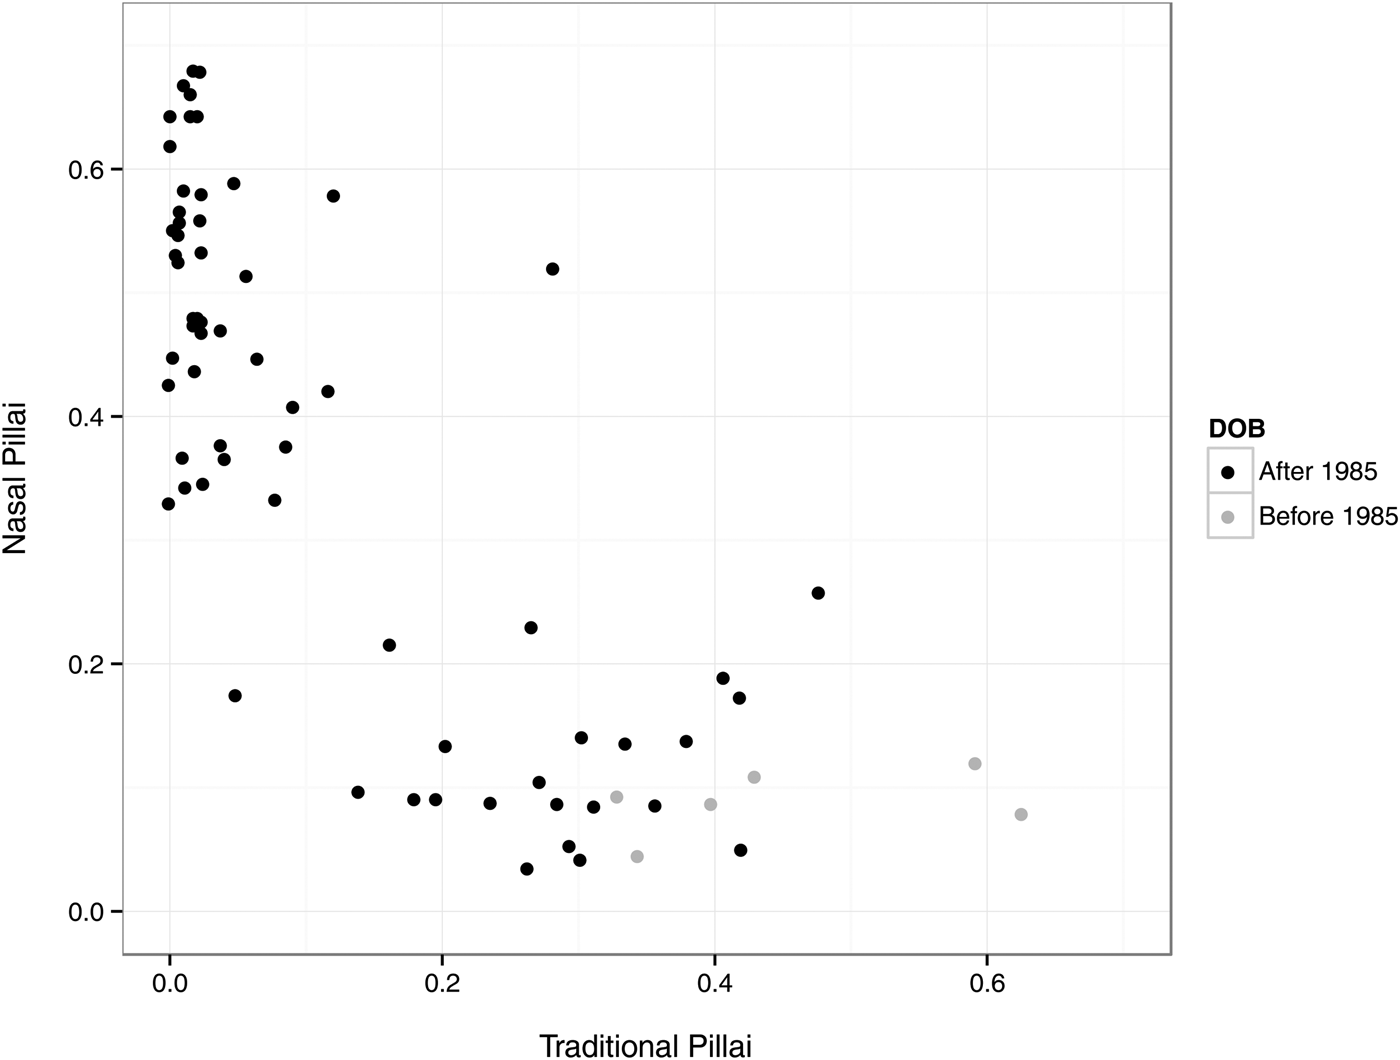
The gap between the two groups in Figure 6 indicates that we are dealing with an alternation of two systems rather than continuous changes in individual allophones. A Dip test for unimodality (Hartigan & Hartigan, Reference Hartigan and Hartigan1985) shows that the probability of this being a single distribution is very small: .0014. K-means clustering indicates that the optimum number of clusters is two. In other words, our data do not show White speakers with a merged target: their productions are dominated by either the traditional Philadelphia short-a system or the new nasal system.Footnote 9
SOCIAL FACTORS DETERMINING THE USE OF SHORT-A SYSTEMS
Given the existence of two distinct short-a systems among our IHELP subjects, we immediately want to know what determines which group a speaker belongs to.
Age must be a factor in this rapidly changing situation, but the IHELP age range is limited: the great majority of subjects are freshman or sophomore college students. We have some representation from the older generation from interviews with their parents. Figure 6 identifies five older speakers, born before 1985: they are all in the group that favors the traditional system, with nasal scores below .1 and traditional scores above .3. Moreover, they conform more strongly to the traditional system than most other members of the group. This echoes the general trend within the family to modify the traditional system, as noted in Fisher, Prichard, and Sneller (Reference Fisher, Prichard and Sneller2015). We will not be focusing on this aspect of the change here and will exclude these older speakers from the following graphs. We will then turn our attention to the major differences between the two groups of White college students.
Education
There is ample evidence that we have encountered a systematic “change from above” in which education plays a major role, and we will want to examine in some detail how the structure of educational institutions in Philadelphia implements linguistic change in the process of maintaining and exaggerating social class differentials. There is already strong evidence that speakers with higher education produce less extreme forms of the salient aspects of the Philadelphia dialect, and in particular the tense short-a (Labov, Reference Labov2001; Labov et al., Reference Labov, Rosenfelder and Fruehwald2013). Prichard and Tamminga (Reference Prichard and Tamminga2012) and Prichard (Reference Prichard2016) demonstrated such an effect of a hierarchy of national, regional, and local institutions. However, we may want to look earlier in the educational process to explain the behavior of our IHELP speakers. Of the 106 subjects analyzed, 86 are undergraduates. Of these, 34 are freshmen. From our pilot studies, it would seem that in many cases the shift toward the nasal system had already begun in high school or earlier.
Catholic and non-Catholic high schools
The IHELP students come to college from a wide variety of high schools. In addition to public schools, many graduate from Quaker private schools and charter schools. Some 10% of high school students are in schools administered by the Catholic church diocese.Footnote 10 Catholic schools in Philadelphia, particularly in the inner city, historically served the working and middle classes and are seen by many residents as an alternative to public schools. In Catholic schools today, 50% of attendees are minorities, but this statistic is potentially misleading with regard to the racial diversity of individual schools. About a third of Philadelphia's Catholic high schools are mostly (>70%) White, and another third are overwhelmingly (<10%) non-White. Meanwhile, only 1% of the district public schools are mostly White, and two-thirds are overwhelmingly non-White.Footnote 11 The elite public schools with special admission requirements and charter schools are intermediate between these, with 22% having mostly White students and 39% overwhelmingly non-White.
A major factor in the distributions of Figure 6 is the distinction between “Catholic” and “non-Catholic” high schools. Figure 7 displays a dramatic difference between enrollments in the Catholic school system and other systems, public or private. The group with short-a modeled on the traditional system is almost entirely composed of those who attended Catholic schools. Only one non-Catholic school speaker with a Pillai score above .2 is to be found on the horizontal axis of Figure 7.
Distribution of Pillai scores for White graduates of Catholic and non-Catholic high schools.

Race
African Americans were not included in the diagrams seen so far. Table 4 shows the results of Henderson's (Reference Henderson1996:130) study of 30 African American speakers, ages 8 to 81, mostly with higher education. On the whole, it shows some approximation to the traditional short-a pattern of the White community. Henderson also noted the occasional use of a “raised” vowel at the level of [ε], adding that this was a short-a feature of Blacks, but not Whites. Henderson's research also indicates that younger African Americans in the 1990s were moving in the direction of the nasal system. Figure 8 shows the increase with younger age of tensing before velar nasals in bank, bang, etc., with no comparable increase in other lax environments of the traditional Philadelphia system.
Increase in apparent time of tensing of short-a before velar nasals compared to other normally lax environments for African Americans (based on Henderson, Reference Henderson1996:130).
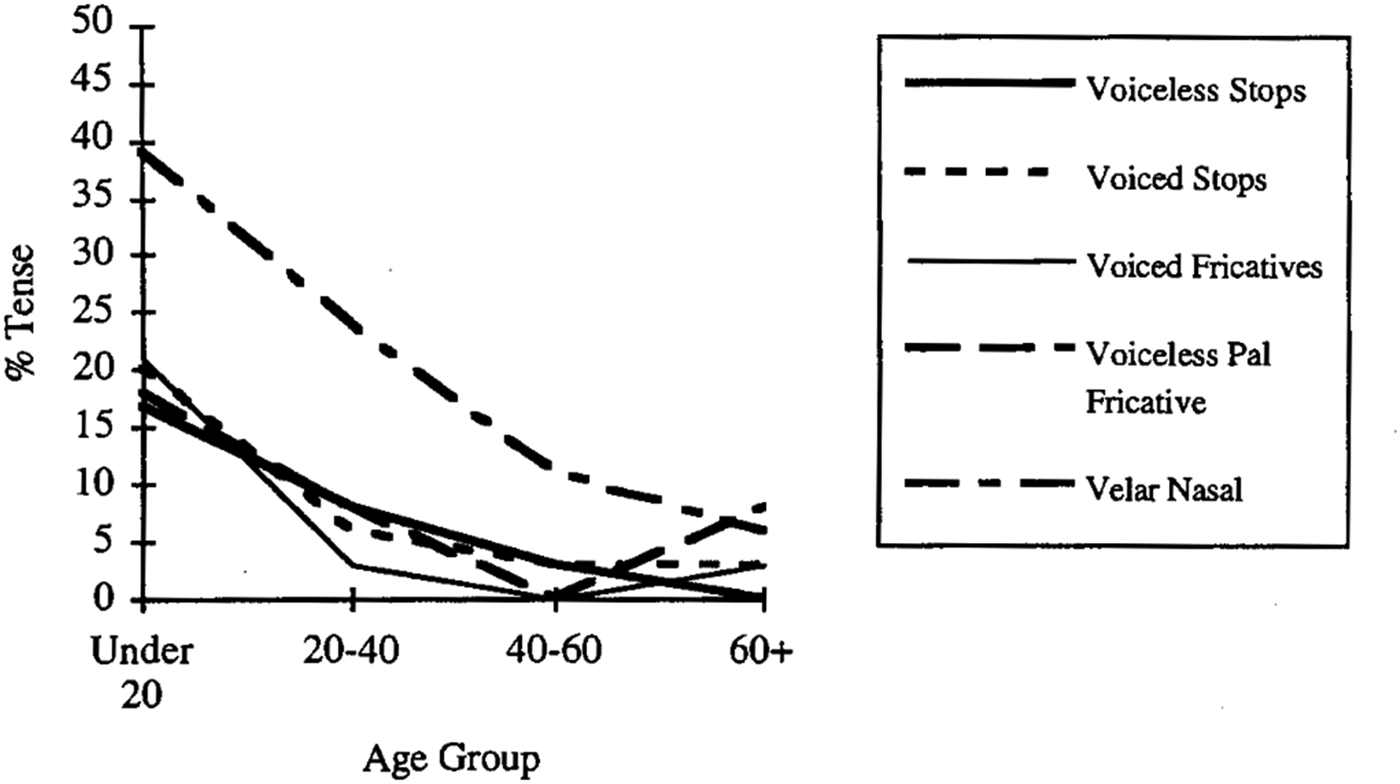
Percent tense, lax, and raised for 30 African American Philadelphians in casual speech

Data used with permission from Henderson (Reference Henderson1996:130).
Figure 9 shows Pillai scores for the 27 African American subjects in the IHELP database, again distinguishing those from Catholic (black) and non-Catholic schools (gray). It is immediately evident that all scores on the x-axis are very low—none above 0.2—indicating that they are not at all engaged in the traditional Philadelphia system. However, they do show values all along the y-axis, indicating a full range of participation in the nasal system. At lower left are seven speakers who show minimal use of either system. This “neutral” pattern eliminates the difference between tense and lax short-a. The most characteristic phonetic form is that noted by Henderson (Reference Henderson1996) as raised, a lower mid, slightly backed, and ingliding vowel [ε:ə], heard in back, that, and jacket as well as in ham, man, and bang. This is the short-a most typical of the highly segregated Black communities of Philadelphia where African American Vernacular English is most consistently used (Labov, Reference Labov2014). It differs from the mainstream system of Whites in two respects. First, there is no division into a tense and lax class. Second, the slightly centralized nucleus is located on the front nonperipheral track of phonetic space, which is distinct from the peripheral track on which tense vowels are raised.
Distribution of Pillai scores for African American graduates of Catholic and non-Catholic high schools. Named subjects discussed in the comparison of individual speakers section.

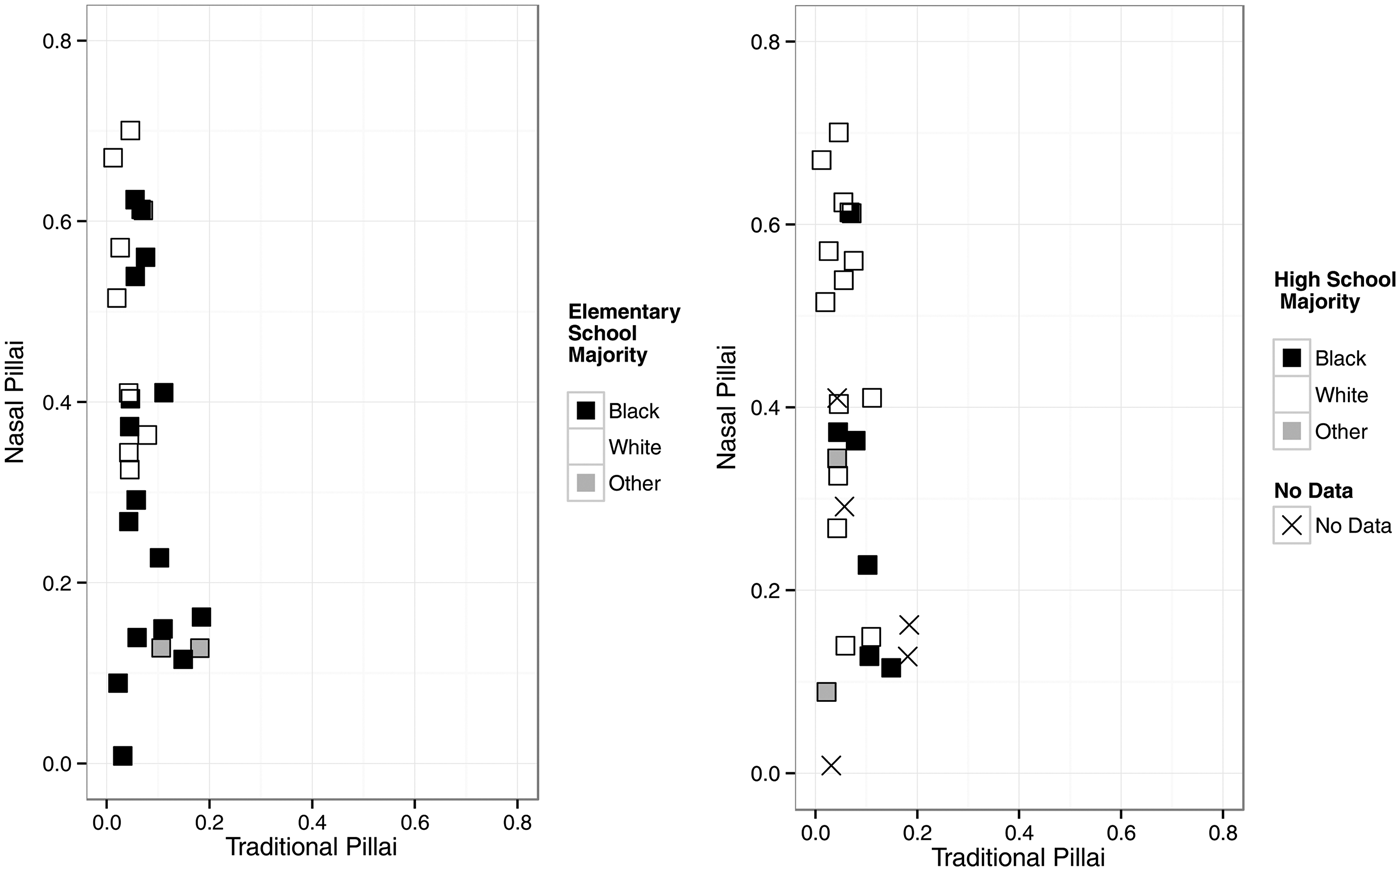
Figure 10 shows that African American participation in the nasal system is not as clearly defined by whether the school they attend is Catholic or not. The symbols at upper left are equally divided between the black and white symbols. Instead, we find that the ethnic composition of schools plays a larger role.Footnote 12 In Figure 9, the black, gray, and white symbols that label the 27 speakers indicate the ethnic composition of the elementary school the subjects attended (on the left) and of the high school (on the right). The connection between position on the vertical axis and ethnic composition is evident for elementary school. None of those who attended an elementary school with a White majority had scores on the y-axis below .3. And six of the eight subjects who moved to a White majority school in high school exhibit the nasal system. Participation of African Americans in the nasal system is then seen to be furthered by their contact with other groups from their earliest years. This is in line with research showing a similar correlation between school segregation levels and African American participation in sound changes associated with the local White community in the New South, particularly raised short-a (Kohn, Reference Kohn2016).Footnote 13
Pillai scores for African American subjects by ethnic majorities in elementary and high schools.
Differentiation by special admission
As we have seen, not all Catholic school graduates favor the traditional system. In Figure 7, a number of symbols for these students are found in the vertical column showing the unexpected production of the nasal system. The factors that lead a speaker to produce the nasal system must influence those in Catholic schools as well as others: what are they?
A variety of traits are associated with the preference for the nasal system. Our first approach to this question was influenced by a pilot study of students from the J. R. Masterman High School, who had uniformly adopted the nasal system; we heard this pattern echoed consistently in other contacts with this school. Masterman qualifies as an elite high school: it has the highest SAT scores in the state of Pennsylvania, with highly competitive admission procedures and a high level of success in sending graduates to nationally oriented universities such as the University of Pennsylvania. Eighteen of the 106 IHELP subjects are graduates of Masterman. Another elite public high school, Central, shows consistent nasal systems for the seven graduates in the IHELP sample. Three Quaker private schools show high academic achievement levels and high proportions of nasal system speakers among their graduates. But there is also variation within the Catholic high schools. Two of them—Nazareth Academy and Roman Catholic—rival the elite public schools in college admissions and also show a preference for nasal systems.Footnote 14 The problem of distinguishing “elite” from “nonelite” schools can be resolved by turning to the concept of “special admissions.”
The analysis of this reorganization relies on the social stratification inherent in the structure of the Philadelphia public school system that distinguishes among three types of schools: “neighborhood,” “city-wide,” and “special admissions.” Neighborhood schools have an attendance boundary that gives admission priority to students living within that boundary who can provide proof of residency for enrollment. Students living outside of this boundary are able to submit an application for acceptance, and acceptance is selected by lottery. For the neighborhood schools, academic performance does not factor into admissions. Both city-wide and special admissions schools require an application to attend, and admission is based upon entrance requirements including behavioral and academic performance. Although city-wide schools—which include technical and vocational curricula—have an element of competitive entrance requirements, the final selection for admission is made via computerized lottery. Special admissions schools, on the other hand, select successful candidates based upon a rigorous set of requirements that includes behavior records, test scores, and interviews. For children entering elementary school, acceptance into a special admissions elementary school may include several trial “play dates” with both the child and a parent, for further assessment. Higher level schools often require an interview.
The two elite Catholic high schools in our sample are distinguished by the similar criteria. The Nazareth Academy admissions page features a seventh-grade practice test as well as an eighth-grade entrance examination. The Roman Catholic High School admissions website advertises first, second, and third entrance tests and warns that “any student wishing to attend Roman Catholic is required to take the High School Placement Test” (Roman Catholic High School Admissions Process, 2014). In this process, academic admission tests are kept separate from scholarship examinations that determine how much financial aid will be offered. But on the website of another Catholic high school, Father Judge (Admissions Process, 2016), it states that “all 8th grade students who would like to compete for an academic scholarship must take the Scholarship/Placement Test.” The test is not required for admission.
Therefore, special admissions schools can be distinguished from neighborhood and city-wide schools in two ways. One is its lack of a lottery system for admission—in other words, special admissions schools admit by application. The other is behavioral standards that can include punctuality, attendance, and other behavioral standards. Special admissions schools offer curricula consistent with college preparation.
If we add this special admissions parameter along with the Catholic and non-Catholic school parameter to the distribution of Pillai scores in Figure 7, we see the pattern of Figure 11. Speakers who graduated from high schools in the special admissions class are indicated by figures with filled centers, while graduates of open admissions high schools are represented with an open circle. One can observe the strong trend for graduates of a special admissions high school to shift upward in the direction of the nasal system, both within the traditional area (along the y-axis) and within the nasal system column.
Distribution of Pillai scores for White graduates of Catholic and non-Catholic high schools by special (filled symbols) versus open admissions (open symbols).

REGRESSION ANALYSIS OF SOCIAL FACTORS
Table 5 shows the results of two separate linear regression models for the 86 IHELP speakers who are currently enrolled as undergraduates, predicting the Pillai score for each of the systems.Footnote 15 Nasal system models appear at left and the traditional system models at right. As we would expect, the ordering of the two series are the inverse of each other.
Regression coefficients for fit of 86 IHELP college students to short-a systems according to type of high school and type of college attended

The first factor group concerns the features of the high school that the speaker attended. High schools are clearly divided into Catholic and non-Catholic. Graduation from a Catholic school strongly favors the retention of the traditional system and disfavors the nasal system. A clear secondary effect is special admission. The 15 speakers from Catholic schools with special admission (Nazareth Academy and Roman Catholic) show a clear shift toward the nasal system as compared with the 19 with open admissions.
College types are grouped according to the likelihood of contact with students from areas where the nasal system predominates. Thus regional universities such as Temple and Drexel are least likely to promote the shift to the nasal system, while colleges outside of the Mid-Atlantic area favor that development.
We also see effects of gender and ethnicity. Females lead moderately in the shift to the nasal system and disfavor the traditional system. High school choice reflects social stratification with Whites, Asians, and girls admitted at a higher rate to special admission high schools (Gold, Evans, Haxton, Maluk, Mitchell, Simon, & Good, Reference Gold, Evans, Haxton, Maluk, Mitchell, Simon and Good2010). In 2007–2008, females were admitted to special admissions high schools as ninth graders at a rate of 62% versus 38%. Even excluding one all-female school (Philadelphia High School for Girls), the rate is 57% for girls and 43% for boys.
There is no significant effect of race on the nasal system, since as we have seen, African American subjects are spread out along the full range of the y-axis in Figures 9 and 10. There is however a strong effect of ethnicity on the use of the traditional system (p < .01), since the Pillai scores on those figures are all below 0.2: no African American speakers participate significantly in the traditional Philadelphia short-a pattern.
It is important to realize that the distinction between the types of schools in Philadelphia is a tiered system that was developed, not only to provide greater choice for students, but also to keep middle-class and upper-middle-class families from fleeing an increasingly poor, minority educational environment (Gold et al., Reference Gold, Evans, Haxton, Maluk, Mitchell, Simon and Good2010). Although the program is officially termed “school choice,” it is often a Hobson's choice for students. The guaranteed options are neighborhood schools, which have no academic requirements for admissions and are largely found in poor, minority areas.
Selection beyond neighborhood schools have documented problems largely related to a complex process that relies on parental guidance to the advantage of better educated, more involved parents. Moreover, principals have the flexibility to accept students who may or may not meet application requirements. This works to the advantage of parents with professional and personal connections in the schools and the school system. Special admissions schools are more likely to accept girls and students who are White and Asian. The students who are least likely to be accepted through special admissions are boys, Blacks, Latinos, and low-income students. Conversely, Blacks and Latinos are overrepresented in neighborhood schools. In 2007–2008, about 30% of students did not participate in school “choice” at all. Of those who did, more than 50% were not accepted to any of the schools that they had selected, relegating them to Hobson's choice status (Gold et al., Reference Gold, Evans, Haxton, Maluk, Mitchell, Simon and Good2010:9).
Parents who aspire to send their children to special admissions schools are in the best position to prepare their children, not only academically, but in terms of the behavioral goals. This would argue that early schooling is key in this social stratification. High school choices are made in eighth grade in the Philadelphia Public School System, but preparation must begin at a young age in anticipation of the best education. In this way, education can influence linguistic choice, reflecting social status and serving as a linguistic “social trajectory” (Prichard, Reference Prichard2016).
One may think of the social factors we have identified as a surrogate for social class and that we might have been talking about the institution of an upper-middle-class dialect in Philadelphia. This may be true: working-class Catholic parents who want to avoid public school have little choice but the open admission Catholic schools, where tuition is considerably lower than at the special admissions schools. But our focus here is on the consequences of this filtering situation that bear directly on the phonological system.
In studying the distribution of these two systems, we find that the Catholic school system in Philadelphia is a powerful conservative force. We also see that women lead as usual in linguistic changes that are associated with higher education and prestige. Most importantly, we find that the filtering devices set up by the elite school system constrain the behavior of the target population through admission procedures that determine who they will be talking to in the years to come.
COMPARISON OF INDIVIDUAL SPEAKERS
As we have pointed out, we are not studying variation between the two systems by individual speakers, but rather the degree of conformity of their overall short-a production to one system or another. Speakers tend to adhere to one of the two systems to a greater degree. For this paper, we consider speakers as participants of their dominant system, rather than analyzing them as switching between two systems. The greatest range of variation is found within institutions that favor the traditional system in one respect and disfavor it in another respect. These are two Catholic high schools with special admissions: Roman Catholic and Nazareth Academy. Both are strongly oriented toward higher education and send a good number of graduates to nationally oriented universities. Some further insight into the factors operating in this variation can be obtained by examining two pairs of individual speakers from these Catholic special admissions schools who differ markedly in Pillai scores as located in Figure 12.
Subjects from Catholic schools with special admissions. Named subjects to be discussed in the comparison of individual speakers section.

Christian R. and Jim M.
Christian R. (IH2–13) and Jim M. (IH2–26) are both 19-year-old sophomores who graduated from Roman Catholic High School, coming from Catholic elementary and middle schools (Christian: St. Adelbert, Jim: St. Cecilia's). Both were raised in the northern sections of Philadelphia (Christian: Port Richmond, Jim: Fox Chase).Footnote 16 Both are deeply involved in science and engineering. Both are at nationally oriented universities: Christian at Penn State, Jim at Penn. But in spite of these parallel trajectories, their short-a systems are radically different. Pillai scores for Jim are .438 (traditional) and .190 (nasal), while Christian's scores are .049 (traditional) and .474 (nasal).
Jim's family follows the traditional neighborhood pattern of local settlement.
Yeah, we're all in Philadelphia. All my cousins, and my aunts and uncles are all in Philadelphia. My grandparents are also still in the same house that, you know, my dad grew up in.
At Penn, he is doing well, but he avoids contact with business students in the Wharton School who congregate in Huntsman Hall:
I don't like—I never—I don't go to Huntsman. Like, it scares me, I don't belong there. … I refuse to walk in the door. I haven't—in two years, I have never gone inside Huntsman.
When asked directly about the Philadelphia dialect, Jim shows the prototypical positive (yet defensive) response:
IVer: So do you take it as a plus, having this accent, or a minus?
JM: I take it as a plus. Makes us different. If they make it sound like a minus I get a little angry. I think the Philly accent is just, you know, making words easier to pronounce.
Jim then shows a local configuration that promotes retention of the traditional system, in spite of his upward mobility. Christian, on the other hand, lacks the local family history and even more, the parental input to acquire the traditional system. His parents were both born in Poland, speak Polish at home, and he has no other relatives in the neighborhood. Even though he was raised in middle-class Fox Chase, the odds are very much against Christian acquiring the complex pattern of the traditional system. In the LCV study of King of Prussia, Payne (Reference Payne1976) found that only 1 of 34 children with out-of-state parents acquired the traditional system.
Furthermore, Christian was isolated from much contact with local institutions. Because his parents believed that the local bus and subways were “too ghetto,” he was driven to school almost every day. He never got into fights. He made new friends when he got into high school, but never got into trouble there, where he had “perfect conduct.” In college, his family calls him every day. Finally, it is interesting to note that, in contrast with Jim who avoids students in the business school, one of Christian's close friends is in the business school.
Ellie S. and Moone S.
Another such pair is Ellie S. and Moone S. Both are from northeast Philadelphia, from neighboring zip codes with similar income distributions (Ellie: Bustleton, Moone: Fox Chase). They both have families from the city, although Moone's mother is from southern New Jersey, which largely shares the traditional Philadelphia system. They went to the same special admissions Catholic high school, Nazareth. Nevertheless, their short-a systems diverge sharply, as located in Figure 11. While Ellie is at .42 (traditional) and .17 (nasal), Moone is at .12 (traditional) and .58 (nasal). Both speakers attended parish schools until middle school and neither enjoyed the experience. Ellie felt frustrated by the slow academic pace:
ES: Oh eighth—I think eighth grade I just hated everyone. By that point I was like, God you're so stupid just get away from me.
Moone was part of a group that was alienated and bullied at her school:
MS: There was like—six of us that were really good friends, and then like the rest of the grade [laughter] were friends and we were sort of like the outcasts.
In high school, their experiences diverge. Ellie, the traditional speaker, was well embedded in the social network of the school. She maintains close ties to her friends from Nazareth and to the school itself. She plans to get married in its chapel and wants to teach there after finishing her master's degree at a local Catholic university:
IVr: So did you—you always wanted to come back and work here?
ES: Oh yeah, that was it, like end-all be-all.
Moone, the nasal system speaker, had a different experience, going through a difficult period when she was 15:
MP: Nine months of depression. Let me tell you, I don't remember most of sophomore year of high school.
By her own account, it took her until the end of high school to gain social confidence:
MS: Totally felt like the dweeb in the corner, that's how I thought of myself.
By senior year […] it was like—Wait a minute! People actually like me! This is okay, like, this is—I could get used to this shit! Okay I'm graduating,
She then attended Penn and has spent some time in Texas. She plans to go to graduate school.
What becomes strikingly clear from this and other pairs is that overt attitudes toward the Philadelphia dialect do not necessary correlate with the acquisition or maintenance of the traditional short-a system. Neither do speakers’ accounts of their own accents. When asked about the Philadelphia accent, Ellie reacts negatively:
ES: Sometimes it makes my skin crawl. Like when I hear “youse,” it's like, ugh. Like, ‘cause I'm not used to it. Um, sometimes when you hear that […] stereotypical Eagles fan […] it's like, is that necessary?
She says that others do not perceive her as having a Philadelphia accent:
ES: She's like, “Wow, you don't sound like Philadelphia.” […] Like there were certain things that my neighborhood never said. We always said “you guys.” Never said “youse.”
Moone, in contrast, has a generally positive attitude:
MS I get really excited when I hear people with Philly accents.
MS: I say “wooder.” Very defensively […] Even in Texas, I would be like, “wooder.”
She reports accommodating to others’ speech to demonstrate her Philadelphia identity:
MP: My oldest brother, has a really thick accent.
And I definitely respond to it, like when I'm talking to my oldest brother, I definitely feel the need to like—have a strong like “I'm a real Philadelphian, I swear.”
She attributes her “neutral accent” to having moved away from a more working-class neighborhood (Tacony) when she was 9, and says that her brother retained his accent because he was older. However, Moone's distance from the traditional system is not accounted for by the neighborhood her family relocated to; it is Fox Chase, the same area that Jim, the traditional system member of the previous pair, grew up in.
The case of Ellie and Moone shows that different social experiences can lead to differential linguistic outcomes despite attendance at the same high school. It is also clear that what speakers have to say about the Philadelphia dialect may not match their degree of participation in the traditional short-a system.
Granted such limitations, there is much to be gained from examining speakers’ comments about Philadelphian features. This is evident in the case of Patrick C., a 19-year-old sophomore at Penn who also attended Roman Catholic High School. Patrick's family is strongly rooted in the northeast of Philadelphia; both of his parents were born and raised there and several extended family members live nearby. With a nasal Pillai score of .231 and a traditional Pillai score of .267, Patrick patterns with other speakers who maintain a traditional split in short-a categories, though not to the extent that Jim M. or Ellie S. do. Since coming to Penn, Patrick joined a fraternity and lives on campus with his fraternity brothers from other dialect regions. Asked whether anyone at school picked him out as coming from Philadelphia, he responded that people have trouble placing him because his vowels “sound weird.” He told the following story about an encounter with a fellow Penn student that hinges on his production of tense short-a before a voiceless fricative in the word “class”:
I remember I asked some girl if she was going to class [klε˔əs], and she said, “What?” and I said, “Are you going to class [klε˔əs]? What are you doing right now?” She said, “What is that?” I was like, “Class [klε˔əs]! Class [klε˔əs]! Where a teacher teaches you.” And then she's like, “Oh, you mean class [kla:s] or class [klɑ<:s]? Yeah, I'm going.” I was like “Oh, Okay.” Just shit like that.
It is noteworthy that Patrick is unable to accurately reproduce the phonetic target of the other student's lax short-a production, producing a mid low vowel [ɑ] rather than a production that would match his own lax /æ/ production. He then goes on to express that, although he knows people view his accent negatively, he has not made any long-term attempt to change it.
People just judge you. They probably think you sound dumb when you're not […] I mean, I didn't really care [about my accent] until now I'm in college and everyone points it out ‘cause they're not from Philadelphia, and makes me feel self-conscious. […] I don't have time to stand in front of a mirror and just practice talking. I think I did [try to change my accent] at first, and then when I started living in the [fraternity] house and stopped meeting new people every day, I feel like now it's just, it's staying the same ‘cause they can pretty much understand what I'm saying or get the gist of it.
In Patrick C.’s case, his assessment of own accent is at odds with how his accent is perceived and evaluated by other students at Penn. This may help explain his lack of strict adherence to either the Philadelphia system or the nasal system.
Figure 9 showed that variation among African American speakers is entirely confined to the nasal system, and Figure 10 demonstrated that this is most strongly correlated with their histories of early education. A comparison of individual African American speakers with similar backgrounds shows that differences in the use of the nasal system is connected with difference in the pattern of the racial contacts in early education.
Tom S. and Tim W
Tom S. and Tim W. are two best friends who attended the same middle and high school. Tom S., who is 19 years old, leads the nasal system speakers with the highest nasal Pillai score among African Americans at .70. Tom attended a majority White (64%) elementary school. On the other hand, 18-year-old Tim, has a nasal Pillai score of only .41. Tim attended elementary schools in the predominantly Black neighborhood where he grew up (~81% of his schoolmates would have been Black). Both Tom and Tim attended Masterman middle and high school, the elite public school with a 25% Black and 41% White student population. Since Tom and Tim were part of the same social network during middle and high school, their differential participation in the nasal system can best be explained by early contact with predominantly White or Black speakers. However, it can be pointed out that this difference overlaps with social class differences between the two subjects as illustrated by their parents’ occupations: Tom is the son of a Philadelphia judge and a lawyer, while Tim's parents are the senior vice president of a bank branch and a firefighter.
Athena, Danielle, and Fabiola C.
The effect of school composition can be clearly seen within a single family, as shown by 18-year-old Athena C. and her two younger sisters, Danielle and Fabiola. Athena is also among the top African American nasal system speakers with a nasal Pillai score of .61. Up until high school, Athena attended majority Hispanic or Black schools within Philadelphia. For high school, she went to a predominantly White boarding school in New Hampshire (56% White, 23% Asian/Pacific Islander). Athena comments that high school left her with friends from all over the country, indicating that a relevant part of her high school experience was not only interethnic contact, but also dialect contact. Thus her high nasal Pillai score can be attributed to peer influence during her high school years. On the other hand, her two younger sisters, 15-year-old Danielle and 14–year-old Fabiola, had very different academic trajectories. Danielle attended a mixed elementary school (42% Black, 38% White) but later a majority Black (97%) middle school, while Fabiola attended a majority Hispanic (89%) elementary school and then a majority Black (91%) middle school. Their high school, KIPP DuBois, continues the pattern of Black majority (94%). Though it is described as a college-preparatory school, it has open admissions. Nasal Pillai scores for Danielle and Fabiola are .01 and .13, respectively, indicating adherence to the African American Vernacular English (AAVE) neutral short-a system, as would be expected given the ethnic compositions of their schools. Thus, when family social class is equal among speakers, the difference in school ethnic composition is a crucial factor in determining the degree of participation in the nasal system.
CHARTING THE FLOW OF SHORT-A SYSTEMS ACROSS EDUCATIONAL INSTITUTIONS
Here we examine systematically the relationship between participants’ vowel systems and their educational history that was indicated at the end of the comparison of individual speakers section. First we establish the numerical basis for the classification of Pillai scores, maximizing the distinctions between populations. Figure 13 combines both White and African American speakers in a single Pillai diagram, identified by the admissions type and Catholic/non-Catholic status of their high schools. African American speakers are clustered around the y-axis, demonstrating their conformity to either the neutral system or the nasal system. Based on this diagram of all speakers, we obtain maximum differentiation by classifying speakers into one of three categories. If their Pillai scores are below .2 on the x-axis and .26 on the y-axis, they are classified as neutral short-a system speakers. This area remains unshaded in Figure 13. If a speaker's Pillai scores are above .2 on the x-axis and below .26 on the y-axis, he or she is classified as a traditional short-a system speaker. This area is shaded lightly in Figure 13, and these speakers are coded accordingly in Figure 14. Finally, if a speaker's Pillai scores are above .26 on the y-axis and below .2 on the x-axis, they are classified as a nasal system speaker. In this way, we classify the continuous measurement of Pillai scores into three discrete systems: neutral, traditional, and nasal.
Distributions of Pillai scores for all speakers. Points within the lighter shade along the x-axis are traditional system speakers, within the darker shade along the y-axis are nasal system speakers, and the lower left corner are neutral speakers.

Educational paths followed by IHELP subjects from middle school to high school. Circles = White speakers; squares = Black speakers.

We now turn to the relationship between these three vowel systems and the educational history of speakers who exhibit them. Figure 14 draws on work on bipartite social networks (Dodsworth, Reference Dodsworth2014), which uses the concept of institutions as surrogates of social networks.
In Figure 14, White speakers are represented by circles and African American speakers are represented by squares. The speaker's conformity to the traditional, nasal, or neutralized system is indicated in the legend. Each speaker is connected along a straight line from his or her middle school to the high school attended. The term “public” is used for “non-Catholic,” including Quaker private schools, and the suburban public high schools are labeled “suburban.”Footnote 17
Plotting each speaker's educational history and vowel systems in this way demonstrates the clustering of short-a systems around specific types of schools, and enables several striking patterns to emerge in Figure 14. First, the special admissions public schools (in the lower left-hand quadrant) are entirely nasal system or neutral system speakers: not one traditional short-a speaker is found among graduates of these schools. Second, the Catholic school system (on the upper right) contains the highest concentration of traditional system speakers. This is particularly true for the open admissions Catholic schools (top center), which produce the highest concentration of traditional system speakers of all the school types.
Figure 14 adds considerable information to what was learned from the regression analysis of Table 4. Previous studies of large cities have emphasized the uniformity of the phonological structure (New York City: Labov [Reference Labov1966]; Great Lakes cities: Labov et al. [Reference Labov, Rosenfelder and Fruehwald2013]; Philadelphia: Labov [Reference Labov2001]). Here we see a sharp division into two competing structures, mediated by the educational institutions. The gray lines in Figure 14 show movement from middle school to high school. Of the 85 students charted, only 3 moved from Catholic to public and only 2 moved from public to Catholic. How long this bifurcation will last is difficult to say: 19 of the 32 Catholic students have already absorbed the new nasal system.
OVERVIEW
In this report we have introduced a new type of variable, somewhat more complex than those that have been studied before. Speakers oscillate between two different systems rather than two different realizations of a category within a system. The change is a phonological change, at a higher level of abstraction than previous changes. We have seen the college-bound African American population shifting between the neutral and the nasal system, while the mainstream White population chooses between the complex traditional system and the nasal system. We find that the phonological ingenuity of Philadelphians, both Black and White, has been enlisted in the service of social mobility.
Our previous studies of change in progress in the Philadelphia dialect have shown a reversal of the long-term fronting of the back upgliding vowels /uw, ow, aw/, led by those with higher education (Labov et al., Reference Labov, Rosenfelder and Fruehwald2013:Figure 13). These small phonetic shifts are overshadowed by the dramatic alternations we have observed here, replacing [me:əd] with [mæ:d] and [spænɪʃ] with [spe:ənɪʃ].The upwardly mobile speakers of the Philadelphia dialect have thrown a phonological switch that differentiates them from the local dialect more clearly and decisively than in previous decades.
It follows that we have done more here than trace another linguistic variable. Instead, we have introduced the study of the competition between phonological systems of variables. Future work may investigate how the competition of the two systems is realized in the dynamic output of each speaker.



