‘European elections are additional national second-order elections. They are determined more by the domestic political cleavages than by alternatives originating in the EC.’
Karlheinz Reif and Hermann Schmitt, ‘Nine Second-Order National Elections’, p. 3.
It is well known that national governing parties are ‘punished’ at European Parliament (EP) elections. Studies of the past six EP elections have shown that governments often win fewer votes than in preceding national elections; yet we still have a limited understanding of why voters decide to defect from governing parties. Most scholars in the field rely on the ‘second-order national election theory’. This posits that elections are mid-term contests in the battle to win national government office, where vote choice is primarily decided by domestic political concerns.Footnote 1 Particular patterns of voting, such as defection from governing parties, but also low levels of turnout and greater success for smaller parties, have been taken as supporting evidence for this theory. However, the same patterns of voting could also be attributed to factors relating specifically to concerns about European integration rather than domestic calculations. Studies of recent EP elections have found some evidence that voter defection cannot be solely attributed to domestic politics.Footnote 2 These studies employ primarily aggregate-level data analysis, however, which makes it difficult to disentangle the motivation behind individual vote choices. Additionally, none of these papers accounts for the mechanisms that would lead voters to defect on the basis of the European dimension. In other words, if European integration does matter in EP elections, then how and why does it matter?
In this article we address the question of why voters desert governing parties in EP elections. The answer to this question has important implications for our understanding of democracy in the European Union (EU). If vote choices are based on preferences concerning European integration, rather than purely domestic concerns, this implies that there is a connection between citizens’ choices and EU governance that has hitherto typically been said not to exist. To understand the motivation behind government defection in EP elections, we examine both individual-level data on voter preferences and contextual-level data on the campaign, hypothesizing that certain types of campaigns will ‘activate’ the European issue at the individual level.
This article proceeds as follows. After briefly reviewing theories from the existing literature, we present our theoretical expectations of how voter preferences concerning European integration and the priming effect of the campaign are likely to influence defection from governing parties in EP elections. We then explore aggregate patterns of voter preferences and party positions on the left–right and European integration dimensions. Finally, using multi-level modelling techniques, we test these propositions with individual-level data from the last two EP elections as well as data on campaign coverage in each member state.
Voting behaviour in European parliamentary elections
One of the key empirical findings in the EP election literature is that parties holding office in domestic governments tend to do poorly in EP elections. As mentioned above, the most common explanation of this phenomenon is the ‘second-order national election’ thesis. At the heart of Reif and Schmitt’s theory is the proposition that EP elections are of lesser importance than first-order elections for national office.Footnote 3 This second-order nature of EP elections has consequences for several aspects of voting behaviour. First, levels of turnout tend to be lower than in national elections. Secondly, citizens are more likely to vote sincerely than strategically, and this in turn will tend to favour smaller parties. Thirdly, and most importantly for our purposes, EP elections allow voters to express their dissatisfaction with governing parties. According to the theory, the extent to which governments are punished in EP elections depends on the timing of the election during the national electoral cycle and the incumbent government’s performance. This has its roots in theories of mid-term elections in the United States, where the president’s party tends to enjoy a comparative disadvantage.Footnote 4 This can either reflect a natural ‘cycle of popularity’ for governing parties, which declines mid-term, or a negative retrospective judgement on economic performance.Footnote 5 The key assumption of the second-order theory is that any defection from governing parties in EP elections is primarily due to an evaluation of parties on the basis of domestic politics, be it general government popularity, economic performance or sincere voting for smaller parties, rather than an evaluation of candidates on the basis of concerns specific to the European Union.
Thus, for a long time, the consensus in the literature has been that, ‘opinions on European integration … hardly matter’.Footnote 6 However, defecting from governing parties may not be entirely due to the general decline in government support at mid-term; it may also be caused by dissatisfaction with the position of these parties on the European integration dimension. The evidence of voter defection from governing (and large) parties to opposition (and small) parties in EP elections raises the methodological problem of observational equivalence. That is, the differences in support levels for parties in national and European elections may be due to the fact that voters are unhappy with the performance of governing parties in the first-order (national) arena, but it may be equally a result of voters disagreeing with these parties on second-order (European) issues. As Reif and Schmitt acknowledged: ‘Of course, the politics and behaviour of political parties in the specific arena where second-order elections are held play some role. There is less at stake to be sure, but there is still something at stake nevertheless.’Footnote 7
This alternative ‘Europe matters’ hypothesis – that differences in vote patterns are due to differences in policy arenas – has received much less attention and systematic treatment in the scholarly literature compared with the second-order hypothesis. Nonetheless, recent studies do find some evidence that the European dimension influences voting patterns in EP elections. In his analysis of the 1999 EP elections, Marsh notes that ‘European orientations do seem to matter to some degree in voters’ decisions to stay with or switch from their general election party choices’.Footnote 8 In another study of vote switching, Carrubba and Timpone demonstrate that whereas vote switching is primarily due to second-order concerns, many voters also seek a balanced representation between national and EP elections.Footnote 9 Such behaviour is more pronounced among individuals who perceive the EP to be more powerful. This study does not explicitly examine the effect of EU attitudes on vote switching, but the findings do suggest that defection from governing parties is not necessarily a product of individuals treating EP elections as second order.
Two other recent articles by Ferrara and Weishaupt and by Hix and Marsh use aggregate-level data to assess the relative impact of the ‘second-order’ model and European factors.Footnote 10 Ferrara and Weishaupt find that neither the salience given by parties to the European Union nor their stance on European integration appear to have any effect on EP performance. Yet they also show that parties experiencing deep divisions on the European integration issue suffer substantial defection at EP elections, which suggests that the European dimension may make some difference to vote choices. In a systematic comparison of the ‘second-order’ and the ‘Europe matters’ theses, Hix and Marsh employ aggregate-level data from the past six EP elections to analyse whether voter desertion of governing parties is punishment over domestic matters or protest against the European Union. In support of the second-order approach, they demonstrate that large parties tend to lose votes in EP elections regardless of their left–right placement or their position on European integration. Yet they also find some electoral gains for anti-EU parties and parties that emphasize the European issue, but mainly in the old member states. On the basis of this mixed evidence, Hix and Marsh conclude that ‘ “punishment against governments” rather than “protest against the EU” [is] the primary force making European Parliament elections different from national elections’.Footnote 11 While both of these papers present rigorous attempts at disentangling the different motivations that lead voters to desert governing parties at EP elections, as Ferrara and Weishaupt rightly point out, ‘the inferences that can be made about individual voting decisions from aggregate data are quite limited’.Footnote 12
To assess the relative impact of domestic and European factors in determining defection from governing parties, we have analysed voter preferences using survey data from the two most recent EP elections. We are not just interested in how individual voters’ attitudes towards integration affect vote choice, however. We have also examined the effect of specific contextual factors related to the election campaign. It is notable that the current literature contains no systematic attempts to examine how the context of the election campaign influences vote choices at EP elections, yet for low saliency elections this seems a crucial part of the story. At a minimum, if coverage of the European Union affects patterns of voting, this suggests that EP elections are not purely about national politics. More generally, we expect certain types of coverage to ‘activate’ voters’ views on European integration and make the issue more important in deciding whether to defect. To capture both individual-level choices and the impact of campaign context, we estimate a multi-level model of voting behaviour in EP elections. This article thus contributes to the debate on EP elections not only by examining the extent to which Europe matters to vote choices, but also by addressing the question of how and why it matters.
Explaining defection in European elections
The debate over the future of European integration has become an increasingly salient dimension in European politics in recent decades.Footnote 13 Although the issue still plays a limited role in most national election campaigns, the high-profile campaigning of Eurosceptic parties, such as the UK Independence Party in Britain, the June movements in Denmark and Sweden and Europa Transparant in the Netherlands, has underlined the salience of this issue dimension in European politics. The electoral success of these Eurosceptic parties also suggests a gap between mainstream parties and voters in their opinions on European integration, which may be an important factor causing defection from governing parties. Whereas most explanations of the electoral loss of governing parties focus almost exclusively on national politics, an alternative explanation is that differences in vote choices are caused by the shift in the policy arena from the national level to the European Union. Following a spatial approach to voting, voters are expected to support parties which hold policy positions most similar to their own on a given dimension or those which pull policy in their direction.Footnote 14 But the saliency of a policy dimension does not necessarily stay constant across elections and arenas. For some voters each policy arena may be associated with specific issue dimensions that are of primary salience to their vote choice. It would be entirely rational for voters to care more about issues relating to European integration in EP elections, for example, whilst ignoring these issues in national elections. When respondents were asked after the EP elections whether they are interested in the EP elections, 43/39 per cent of respondents answered ‘a little’ and 33/34 per cent ‘somewhat/very’ in 1999 and 2004 respectively, and only a quarter of the electorate said that they had no interest in EP elections.Footnote 15 From various studies, we know that the relative salience of issues in different situations affects political behaviour.Footnote 16 In other words, while the European integration issue may play a small role in deciding vote choice in national elections,Footnote 17 it may lead voters to desert that same party in the EP election where the EU dimension is more salient to them. This leads us to our first hypothesis:
Hypothesis 1 The greater the distance on the issue of European integration between voters and the party they previously supported, the greater the chance of defection or abstention from that party at EP elections.
In spatial proximity terms, this implies that voters are more likely to defect in EP elections the further the distance between their ‘ideal point’ and the location of the governing party on the EU dimension. We do not suggest that proximity on other dimensions, such as the left–right dimension, or satisfaction with government performance, are irrelevant. Rather, we argue that even when controlling for other important domestic factors, whether policy or performance, preferences on the European integration dimension can help explain the large differences in voting behaviour between national and EP elections.
Moreover, we do not expect EU attitude differences between voters and parties to have a symmetrical effect on vote choices. Although the proximity model would lead us to expect that voters would be equally likely to defect regardless of whether they feel more in favour or more against further European integration than their favoured party, the actual vote decision is constrained by the political alternatives available to voters. In other words, defection on the basis of issue voting requires that another party offers a position closer to the voter’s ideal point. We know from the literature on party positions that mainstream parties normally adopt very similar pro-European positions.Footnote 18 Indeed, if we compare the positions of government and opposition parties on the European integration dimension using party expert survey data,Footnote 19 we see much higher support for integration amongst ruling parties than amongst opposition parties. In 1999, the mean placement of government parties on a ten-point scale (where 1 is the most pro-EU and 10 is the most Eurosceptic) is 2.6 compared with 5.0 for opposition parties. In 2004, the comparable figures are 3.8 and 5.1. In 1999, there was an opposition party with a more Eurosceptic position than the governing parties in every member state. In 2004, this was the case in twenty out of twenty-three countries (the exceptions were Austria, Italy and Portugal).Footnote 20 We would thus expect to see defection primarily among voters who are less in favour of integration than their party. Whereas voters who are more Eurosceptic than their party can find alternatives (mainly on the fringes of the left–right political spectrum), voters who favour more integration are in most countries unlikely to find parties that adopt a significantly more pro-European position than the governing party. This leads to our second hypothesis:
Hypothesis 2 Voters are more likely to defect or abstain if they are less supportive than their party of European integration.
This expectation implies that the likelihood of defection is based on the direction of distance from the party, as well the size of the distance on the European integration dimension. This is not the only way in which the European dimension may affect voting decisions, however. In addition to individual-level factors, we also expect the campaign context to influence political behaviour. The existing literature has paid little attention to whether the campaign influences voting behaviour. This is largely because EP elections have been characterized as lacklustre affairs with a largely domestic, rather than a European, focus. Even if campaign intensity tends to be lower in EP elections compared to national elections, we know that the intensity and tone of EP campaigns vary between countries, and it is very plausible that different campaigns could lead to different patterns of behaviour. Given our specific interest in defection from governing parties, a key aspect of the campaign is the tone of the coverage of the European Union. The literature on elections and referendums tells us that positive and negative coverage of the candidates or issues can affect voters’ perceptions and preferences.Footnote 21 Similarly, we would expect that more negative coverage of the European Union will lead to higher rates of defection as negative campaigns will generate higher levels of dissatisfaction with the predominantly pro-European stance of governing parties. This leads to our third hypothesis:
Hypothesis 3 Campaigns that are predominantly Eurosceptic in tone increase the likelihood of defection from governing parties.
Note that we do not expect the campaign tone to have the same effect on abstention as on defection. There is mixed evidence regarding the effect of campaigns on turnout. On the one hand, some scholars have suggested that negative campaigns can have an adverse effect on turnout in elections.Footnote 22 On the other hand, some studies have shown that negative campaigns can in fact mobilize turnout, at least up to a point.Footnote 23 Given this continuing debate on the effects of campaign tone on turnout, it is difficult to predict whether campaign tone will have a mobilizing or demobilizing impact, and we make no specific predictions here.
If it seems reasonable that voters may be more likely to defect over European issues because these issues are more salient in EP elections than in national elections, then we might also expect that the campaign context will condition the impact of European attitudes on vote choices. That is, we would expect a campaign context in which criticism of the EU is dominant to accentuate the importance of Eurosceptic attitudes and to increase voters’ likelihood of defecting due to differences from their party on EU integration. In other words, we expect an interaction effect between the campaign context and the EU preferences of voters in their impact on vote choices.
Hypothesis 4 Voters are more likely to defect from governing parties because of differences in opinion on European integration when the campaign context is Eurosceptic.
To summarize, if voters’ attitudes about European integration and campaign coverage of the EU influence behaviour, then this suggests that EP elections are more than just second order national elections and that the European dimension plays a role. The next section describes in detail how we test our hypotheses empirically.
Data and methods
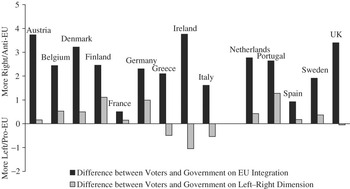
Before testing our hypotheses in a multi-level model of voting behaviour, we first compare aggregate-level data on party and voter positions to explore differences in attitudes towards European integration. Our expectation is that there is a significant gap between the integration positions of governing parties and those of voters, and that this gap is greater on the European integration dimension than on the dominant dimension in domestic politics, namely the left–right dimension. Using the expert survey data detailed earlier, we calculate the mean position for each national government in power on support for, or opposition to, further European integration and on the left–right dimension and, using the European Election Studies (EES), we calculate the mean position of governing party voters on the same two dimensions.Footnote 24Figures 1 and 2 show the results of the difference between voter and party position on each dimension for each country in 1999 and 2004.
Comparing distances between voters and government on two dimensions, 2004Sources: Kenneth Benoit and Michael Laver, Party Policy in Modern Democracies and 2004 European Election Study. Note: See Appendix Table 4A for questions used. Data on left–right party placement were not available for France.

Comparing distances between voters and government on two dimensions, 1999Sources: Gary Marks and Marco Steenbergen, 1999 Expert Survey on National Parties on National Parties and the European Union and European Election Study 1999 Note: See Appendix Table 4A for questions used. Data on party placement for either dimension were not available for Luxembourg.

The results are telling. First, looking at the 2004 results (Figure 1), we see that in twenty out of twenty-three countries, voters for governing parties are more Eurosceptic than their own parties. The countries with the biggest differences between voter and party position on European integration are the new accession countries, but the differences, while smaller, are present in nearly all of the old member states. On the left–right dimension, we find that some electorates are more left-wing, whilst others are more right-wing, than their respective governing parties. Turning to 1999 (Figure 2), we see that in every country, voters are more Eurosceptic than their parties and again differences on the left–right dimension are present, but are both smaller and much less systematic. Overall, these figures clearly demonstrate that differences between governing parties and their voters are much greater on the European dimension than on the left–right dimension, and moreover these differences are systematically biased with governing parties generally more Europhile than their voters. This corroborates our expectation that voters may be more likely to desert the governing parties in elections that focus on European integration issues – specifically, EP elections.
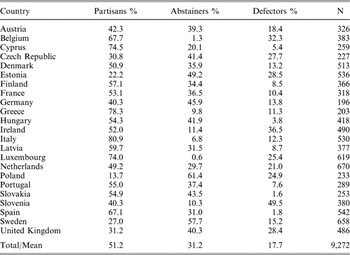
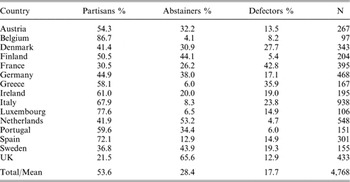
To examine whether this proposition holds at the individual level, we use the European Election Studies. We analyse the two most recent studies that were conducted immediately following the 1999 and 2004 EP elections. Since the focus of this article is on defection from governing parties, we look only at those voters who voted for one of the parties that won national office in the most recent national legislative election.Footnote 25 We have categorized these ‘governing party voters’ into three groups: partisans, abstainers and defectors.Footnote 26Partisans are voters who voted for a governing party in both national and EP elections. Among the twenty-three EU countries in 2004 for which we have data,Footnote 27 the mean proportion of partisans was 51 per cent, ranging from a low of 14 per cent in Poland to a high of 81 per cent in Italy. In 1999, an average of 54 per cent of voters were partisans, ranging from 22 per cent in Britain to 87 per cent in Belgium. The second group, abstainers, represents those who defected in the EP elections by abstaining. Again, we see a great deal of variance across the countries: a range of 52 and 60 percentage points in 2004 and 1999 respectively, not considering those countries with compulsory voting.Footnote 28 Finally, we look at defectors: those who voted for an opposition party in the EP elections. On average, around 18 per cent of governing-party voters defected in each election, with great cross-national variation (see the Appendix, Tables 2A and 3A for complete results). These results thus confirm that levels of defection and abstention are very high in EP elections: the question is why?
To test the hypotheses outlined in the theoretical section, we estimate a multiple regression model predicting defection and abstention. For both statistical and substantive reasons, we cannot simply pool these national surveys and ignore the fact that individual vote choices are also nested within a national context. Neglecting the hierarchical structure of the data would lead to an underestimation of standard errors and the likelihood of spurious inferences. One possible empirical strategy is to estimate a ‘dummy variable model’, which overcomes the statistical problems associated with dependence of observations within clusters (groups) by assigning fixed effects to higher level units.Footnote 29 However, this approach does not allow us to examine how various aspects of the higher-level units influence individual-level behaviour. As discussed above, we are interested in exploring whether contextual factors, such as the campaign tone, affect the likelihood of defection and condition the individual-level determinants of voting, and to what extent such factors can explain the variation in defection and abstention between countries.
Hierarchical (or multi-level) modelling is one method that allows us to explicitly model differences in voting behaviour according to the national context.Footnote 30 Such models also correct for dependence of observations within countries (intra-class correlation) and make adjustments to both within and between parameter estimates for the clustered nature of the data.Footnote 31 As mentioned above, we are interested in examining two types of defection: voters who voted for a governing party in the last national election who then decided to vote for an opposition party in the EP election (defectors) and those who decided to abstain in the EP election (abstainers). Since both dependent variables are binary, we estimate a hierarchical generalized linear model with a logit link function and a Bernoulli sampling model.Footnote 32
Our individual-level model of voting behaviour in EP elections has two main components, a domestic politics component (left–right attitudes, satisfaction with the economy, government approval and party identification) and a European component (European integration attitudes). To test the relative impact of the distance between a voter’s ideal points and the positions of the party she voted for in the national election, we include two distance variables: one for the left–right dimension and one for the European integration dimension. These distances have been calculated by subtracting the respondent’s self-placement on the EU and left–right dimensions (ten-point scales) from the position of the party, according to the expert survey data.Footnote 33 In Model 1, we use absolute distances (without regard to the direction) as explanatory variables in order to test our first hypothesis: greater distances increase the likelihood of defection. In Model 2, we test the second hypothesis: distances matter more when voters are anti-EU than when they are pro-EU. Absolute distances on the EU dimension have therefore been replaced by a variable that captures both direction and distance by measuring only the distances of voters who are more Eurosceptic than their party.
In addition to these two distance variables, the model also includes additional control variables: social class, age, party attachment, satisfaction with the economy and general satisfaction with the government.Footnote 34 Literature on previous EP elections has found each of these variables to have a significant impact on turnout and/or party choice in EP elections.Footnote 35 Social class is a five-point measure of subjective class position, ranging from working class to upper class. Party attachment is the feeling of being close to a (governing) party, measured on a four-point scale: Not close, Sympathizer, Fairly close and Very close. In order to alleviate the problem of missing data,Footnote 36 we have coded those respondents who answer ‘Don’t know’ to the question of party attachment as ‘Not close’. Age is measured in years. We would anticipate that older, middle-class voters with a strong attachment to the party are less likely to defect.
The individual voter’s evaluations of the economy and of the government are key variables in the second-order explanation of defection. Assessment of the economy compared to the previous twelve months is measured on a three-point scale from worse to better, whereas government approval is a binary ‘approve/disapprove’ variable. We know from the literature on economic voting that voters’ evaluation of the economy has a significant impact on their likelihood of re-electing the incumbent;Footnote 37 hence, by including this variable in the model in addition to distance on the left–right scale, we seek to capture part of the domestic and ‘second-order’ factors that may lead voters to defect. We also include general government satisfaction to try and capture other aspects of government performance aside from the economy. This raises the possibility of endogeneity with the dependent variable.Footnote 38 Nonetheless, since we are only interested in using approval and economic perceptions as control variables, some over-estimation of these effects should only increase our confidence in the results presented here concerning the impact of European issues.
The multi-level model can be expressed as a single equation for each level. The individual-level (Level 1) structural model is thus:

where the outcome is the transformed predicted values (using the logit link function), i indexes individuals, j indexes each country. Since the individual-level residual variance follows directly from the success probability (of defection), this model does not include a separate parameter for the Level 1 variance. A similar model is estimated for abstention.
Of course, we are not only interested in the individual-level correlates of defection, but also in how the political context affects voting behaviour. In particular, we are interested in the tone of the EU coverage during the campaign. We use data from the cross-national media studies carried out in 1999 and 2004.Footnote 39 These media studies conducted a systematic coding of national television and newspapers in every EU member state and include a measure of the tone of the news, namely, ‘explicit evaluations of the European Union, its institutions and/or policies’.Footnote 40 The news was coded on a scale from very negative to very positive. To ensure comparability, we have rescaled each set of codes to a ten-point scale from −5 for the most negative campaign coverage tone to +5 for the most positive tone.Footnote 41 Despite the pro-European political elites, the campaign tone was predominantly negative in most countries in both 1999 and 2004. In 1999, the most positive tone was found in Spain and the most negative in Greece and Denmark (the mean campaign tone was −0.10 with a standard deviation of 0.67). In 2004, the new member states of Cyprus and the Czech Republic presented the most EU-positive campaign environment, whereas Greek media again gave the most negative portrayal of the European Union, followed by Portugal and Britain (the mean campaign tone was −0.38 with a standard deviation of 0.33).
We also include a number of control variables at the national level. Given the limited number of countries included in our study, parsimony is very important at the Level 2 (national) specification of our model. Hence, we restrict controls to: timing of the election, experience with democratic institutions and size of the governing party. It is well established in the literature that the level of defection depends to some extent on the timing of the EP election in the national cycle.Footnote 42 To examine the effect of the national election cycle, we include a variable to indicate years since the last election (to the nearest month), as well as a squared term to capture the hypothesized curvilinear effect. It also seems likely that experience with democratic institutions in general will affect levels of defection and abstention. Hence, we also include a dummy variable for the seven newly democratized countries in our sample.Footnote 43 Finally, we also include a measure of governing party size – the percentage of legislative seats that the governing party gained in the last national elections. In line with the second-order election thesis, the literature has shown that voters are more likely to punish large parties in EP elections, so we control for governing party size.Footnote 44
At the country level, we model the individual-level constant βoj as a function of following party-level and country-level predictors:

By specifying a Level 2 random effect u 0j, we avoid imposing the difficult assumption that our model accounts for all possible sources of contextual heterogeneity. Moreover, we can test the effect of various country-level variables.
In our final model, we also include a cross-level interaction between campaign tone and individual distance from the party on the EU dimension to test whether the campaign context conditions the effect of EU preferences on defection (Hypothesis 4). Defection and abstention are thus modelled as a function of individual-level explanatory variables, country-level variables, a cross-level interaction and a country-level disturbance term.
Results
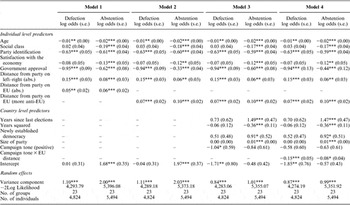
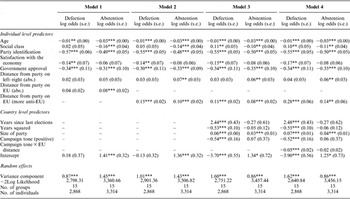
In Table 1 (2004) and Table 2 (1999), we estimate four models: a model with only individual level predictors (absolute distances from party); a second model with individual-level predictors and directional distances; a third model with both individual-level and country-level predictors; and finally, a full model with a cross-level interaction. For both years, we estimate eight random effects binary logistic regression models, predicting both defection and abstention for respondents who said they voted for a governing party in the last national election.
A Multilevel Model of Defection and Abstention at the 2004 European Parliament Elections

Source: 2004 European Election Study. ***p < 0.01; **p < 0.05; *p < 0.1.
A Multilevel Model of Defection and Abstention at the 1999 European Parliament Elections

Source: 1999 European Election Study. ***p < 0.01; **p < 0.05; *p < 0.1.
In Model 1, we test the proposition that the greater the absolute distance on the EU dimension between the voter and her party, the higher the likelihood of defection and abstention. In support of the hypothesis, the results show that distance on the EU dimension has a statistically significant effect on the likelihood of defecting and abstaining in both 1999 and 2004. We also find that the ‘second-order’ variables are highly significant. In line with the spatial theories of voting, we find that greater distances on the left–right dimension lead to higher levels of defection and abstention, especially in 2004. And more consistently, in both 1999 and 2004, people who disapprove of the government are more likely to defect and abstain, as are weaker partisans. Older people are also less likely to abstain or defect compared with younger people, and social class affects abstention rates.
In the theoretical section, we hypothesized that anti-European sentiment would be more likely to result in defection than would pro-European sentiment. Hence, in Model 2, we have replaced the absolute distances from the party position by a distance variable for only those voters who are more Eurosceptic than their party. As expected, we find that these variables have a palpably stronger effect on defection than the absolute distances estimated in Model 1. Voters who are more Eurosceptic than the party they voted for at the previous national election are more likely to desert that party at an EP election. Moreover, these effects are far from trivial. Figure 3 shows the predicted probability from Model 2 of being a defector or abstainer by distance from the party on EU integration, holding the other independent variables constant (assuming the voter is 40 years old, middle-class, not a party identifier, does not approve of the government, holds the same position as his party on the left–right dimension and thinks the economy has got neither better nor worse). As the graph shows, the probability of abstention in both 1999 and 2004 is increased by around 20 percentage points as voters move away from the party. We see a similar pattern for defection; although the effects are clearly somewhat stronger in 1999 than in 2004. In 1999, we predict that slightly less than 35 per cent of voters who match their party’s view on EU integration will defect, whereas almost 60 per cent of those 7 points away will defect.Footnote 45 The effect is somewhat smaller in 2004, though still highly statistically significant.

It is interesting to note that we find no statistical relationship between voters’ distance from their governing party on the European integration dimension and defection in 2004 when we analyse only the three countries where there is no opposition party more Eurosceptic than the governing parties (Austria, Italy and Portugal). In 1999, by contrast, where the governing parties were significantly more pro-European than both the average governing party voter (see Figure 2) and the opposition parties, we find a more sizeable and significant effect of EU distance on the likelihood of defection in each of these countries. This supports the argument that attitudes on European integration bring about defection mainly when there is a noticeable gap between voters and governing parties, whereas concerns about the European Union are less decisive when the distance between voters and governing parties is small and when there are no available alternatives (i.e. more Eurosceptic parties).
The Model 3 results also add credence to our claim that Europe is important under certain circumstances, this time through campaign coverage. In support of our third hypothesis, we find a very substantive and highly statistically significant effect of the campaign tone on the likelihood of defection: when the European Union is portrayed negatively in the media, voters are more likely to defect and vice versa. Given the mixed evidence in the literature of the effect of negative campaigning on turnout, the lack of statistically significant effects on abstention results are perhaps not surprising. Figure 4 shows the predicted probabilities of defection in different campaign environments.Footnote 46 Campaign tone only varies between −1.1 and +2 in 1999 and −1 to +0.5 in 2004, and we therefore only report the effects of campaign tone between these points. It is clear from Figure 4 that campaign tone has a substantial impact on the likelihood of defection. In 2004, our ‘typical’ voter experiencing the most negative EU campaign context has a greater than 50 per cent likelihood of defecting compared with less than a 20 per cent probability in campaigns with the most positive EU coverage. In 1999, the distinction is even starker with comparable probabilities of 73 and 34 per cent.

The aggregate level controls in Model 3 also mainly perform as expected. The timing of the election seems important, with the highest defection rates predicted when EP elections are held during the mid-term period. These timing variables are, however, not robustly significant across both defection and abstention and both years. Also in line with the second order theory, the results show that larger parties are more likely to be punished in EP elections than smaller governing parties. This effect is significant for both defection and abstention in 1999, but only for abstention in 2004. Finally, as expected, the coefficients for ‘newly established democracy’ are positive in Table 1, which suggests that voters are more likely to defect or abstain in the post-communist countries; however, only the effect on abstention is statistically significant.
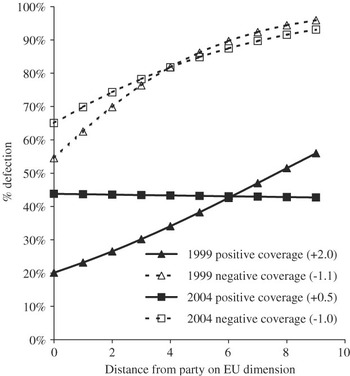
More importantly, we also hypothesized that the campaign context has a conditioning effect on the impact of EU preferences on voting behaviour. To test this proposition we have included a cross-level interaction between campaign tone and EU preferences in Model 4. As expected, the interaction term coefficient is negative across all models, suggesting that voters are less likely to defect, and indeed abstain in 2004, over Europe in EU-positive campaign environments. Figure 5 demonstrates the effect of distance from party on the EU dimension on defecting across different campaign contexts. The predicted probabilities have been calculated as in Figure 4, and show variation in the effect of EU distance in the most ‘negative’ and ‘positive’ campaign contexts in 1999 and 2004.Footnote 47

We can see that the main effects of campaign context are clearly still important, but, interestingly for pro-European campaign contexts, there is little impact of distance from one’s party on the issue of integration, indeed there is no impact in 2004. By contrast, in a Eurosceptic campaign context these differences appear to be activated, and we see extremely high rates of defection for voters who are far from their party on the issue of EU integration in both 1999 and 2004.
Conclusion
This article began by questioning why governing parties lose votes at EP elections. The evidence presented here suggests that governing parties may lose votes because of the disconnect between major governing parties and their voters on the issue of EU integration, and the fact that EP elections make this issue, and therefore this disconnect, more prominent. On both the contextual and individual levels, it appears that Europe can matter when voters go to the polls. Governing-party voters who are more sceptical about further integration are more likely to defect or abstain in EP elections. Our findings do not repudiate the idea that EP elections can be seen as second-order elections where domestic concerns are important; they simply suggest that voters’ decisions in EP elections are not only a referendum on the domestic performance of incumbent parties, but are also a referendum on the issue of European integration. Moreover, the evidence in this article suggests that campaign context makes a real difference to the behaviour of individuals. We show that the media coverage of the European Union during the campaign influences levels of defection as well as the reasons why people defect. A benign media environment towards the European Union reduces defection rates and makes people less likely to defect due to the gap between their party and themselves on European issues. More hostile coverage, by contrast, results in greater defection from governing, normally pro-European, parties and increases the importance of the party–voter distance on integration in causing defection.
These results thus cast some doubt on the argument that there is an unbridgeable democratic gap in the European Union because voters only use EP elections as a referendum on domestic political concerns. Purely second-order elections are often seen as jeopardizing the link between citizen preferences and representative institutions, since such institutions presuppose that the political choices of voters are based on political preferences that are relevant to the decision-making arena concerned. Our results show that voters do not always discount the European arena when making choices at EP elections. Moreover, whereas previous studies have portrayed EP election campaigns as low-key and domestically focused affairs, our results indicate that campaign coverage may play a key role in shaping vote choices. This paints a distinctly different picture of elections to the European Parliament, and supports the suggestion that the European Union is becoming a more salient issue to many voters.
Nonetheless, we should also be cautious in interpreting these results as sounding the death knell for the second-order election theory as applied to EP elections. In particular, recent research has shown that European issues have become a factor determining vote choice in some national elections. It may therefore be argued that the European Union as an issue now matters more in EP elections, but only because it has become more important in the domestic political arena. In this sense, EP elections are still acting as a referendum on domestic policy – it is simply that the domestic policy at stake is national relations with the European Union. We would, however, argue that if one of the key determinants of vote choice in EP elections is European integration, this is clearly a different kind of second-order election to one in which the competence of the incumbent is being judged. These findings also raise the question of whether there is indeed an upward trend in the importance of European issues at both national and European elections. If this is happening then we might expect the gap between the positions of governing parties and voters on European integration to become smaller over time, as parties adopt positions closer to voters to avoid electoral punishment. Of course, such questions can only be answered by studies of future elections.
Appendices
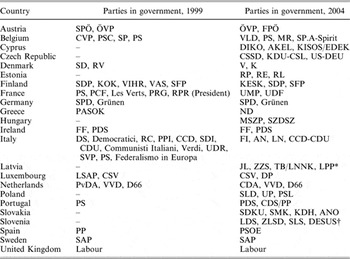
Parties in Government, 1999 and 2004

*In March 2004, the Latvian government was reshuffled following party switching of several MPs (see Jānis Ikstens, ‘Latvia’, European Journal of Political Research, 44 (2005), 1107–85). At the time of the EP election in June 2004, the parties in the governing coalition were the ZZS, LPP and TP. However, in coding governing party voters in Latvia, we used the government which was based on the 2002 election (JL, ZZS, TB/LNNK, LPP). As we were interested in how voters changed their preferences from the national to the European election, it made sense to use the results from the last election.
†In April 2004, the three SLS ministers resigned and were replaced with LDS ministers (see Danica Fink-Hafner, ‘Slovenia’, European Journal of Political Research, 44 (2005), 1179–87). In coding governing party voters in Slovenia, we used the government that included all four parties for the same reason discussed above.
Defecting in the 2004 European Parliament Election

Source: 2004 European Election Study. Only those respondents who voted for the governing party in the last national legislative elections are included.
Defecting in the 1999 European Parliament Election

Source: 1999 European Election Study. Only those respondents who voted for the governing party in the last national legislative elections are included.
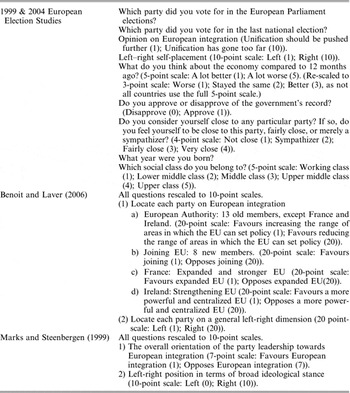
Data and Questions

Sources: Kenneth Benoit and Michael Laver, Party Policy in Modern Democracies (London: Routledge, 2006); Gary Marks and Marco Steenbergen, 1999 Expert Survey on National Parties on National Parties and the European Union (Center for European Studies, University of North Carolina, 2002).