Articles in The China Quarterly have made important contributions to understanding the rapid international expansion of Chinese multinational enterprises (MNE).Footnote 1 However, the majority of research on Chinese MNEs can now be found in business and management journals. In a recent literature review in a leading management journal, for example, over a hundred such peer-reviewed journal papers were identified.Footnote 2 A key question found in this literature relates to whether conventional models of the MNE, which are based predominantly on the Western development experience, are helpful and relevant for understanding Chinese MNEs.Footnote 3 As a result, a large body of empirical work has sprung up exploring the motivations for Chinese MNE activity using outward foreign direct investment (OFDI) data, with many studies employing statistical methods using large datasets of officially reported OFDI.Footnote 4 However, making effective use of Chinese OFDI data is far from straightforward, as it is prone to significant geographical, industrial composition and volume biases. These biases are primarily caused by Chinese MNEs establishing offshore holding companies in tax havens and offshore financial centres (hereafter THOFCs).Footnote 5
Offshore jurisdictions, of course, are central to the operation of most MNEs today, as the recent high profile media cases of Starbucks and Google illustrate. Yet, Chinese MNEs appear to have a particularly high propensity to use THOFCs owing to a number of historical factors.Footnote 6 For example, Chinese enterprise income tax law favoured foreign MNEs for many years by granting them lower rates of corporation tax. This created powerful incentives for domestic businesses to move themselves offshore and “round-trip” capital back to China, thereby transforming themselves into foreign-invested MNEs eligible to benefit from the lower tax rates.Footnote 7 Limited access to domestic capital markets, moreover, has spurred private sector businesses to find alternatives, sometimes via the use of offshore financing channels.Footnote 8 Hong Kong, along with other havens closely linked to it, in particular the British Virgin Islands (hereafter BVI) and Cayman Islands (CI), all of which are historically linked as belonging to the former British Empire, has provided a very convenient conduit for offshore financing.Footnote 9 In order to circumvent domestic interference and restrictions on their OFDI projects, some Chinese businesses have routed FDI to and via offshore vehicles.Footnote 10 These factors have all driven Chinese businesses to set up offshore companies, meaning that Chinese FDI has had an unusually large bias towards THOFCs, and Hong Kong, the BVI and CI in particular. Indeed, by 2010 over 60 per cent of Chinese FDI stock was channelled to THOFCs, compared to an average of around 25 per cent for developed market economies.Footnote 11
The main purpose of this article is to explore further how Chinese MNEs use THOFCs and why this has created geographical, industrial composition and volume biases in Chinese FDI data. We also consider the implications for existing empirical research on Chinese MNE activity. We show how and why the overwhelming majority of studies in the business and management literature that use Chinese OFDI data suffer from serious methodological shortcomings. The use of THOFCs to incorporate offshore companies creates serious distortions to all Chinese outward FDI data, making it very difficult to track and properly understand Chinese MNE activity. This article therefore serves as a timely reminder to all those who use Chinese OFDI data to explore Chinese MNE activity that the data cannot always be taken at face value.Footnote 12
We start by explaining how investments in offshore companies constitute FDI and the research questions this raises in light of existing empirical studies on Chinese MNEs. We then explain our method for exploring the use of THOFCs by Chinese MNEs. Following this, we outline and discuss our results, based on a sample of 100 Chinese MNEs, and explore the implications for geographical, industrial composition and volume biases. Our conclusion argues that most of the current empirical research on Chinese MNEs, particularly in the business and management fields, is seriously compromised as a result of the common use of THOFCs by Chinese MNEs to engage in FDI. Some alternative approaches are outlined.
Tax Havens, Special Purpose Entities (SPEs) and the Problem of Measuring MNE Activity
MNEs often diversify their investments geographically through various organizational structures, including what are referred to as “offshore special purpose entities” (usually abbreviated to SPE).Footnote 13 Although there is no single, universal definition for SPEs, they do share a number of common features. They are legal entities that “have little or no employment, or operations, or physical presence in the jurisdiction in which they are created by their parent enterprises. These are typically located in other jurisdictions, such as tax havens and/or offshore financial centres.”Footnote 14 SPEs are often used as devices to raise capital or to hold assets and liabilities, and usually do not undertake significant production. According to the most recent OECD benchmark definition of FDI, the “core business of SPEs is to channel funds between entities outside the country where they are established ... The role of these SPEs is merely to serve as a financial turn table for enterprises in other countries” (emphasis added).Footnote 15 Compilers of FDI data, moreover, argue that SPEs “hardly affect domestic economic activity and do not reflect genuine investment activities in or of the reporting country itself” (emphasis added).Footnote 16 Accordingly, the question for those involved in tracking foreign investment is: “how to ensure that the geographical and industrial allocation of such investment is not distorted.”Footnote 17
Elsewhere, the idea of a distinction between genuine and non-genuine FDI has also been discussed, in particular with reference to the biases inherent in FDI data as a measure of MNE affiliate activity.Footnote 18 Investment-holding companies, financing subsidiaries, conduits, shell companies, shelf companies and brass-plate companies are all examples of SPEs. The currently employed OECD guidelines, outlined in the third edition of the Benchmark Definition of FDI (1996) (revised, although not yet implemented, in the fourth edition), state that investments in SPEs, even though they engage in little physical production, should be incorporated in FDI data.Footnote 19 This inclusion stems from an earlier recommendation by the IMF in its Balance of Payments Manual, which has been followed since the early 1990s:
Whatever the structure (e.g., holding company, base company, regional headquarters) or purpose (e.g., administration, management of foreign exchange risk, facilitation of financing of investments), SPEs are an integral part of the structure of the direct investment network as are, for the most part, SPE transactions with other members of the group.Footnote 20
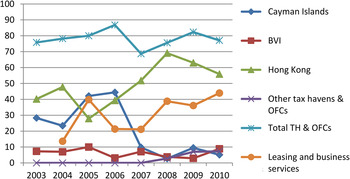
As noted, the use of SPEs by MNEs is common and the biases for FDI data also significant.Footnote 21 In this regard, Chinese businesses have followed similar if not even more extreme paths in their use of havens. Since 2002, China's Ministry of Commerce (MOFCOM) has compiled China's FDI statistics in accordance with the OECD/IMF's balance-of-payment guidelines.Footnote 22 THOFCs have also consistently figured prominently as major recipients of China's officially compiled outward FDI, implying that there is FDI associated with the transfer of assets and equity from mainland PRC businesses to SPEs in these jurisdictions. The triad of three former British colonies and crown dependencies – Hong Kong, the BVI and CI – particularly stand out (see Figure 1). Chinese MNEs, as we later show, frequently incorporate at least one SPE within each of these three jurisdictions, forming a geographically diversified investment triad holding company structure.
Geographical and Industrial Composition of China's Outward FDI Flows (as % of China's Total), 2003–2010

It is important to note that the biases are caused by both direct FDI transfers to these offshore SPEs to facilitate “round-tripping” as well as the less frequently discussed, though equally serious, problem of “onward-journeying.”Footnote 23 Round-tripping involves moving capital offshore to a SPE only to bring it back onshore again, so inflating outward (and inward) FDI data. Laws offering foreign businesses lower rates of tax, as noted, encouraged Chinese businesses to use offshore companies to round-trip over many years. Onward-journeying, in contrast, involves establishing an offshore SPE and using this vehicle to conduct further FDI in third countries. The initial investment to the offshore SPE is mistakenly recorded as genuine value-adding activity (particularly in the case of FDI to Hong Kong). Investments made via SPEs to third countries, by contrast, are not recorded at all in official Chinese OFDI data (following current OECD guidelines). Rather, these are recorded as OFDI from the THOFC in which the SPE is formed. Nonetheless, these onward-journey investments are also very significant in terms of their volume and cannot be overlooked.Footnote 24
The use of SPEs creates genuine problems in using FDI data to measure MNE activity, both in terms of identifying the ultimate geographical destination of FDI as well as its targeted industrial sector (i.e. manufacturing, natural resources, services and so on): “where funds are simply channelled through holding companies, major problems are created concerning the geographical and industrial composition of FDI.”Footnote 25 Geographical composition biases are created in two ways: (a) initial FDI to an offshore SPE host (i.e. typically in Hong Kong, the BVI or CI in the Chinese case) is incorporated in aggregate FDI data, following OECD/IMF guidelines;Footnote 26 and (b), further FDI is directed via an offshore SPE to another country, the ultimate recipient of FDI (i.e. “onward-journey” as opposed to “round-trip” FDI).
The initial FDI to an offshore SPE will lead to an overestimation of genuine FDI (i.e. that associated with productive, value-adding MNE activities). However, once these offshore vehicles are established, onward-journey FDI will not be recorded in the official FDI data of the ultimate source country (i.e. China), but rather the immediate source (i.e. typically among the triad THOFCs).Footnote 27 This leads to underestimations of FDI to ultimate final destinations. These two counteracting forces lead to volume biases, the size of which depends upon the relative volumes of (a) and (b).
How big are these biases? As regards (a), the overwhelming importance of recorded FDI to the triad of THOFCs (i.e. Hong Kong, the CI and BVI) (see Figure 1) in official Chinese MOFCOM OFDI data points to its significant scale. Between 2003 and 2010, for example, on average around 80 per cent of officially recorded FDI flows were destined for the triad THOFCs alone.Footnote 28 Clearly, if such FDI is disregarded, the actual growth of Chinese OFDI looks far less impressive. As regards (b), there are as yet no accurate estimates, although as our sample will later show, these flows are certainly large enough to require incorporating in all serious studies on Chinese MNE activity.
As well as volume biases, the use of these SPEs in THOFCs also creates industrial composition biases. Commonly used SPEs, particularly among Chinese MNEs, are investment-holding companies (i.e. SPEs that hold investments in other corporations). Investment-holding companies are considered as financial corporations and therefore are classified as providing business services, despite the fact that they may own businesses in different industries, such as manufacturing or mining.Footnote 29 It is also not uncommon for investment-holding companies (and more generally all types of SPEs) to be registered as simultaneously providing a variety of other business services. This may include consulting, management services, marketing, holding of brand names/patents, trading and so on. Sometimes, companies may be established under the sole banner of providing services but are in reality SPEs. The addition of service functions to SPEs facilitates MNE tax minimization. Offshore SPEs of this type can legally charge service fees to affiliated companies. In doing so, profits can be moved to more favourable tax locations.Footnote 30
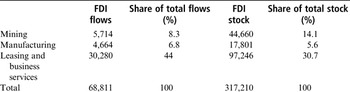
Official Chinese aggregate OFDI data therefore also reflect the common use of service companies, which corresponds to the unusually large industrial biases noted. By far the largest single recipient of Chinese OFDI, for example, is the “leasing and business services” sector. In 2010, this service category received over US$30 billion of outward FDI flows.Footnote 31 To put this in perspective, the flow of FDI to services stood at well over double the combined flows to mining and manufacturing (see Table 1). This unusual decomposition of China's OFDI by industry has been picked up by some recent academic work as it does not correspond to areas of business in which China is renowned as having comparative advantages.Footnote 32 As yet, however, no persuasive explanation has been forthcoming for the apparent anomaly. We will later show that these aggregate OFDI data capture the large industrial composition biases that are created by the use of SPEs.
Distribution of China's Outward FDI Flows and Stock by Industry, 2010 (US$ millions)

Source:
MOFCOM 2011.
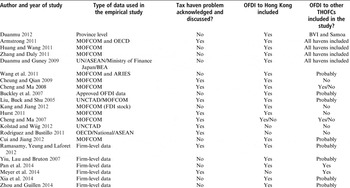
Given these potential issues with geographical, industrial composition and volume biases, care must be taken when using both aggregate and firm-level FDI data as an indicator of the genuine FDI activities of MNEs.Footnote 33 It seems that China's MOFCOM data (shown in Figure 1), currently one of the most popular sources for statistical studies on Chinese OFDI, are not a promising source for investigating Chinese MNE activity. Despite this, to date, many empirical studies in business and management journals test the country location determinants of Chinese OFDI using the aggregated official OFDI data (Table 3). Surprisingly, around half of these studies also incorrectly include OFDI to THOFCs, including the Hong Kong, the BVI and CI triad, in their statistical analyses. Moreover, the vast majority of the aforementioned studies do not address the SPE issue. Huang and Wang, for example, include tax havens (such as the Bahamas and Luxembourg).Footnote 34 Jingling Duanmu, using a provincial-level data source, also includes a number of offshore subsidiaries (i.e. BVI, Samoa and Liechtenstein),Footnote 35 as do Duanmu and Guney, and Zhang and Daly.Footnote 36 Shiro Armstrong, an exception, acknowledges the SPE problem but simply ignores the biases introduced “as there are no more reliable sources.”Footnote 37 The rest, with few exceptions, include Chinese OFDI to Hong Kong but exclude other THOFCs (Table 3). This also is highly problematic, as Hong Kong is a major offshore financial centre (OFC) and tax haven and an important location for Chinese SPE creation (discussed below, also see Table 2). The few statistical studies that use data collected at the firm-level, moreover, also make no attempt to distinguish between what could be an SPE and what could be a foreign subsidiary engaged in value-adding activities (i.e. manufacturing, sales, trading and so on, see Table 3). As we will show, many Chinese MNEs go to some length to disguise the real reasons for SPE creation. The use of SPEs in THOFCs, therefore, also affects most studies that use hand-gathered firm-level FDI data, as well as those cross-country studies that use official national-level OFDI data.
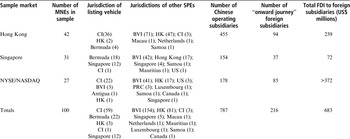
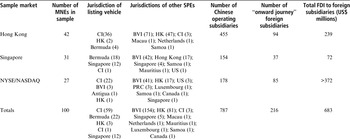
The Geographical Distribution of Offshore Investment-Holding Companies in the Sample of 100 MNEs
Source:
As reported in most recent company annual reports (either 2010 or 2011) downloaded from respective stock exchange websites.
Examples of Research that Incorrectly Uses Official FDI and Firm-Level FDI Data Sources to Explore Chinese MNE Activity

Sources:
See column 1.
The frequent inclusion of THOFCs, particularly the BVI, CI and Hong Kong triad, as OFDI destinations in the empirical literature (see Table 2 and Figure 1) raises the question of the extent to which Chinese MNEs establish SPEs in these jurisdictions and undertake FDI to, and subsequently from, them. At present, the aggregate official FDI data undoubtedly point to the use of triad SPEs, but there is no systematic firm-level evidence mapping such FDI. Furthermore, the onward-journey component of Chinese OFDI (i.e. that undertaken via SPEs) is also entirely overlooked in the empirical literature, even in the minority of studies which correctly identify geographical biases.Footnote 38 Yet, this type of FDI may be of significant volume and also be systematically different to other Chinese OFDI not routed via THOFCs. If so, even the findings of these more careful studies also need to be treated with caution. The following specific questions therefore emerge with respect to the three biases introduced by offshore investments:
-
1. Geographical composition biases:
-
a. Do Chinese MNEs typically establish SPEs in the triad THOFCs?
-
b. Is there evidence that FDI from China to SPEs incorporated in this triad takes place?
-
-
2. Industrial composition biases:
-
Are these SPEs classified as providing “business services” creating industrial composition biases?
-
-
3. FDI volume biases:
-
a. Is there firm-level evidence to suggest that Chinese businesses engage in further onward-journey FDI via these offshore holding companies?
-
b. If so, how extensive is it?
-
Methods for Exploring the Use of THOFCs by Chinese MNEs
Owing to the secrecy THOFCs offer, a key challenge is identifying, at the firm-level, ways in which SPEs are used by Chinese MNEs. Unsurprisingly, research in this area across most academic disciplines remains limited. One of the few useful prisms through which to gain an idea of how they are used, however, is by looking at the way in which publicly listed Chinese companies on foreign stock exchanges use SPEs. Depending upon the market, many listed companies are actually required by law to publish details of their corporate structures, including the type of offshore holding company structures they use.
A large number of Chinese businesses are now listed outside of China – for example, there are over 550 in Hong Kong alone.Footnote 39 To make our data collection manageable and as we are interested in the three areas of bias that SPEs create, we are selective. We focus only on a sub-sample of offshore-listed Chinese companies that have already been identified as undertaking “onward-journey” FDI (i.e. have invested FDI via their offshore SPEs to third countries, establishing other foreign subsidiaries, excluding investments to other SPEs).Footnote 40 This is to ensure that they are engaged in genuine FDI activity, according to OECD (1996) criteria, such as manufacturing, research and development, or raw material extraction, outside of China. For example, Mindray Medical International (MMI) is a leading developer, manufacturer and marketer of medical devices worldwide headquartered in Shenzhen. It has rapidly developed an international presence via its worldwide aftersales service and has over 20 genuine (i.e. not investment-holding) subsidiaries around the world (including in Italy, Sweden, the Netherlands, Germany, Canada, Russia, Brazil, Mexico, Columbia, Spain, Vietnam, Malaysia, Egypt, Thailand, India, Indonesia, the UK and France). It also completed a large (US$209 million) acquisition of a US company, Datascope, in May 2008. MMI's two major shareholders and founders are Xu Hang 徐航 (28.6 per cent of votes held) and Li Xiting 李西廷 (30.7 per cent), marking it out as a highly entrepreneurial private sector Chinese MNE which owns its foreign subsidiaries via offshore investment-holding companies.Footnote 41
As we are particularly interested in how Chinese MNEs structure OFDI via tax havens (and the volume biases this creates), we focus here only on those MNEs, like MMI, that own their foreign subsidiaries via offshore SPEs. Furthermore, we only look at “onward-journey” investments for MNEs with listed subsidiaries on the stock exchanges of Hong Kong (42), Singapore (31) and NYSE/NASDAQ (27). This leaves exactly 100 Chinese MNEs meeting our sample criterion (Table 2). Identifying SPEs in THOFCs, even from annual reports, is not always straightforward, as many MNEs wish to disguise their offshore activities (a BVI incorporated company, for example, may be officially recorded as a “sales” subsidiary when in reality it has no actual employees in the BVI and is in fact used for tax-related purposesFootnote 42 ). Using our sample of MNEs, we focus only on identifying and recording one specific type of SPE. We concentrate on the number and jurisdiction of those companies recorded in annual reports as “investment-holding company” SPEs (which helps to address our first research question). Columns 3 and 4 in Table 2 present aggregate information on the jurisdiction of incorporation of these SPEs, all found in recognized THOFCs, and of the listing vehicle. Focusing only on investment-holding companies likely underestimates the true number of SPEs in our sample. This is because, in some cases, as the OECD warns: “companies that appear to be merchandising, insurance or other financial or shipping companies are really SPEs.”Footnote 43 Once identified, we also look for evidence that initial FDI from China to these SPEs actually takes place (research question 1b.). To do this, we use annual reports and also, when necessary, initial public offering (IPO) prospectuses, which generally outline such structures for the benefit of prospective investors. To address the related question of industrial composition biases, we also note examples of the additional types of services provided by these SPEs, when applicable, as recorded in their own financial statements. These data are derived primarily from the notes associated with consolidated financial statements in annual reports.
Two questions concerning our sample arise. First, do unlisted companies also use offshore SPEs in a similar way to our publicly listed sample firms? In other words, is the use of SPEs by our sample firms at all representative of other non-publicly listed Chinese MNEs? Extensive qualitative research conducted in private Chinese MNEs also reports the common use of SPEs by these businesses in the havens of Hong Kong, BVI and the CI.Footnote 44 We consider it likely, therefore, that our sample is typical of other unlisted Chinese MNEs. Even if it is not, the volume, industrial composition and geographical biases illustrated by our sample firms are in and of themselves large enough to distort official Chinese OFDI data significantly, as we will show.
Second, is the use of SPEs in our onward-journey sample representative of other Chinese companies listed outside of China? It is relatively straightforward to compare our sample to other publicly listed Chinese companies that do not onward-journey, and we find that it is indeed also very common for these businesses to use SPEs in the triad jurisdictions. Our sample is therefore typical of hundreds of other Chinese businesses that list on foreign stock exchanges, as well as being representative of a much larger population of both listed and unlisted Chinese businesses that use offshore SPEs to structure both international and domestic investments. We now elaborate on our findings regarding geographical, industrial composition and volume biases, discussing their implications in light of current research on Chinese MNEs.
Geographical Composition Biases
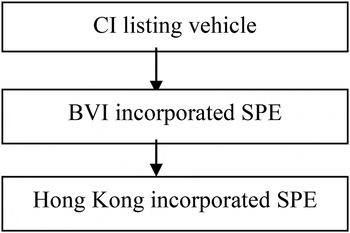
Our 100 MNEs extensively use offshore SPEs in the triad THOFCs (Table 2). They have been actively involved in undertaking FDI to these offshore SPEs, as well as using them to structure onward-journey FDI. The BVI were the most commonly used jurisdiction (with 154 SPEs, averaging 1.5 per MNE in the sample), followed by Hong Kong (81) and the CI (59). The number of triad-based SPEs therefore stood at 301, far outnumbering those in all the other THOFCs (i.e. Bermuda, Samoa, etc., which totalled less than 50). Moreover, many of our sample firms simultaneously held at least one SPE in each of the triad jurisdictions (Figure 2). Of the 42 Hong Kong-listed companies, 23 had at least one Cayman Islands SPE (usually the listing vehicle), one British Virgin Islands SPE and one Hong Kong-incorporated SPE. The Cayman Islands, it should be noted, are particularly popular as a listing vehicle jurisdiction. This is because they were, until very recently, the only THOFC with agreements with both the United States and Hong Kong stock exchanges that allowed businesses incorporated in their jurisdiction to list on either market, so maximizing potential listing values (recently the BVI have also attained this status). In the United States sample, 11 of the 23 companies also had a triad structure. For the Singapore-listed companies, 11 had the dual BVI and Hong Kong holding company structure beneath the listing vehicle, in this case usually incorporated in Bermuda or Singapore. From our sample of 100 onward-journey MNEs, 34 contained the triad holding company structure, including at least one SPE in Hong Kong, the BVI and CI (Figure 2).
A Typical Triad SPE Structure

This holding company structure helps to explain both the large geographical and industrial composition biases evident in MOFCOM's official Chinese OFDI data (see Figure 1). By looking at our sample firms, we can see that Chinese OFDI to SPEs does indeed take place. We also know that asset injections of onshore PRC businesses into offshore SPEs constitutes official Chinese OFDI as companies like MMI, described above, must seek official approval from the State Administration of Foreign Exchange (SAFE) for such transactions. On 21 October 2005, SAFE issued its important “Notice on Issues Related to the Administration of Foreign Exchange in Fundraising and Round-Trip Investment Activities of Domestic Residents Conducted via Offshore Special Purpose Companies” (commonly known as “Circular 75”). Effective from 1 November 2005, it superseded all previous rulings and was one of the first major attempts to clamp down on the use of THOFCs by Chinese businesses. Circular 75 states that:
PRC residents, which include both legal and natural persons, must register with the relevant SAFE branches with respect to their overseas investments in offshore companies if they use assets or equity interests in their PRC entities as capital contributions to establish offshore companies or inject assets or equity interests of their PRC entities into offshore companies to raise capital overseas.Footnote 45
The injection of onshore assets, including equity transfers to offshore SPEs in reverse investments, following OECD/IMF guidelines, constitutes outward FDI.Footnote 46 As it is retrospective, Circular 75 means that all Chinese businesses listed outside the PRC prior to October 2005, including those in our sample, must refer to the potential impacts of Circular 75 on their businesses in their annual reports and/or IPO prospectuses. All of our sample firms have done so owing to legal requirements. This indicates their universal and significant involvement in such OFDI activity. As noted, MMI is a typical example. MMI is a CI incorporated listing vehicle. It owns four further SPEs, including two in the BVI and two in Hong Kong. According to its annual report:
To enable us to raise equity capital from investors outside of China, we set up a holding company structure by establishing our current holding company, Mindray International [CI], on June 10, 2005 … Mindray International became our holding company in September 2005 when the majority of our existing shareholders transferred, through a series of linked transactions, approximately 91.1% of the equity of Shenzhen Mindray to Mindray International. In April 2006 we acquired approximately 8.9% of the equity in Shenzhen Mindray with the result that our holding company owns approximately 99.9% of the equity of Shenzhen Mindray. In May 2006, we changed our name to Mindray Medical International Limited.Footnote 47
MMI illustrates how OFDI to the CI, one of the important triad THOFCs, may take place. Other examples illustrate how such asset injections and equity transfers to Hong Kong and the BVI also take place.
Another typical case taken from our sample which illustrates how FDI is directed to a holding company based in Hong Kong is China Mingfa, a large Chinese commercial, residential and hotel property developer listed in Hong Kong. According to its IPO prospectus, in 2006 China Mingfa injected the assets of its seven PRC subsidiaries, valued at 134.6 million yuan, into a Hong Kong incorporated investment-holding company.Footnote 48
China Sunergy, a final example, is a producer of solar panels and modules based in Nanjing, with 2,870 employees. Its major shareholder and founder is a Chinese entrepreneur, Lu Tingxiu 陆廷秀, who owns 28.9 per cent of its shares. It is one of the earliest solar cell manufacturers in China, dating back to 2004, and now has joint ventures in Turkey and sales offices in Mumbai, Tokyo, Germany, France and Italy.Footnote 49 However, technically it is like our other examples: a foreign invested company. An investment-holding company was incorporated in the Cayman Islands prior to its IPO on NASDAQ in 2007 (see below). Its initial equity transfer from China was to a BVI incorporated investment-holding SPE:
Our operating subsidiary, Sunergy Nanjing, was incorporated in August 2004 in Nanjing, China. China Sunergy Co., Ltd., or Sunergy BVI, our holding company incorporated in the British Virgin Islands, acquired all of the equity interests in Sunergy Nanjing in April 2006 through a series of transactions that we have accounted for as a legal reorganization. As part of a restructuring in anticipation of our initial public offering, we incorporated China Sunergy Co., Ltd., or Sunergy, in the CI on August 4, 2006. Sunergy became our ultimate holding company upon its issuance of shares to the existing shareholders of Sunergy BVI on August 30, 2006 in exchange for all shares of equivalent classes that these shareholders previously held in Sunergy BVI. In December 2007, Sunergy BVI incorporated China Sunergy (Hong Kong) Co., Limited., or Sunergy Hong Kong, in Hong Kong. During the same month, Sunergy BVI transferred all of the equity interests in Sunergy Nanjing to Sunergy Hong Kong, which became the direct holding company of Sunergy Nanjing. We conduct substantially all of our operations through Sunergy Nanjing.Footnote 50
China Sunergy illustrates again the typical triad structure often used by Chinese MNEs. These three examples illustrate how SPEs in the triad of Hong Kong, the BVI and the CI are used to receive Chinese OFDI and also hold and invest in other foreign subsidiaries. This in turn leads to the large geographical biases in official Chinese FDI data illustrated in Figure 1.
Implications of geographical biases
Our sample of Chinese MNEs shows that FDI to SPEs in the triad THOFCs is common. The fact that the geographical biases in Chinese FDI data caused by the use of offshore companies are not more widely recognized and addressed is surprising. More than two decades ago, Cantwell warned that, because of this problem, “The significance of offshore banking centres as sources and recipients of FDI tends to be overstated.”Footnote 51 For example, while official MOFCOM data suggest that as much as 60 per cent of Chinese OFDI goes to Hong Kong, Dussel Peters shows using commercial mergers and acquisitions databases that the real value of Chinese OFDI to Hong Kong may be less than half of this (around 27 per cent between 2000 and 2011).Footnote 52 As noted, however, of all the statistical studies currently exploring Chinese OFDI strategies, nearly one-third incorrectly include FDI directed to the triad THOFCs. This leads to some questionable results relating to the inclusion of these small island economies, which typically have high quality domestic institutional environments, low tax rates, but a lack of natural resources. Duanmu, a case in point, mistakenly includes THOFCs (including the BVI) in her econometric analysis of the determinants of Chinese FDI.Footnote 53 One of her noticeable results, contrary to the findings of other studies that do not include THOFCs, is that natural resources are not a significant attractor of Chinese OFDI and that there is even a “surprising negative sign” (i.e. investments are attracted to non-resource rich jurisdictions, such as THOFCs).Footnote 54 Other such examples include Huang and Wang's finding that overall market size is not a statistically significant predictor of Chinese FDI (THOFCs are typically small markets).Footnote 55 Armstrong also finds that “quality of institutions and governance” have a bearing on FDI performance (THOFCs have good institutions).Footnote 56 All of these findings may be an artefact of the inclusion of THOFCs in the empirical analysis, as these well-managed but resource-poor small island economies will bias the empirical results in these directions.
While the majority of studies do actually acknowledge and discuss the THOFC problem and the biases they may create (Table 3, column 3), many still incorrectly include Hong Kong as a host country in their statistical modelling (Table 3, column 4). However, as the China Mingfa example illustrates, it is common for Chinese MNEs to direct FDI to SPEs incorporated in Hong Kong. In fact, there are 81 Hong Kong incorporated SPEs in our sample of 100 MNEs (Table 2). It is clearly incorrect to include all FDI to Hong Kong, as reported in official statistics, as genuine FDI (i.e. non SPE-related). OFDI to Hong Kong, of course, provides a major dilemma for empirical studies of this nature. Hong Kong seems too large a recipient of Chinese FDI to be ignored entirely – it accounted for around 60 per cent of all Chinese OFDI stock by 2010 (see also Figure 1). Some FDI to Hong Kong must also clearly be related to productive, value-adding MNE activities (i.e. for the purposes of seeking new markets, efficiency and so on). At the same time, however, it is also a major offshore financial centre and, as shown, many Chinese companies establish SPEs in Hong Kong (Table 2). As illustrated in the China Sunergy case, Hong Kong-based SPEs are also tightly integrated in the triad structure with BVI and CI incorporated SPEs. Such a structure facilitates the transfer of capital between these offshore SPEs (interestingly, a major destination of Hong Kong's officially recorded OFDI is the BVI).Footnote 57 Excluding FDI to the CI and BVI but incorporating FDI to Hong Kong, as many studies do, therefore makes little logical sense (see Table 3).
Buckley et al., for example, is one of the earliest and most widely referenced (over 900 Google Scholar citations at last count) empirical papers to include OFDI to Hong Kong.Footnote 58 They look at the period from 1984 to 2001 and test some of the “general principles of the theory of FDI.”Footnote 59 It is surprising that the SPE problem and “round-tripping,” which was significant at this time,Footnote 60 and their possible influence on the OFDI data, are not discussed. It is not clear whether any of the approved FDI projects included within the study were located in other THOFCs (i.e. the BVI, CI), as neither disaggregated nor adequate descriptive data for the actual sample are given. Many of the more recent studies also follow the precedent set by Buckley et al. of including Hong Kong as an FDI destination for Chinese MNEs (Table 3). Chengqi Wang and colleagues use more recent MOFCOM data (2006–07) and also include Hong Kong but do not discuss the treatment of FDI to THOFCs.Footnote 61 Yet, it is clear from their descriptive statistics that Hong Kong is an important host country in their sample. Cheung and Qian also empirically investigate the determinants of Chinese FDI using country-specific approved OFDI data.Footnote 62 Again, they look at the links between Chinese outward FDI and the characteristics of the host countries in order to discover potential determinants. They are aware “of the uncertainty about the quality of China's ODI data.”Footnote 63 However, discussion of the tax haven issue is still relegated to a single footnote and Hong Kong remains included in their econometric analysis while three THOFCs, Bermuda, the CI and the BVI, are explicitly excluded. A number of other papers also follow this strategy, and in so doing, fail to provide adequate justification for Hong Kong's inclusion as a host country for Chinese FDI.Footnote 64 As a result of incorporating SPE-related FDI to Hong Kong, many of these studies also find that markets with close cultural and geographic proximities and a high percentage share of ethnic Chinese among the population make attractive hosts for Chinese MNEs and their FDI.Footnote 65 Again, these findings are likely to be a direct consequence of the erroneous inclusion of SPE-related FDI, which inflates the importance of Hong Kong in these empirical analyses.Footnote 66
The minority of studies that use firm-level data may potentially be able to disentangle SPE-related OFDI by excluding investments in and from SPEs in THOFCs in their analysis. However, even in these studies there is inadequate recognition of the problem of geographical composition biases. In particular, FDI to Hong Kong is accepted as genuine value-adding activity. Yiu, Lau and Bruton, for example, do not specify in the sample of Chinese MNEs they use whether SPEs are included as subsidiaries or not, and do not even discuss this important issue.Footnote 67 While Ramasamy, Yeung and Laforet do briefly note that there may be an issue with FDI to THOFCs, it is also not at all clear whether or not the data issues this creates are properly dealt with or that they fully understand them.Footnote 68 They claim that their method allows them to “avoid the tax haven problem that has plagued other similar studies.”Footnote 69 Yet, in constructing their specifically designed dependent variable of Chinese FDI (using company annual reports), they clearly state that they include “any overseas investment.”Footnote 70 Investment-holding companies in Hong Kong (or elsewhere) fall into this category, as well as SPEs dressed up as “service” companies or other businesses. Furthermore, Hong Kong must have been one of the host countries included in their count data, as they note that the 59 countries they include accounted for 80 per cent of total outward investment in the 2006–08 period (as reported by MOFCOM). Such a high proportion would not be possible if Hong Kong were excluded.Footnote 71 Finally, some other firm-level studies do correctly exclude investments to the triad THOFCs but then mistakenly go on to include investments to other popular destinations for SPEs. Klaus E. Meyer et al., for example, correctly exclude the triad THOFCs but incorrectly include all investments to the Netherlands and Singapore.Footnote 72 As Table 2 shows, SPEs are sometimes also created in these destinations. If these firm-level studies are to disentangle and separate SPE from non-SPE related investments successfully, then considerably greater care is required.
In general, even empirical studies that hand collect firm-level data do not adequately address the intractable problem of how to distinguish between genuine and SPE-related FDI (see the bottom of Table 3 for some examples of firm-level studies). How do these studies deal with FDI associated with groups like Longcheer, a very successful, privately owned, mobile handset designer found in our sample that has a Hong Kong subsidiary registered as being involved in both “investment holding” as well as “manufacturing”?Footnote 73 At present, these vital data issues are entirely ignored in all but a handful of empirical studies using FDI data.Footnote 74
Industrial Composition Biases: Results and Discussion
The use of SPEs and other subsidiaries in THOFCs, as noted, also creates problems for the measurement of the industrial composition of FDI. Our sample illustrates at least three reasons why this is so. First, our sample of 100 MNEs has 346 registered SPEs (including listing vehicles) (Table 2). While owning operational businesses across a wide range of sectors, investment-holding companies technically deliver “business services” and are classified as such for the purposes of registering FDI data.Footnote 75 Second, matters are further confused by the recording of more than one activity in such SPEs (i.e. the aforementioned Longcheer). As well as “investment holding” services, for example, a wide variety of other activities are also recorded as simultaneously being provided in these SPEs. The provision of consulting, marketing and management services, and the holding of brands or patents that can be leased back to mainland subsidiaries, for example, are all commonly recorded in offshore SPEs. Extrawell Pharmaceutical (incorporated in the CI, listed in Hong Kong) develops, manufactures and sells pharmaceutical products, including the commercial exploitation of genome-related technology and oral insulin products (416 employees). Two professors from Fudan University founded and own 42 per cent of the company. It has subsidiaries in the BVI holding “gene invention rights.”Footnote 76 Guangzhou-based Bawang Group (incorporated in the CI, listed in Hong Kong in 2007) designs, manufactures, trades and distributes Chinese herbal products (3,390 employees). Bawang reports a Hong Kong subsidiary involved in “investment holding” as well as “trading of household and personal care products.”Footnote 77 Similarly, China Agrotech (incorporated in the CI and listed in Hong Kong) manufactures and trades fertilizers, pesticides and other agricultural products (1,000 employees). It has an investment-holding SPE in Hong Kong which also engages in “general trading and export.”Footnote 78 As in the Longcheer example, the use of offshore companies serving multiple functions, although usually with strong biases towards services, makes it very difficult to know exactly how such MNE subsidiaries should be treated. Are they actually involved in any real business activities, be it service related or otherwise, or are they simply SPE shell companies created for other reasons, like avoiding tax and circumventing restrictive domestic regulations?
Third, there are examples of offshore subsidiaries in the triad, particularly in the BVI, which are not recorded as being investment-holding SPEs, but most likely are. This raises the question of whether these investments are genuine FDI projects or not. China Qinfa, a large coal producer and trading group, has two subsidiaries in the BVI registered as providing “sales and logistics services.”Footnote 79 Extrawell Pharmaceutical also has a BVI subsidiary which holds its “gene invention rights” and provides “marketing and distribution” services. Extrawell also has Hong Kong subsidiaries involved in the “provision of agency services.”Footnote 80 Bawang has a BVI subsidiary that is registered as providing “marketing and promotion services,” but not as investment holding.Footnote 81 It is not at all clear how these types of offshore subsidiaries should be dealt with, as to all intents and purposes they are likely to be SPEs. This is particularly problematic for the very large number of “trading,” “sales” and “service” related companies established as subsidiaries in Hong Kong in our sample. They may well be SPEs established for the purposes of minimizing tax. All of these issues create very serious difficulties for the aforementioned firm-level studies (see Table 3), as well as official data collection. Empirical studies cannot rely upon such FDI data.
Implications of industrial composition biases
One of the clearest manifestations of the problems SPEs create can be found in the area of industrial composition biases. By 2010, 30.7 per cent of China's total OFDI stock, and by far China's largest OFDI category, was in “leasing and business services.” By contrast, only 19.7 per cent was found in the combined total of the “mining” and “manufacturing” industrial categories (Table 1).Footnote 82 We contend that a significant portion of official MOFCOM data captures the service activities of investment-holding companies in the triad and their frequently accompanying other business service functions, as well as the leasing back of brands, patents and trademarks.
There are other ways of illustrating how SPEs create these industrial composition biases (i.e. towards services). Some studies (although to date still a minority) rely upon commercial mergers and acquitions databases (for example, Dealogic, SDC Thomson Financial, FT FDI Intelligence Database), as opposed to MOFCOM or firm-level data.Footnote 83 Unlike in the official recording of FDI data, these commercial databases do account for the use of offshore SPEs by MNEs, as they are only interested in ultimate beneficial owners and the final target jurisdictions. They do not, therefore, suffer from the same problems as officially recorded FDI data. As a result, we would expect a far lower volume of FDI to the business services categories using these data. Our own estimates using the Thomson ONE mergers and acquisitions database (which excludes greenfield FDI) shows that for all completed FDI deals up until the end of June 2012, only 78 out of a total of 1,548 took place in the “business services” standard industrial classification codes, which constitutes 5 per cent of the total number of transactions and less than 1 per cent by value. Other studies using commercial databases make similar findings, illustrating the lower share of FDI to business services when calculated in this way. Schuler-Zhou and Schuller, for example, show that mergers and acquisitions were heavily concentrated in mining (65 per cent of the total volume of deal activity) and manufacturing (25 per cent) for the period 2003–06 under comparison.Footnote 84 Services, in contrast to the official MOFCOM data, accounted for less than 2 per cent of the volume of deal value and roughly the same in number.Footnote 85 Similarly, Sun et al. for the period 2000–08 show that energy minerals/mining, oil and gas exploration were by far the largest target industries (with over 46 per cent of total deal volume); business services, by contrast, were negligible.Footnote 86 Dussel Peters, using a similar approach, also shows that business services are lower when measured using commercial databases.Footnote 87 All of this evidence stands in stark contrast to the official MOFCOM data (see Table 1) which show an overwhelming and incongruous predominance in business services and leasing.
The high volumes of FDI to the leasing and business services industrial categories are not explained at all well in most current studies (Table 3). Statistical studies in the business and management literature do not seem to realize the significant industrial composition biases created by SPEs. As such, they tend to take the MOFCOM data at face value, despite the incongruously high volumes of service-related FDI. Huang and Wang, for example, note the extremely high share of services and conclude that: “most surprising was the distribution of Chinese ODI between manufacturing and service industries. The manufacturing sector accounted for an extremely low share, only 4.72 of the total.”Footnote 88 Similarly, Liu, Buck and Shu also note that “trade and services dominate the picture” of Chinese OFDI.Footnote 89 Cheung and Qian remark: “Two observations stand out: the growth of the trade and trade services sector and the fading importance of the manufacturing sector.”Footnote 90 Even Kolstad and Wiig, who are generally far more careful with their use of OFDI data than others, do not relate the high level of business services to the industrial composition biases created by SPEs in THOFCs.Footnote 91 Instead, in commenting on the unusually high levels (54 per cent of all flows for their period, larger than any other category), they suggest it is “likely that service industry investments gravitate more towards developed countries,” without explaining why. It is far more likely that the high preponderance of offshore SPEs registered as providing business services is driving these industrial composition biases.Footnote 92 In contrast to geographical biases, these industrial composition biases have so far received no proper recognition, which illustrates how little the academics in the business and management fields currently understand about the recording of Chinese (and other) OFDI data.
Systematic Volume Biases in Chinese FDI Measurement
The related geographical and industrial composition biases inevitably also lead to large volume biases in official FDI data. The 100 MNEs in our sample by definition have all created offshore SPEs (346 in total, Table 2), with a preference for the triad THOFCs. They refer in annual reports (and IPO prospectuses) to the ways in which they have injected mainland Chinese assets into these SPEs and in so doing have directed FDI from China to these offshore companies. Owing to legal requirements, all of these sample MNEs comment on the impact of Circular 75 in their annual reports, necessarily implying that they have undertaken FDI to their SPEs. Estimating the actual volume of such OFDI, however, is unfortunately not possible. This is because only in some instances are actual values given (for example, China Mingfa). Consequently, there are huge problems in trying to ascertain the correct volume of Chinese OFDI that is related to SPEs and that which is related to productive, value-adding MNE activity. To date, very few studies acknowledge and discuss these issues.
Our sample of 100 Chinese MNEs was also specifically selected on the basis that each MNE had also engaged in “onward-journey” FDI activity (i.e. FDI in foreign countries directed via a THOFC to an entity other than an investment-holding company). Further analysis of this sample reveals the often conservative nature of their outward investment strategies, as well as the heavy involvement of private sector entrepreneurs in these MNEs. China Sunergy, for example, started its international expansion with a number of modest sales-related subsidiaries in Europe and Hong Kong.Footnote 93 China Qinfa owns four coal mines in Shanxi province (1,745 employees). It is one of the leading non-state owned coal companies and is also engaged in transportation, sales and shipping. It is owned and controlled by a Chinese entrepreneur (Xu Jihua 徐吉华, with 57.8 per cent of its shares). Its foreign subsidiaries are mainly in Hong Kong and are involved in sales and trading.Footnote 94 China Agrotech, which is majority owned by its two founders, has a general trading company based in Hong Kong.Footnote 95 Bawang Group, the privately owned herbal products manufacturer, sells its products internationally (i.e. Hong Kong, Macau, Singapore, Thailand, Myanmar, Malaysia, Brunei and Australia) and has foreign subsidiaries in Hong Kong which are involved in advertising and trading.Footnote 96 Extrawell Pharamaceutical has foreign subsidiaries in Hong Kong (involved in the development and commercialization of insulin products), and a marketing and distribution subsidiary in Malaysia.Footnote 97 Finally, Longcheer, founded in 2002 in Shanghai by three young Chinese entrepreneurs, who remain the major shareholders, is one of the largest Chinese mobile handset designers in China (which is the largest mobile telephone market in the world, with around 700 million users). The company has 1,200 employees and has been among the fastest growing companies in China. Longcheer also has overseas subsidiaries in Hong Kong, Singapore, Japan, India and Vietnam.Footnote 98
These cases illustrate first that onward-journey FDI is strongly associated with private sector Chinese MNEs, many of which have made considerable efforts to circumvent domestic restrictions and raise foreign capital.Footnote 99 As such, the exclusion of the FDI from THOFCs when using official data is likely to systematically exclude private sector MNE activity. Any conclusions reached when using such data for empirical analysis are therefore biased. Second, qualitative evaluation of the FDI in these cases also suggests that it tends to be rather modest and risk averse in nature. The 100 MNEs in our sample have made onward-journey type investments (i.e. via THOFCs) in a wide range of business areas that span many countries, including: the US (36), Russia (2), Australia (3), Uruguay (1), Hong Kong (76), Singapore (18), Taiwan (2), Italy (7), Turkey (1), Brazil (1), Germany (13), Macau (3), Vietnam (2), South Korea (4), Japan (13), Thailand (1), Malaysia (4), Papua New Guinea, India (1), Macau, France, Netherlands (1) and Canada (3). Further careful analysis of the sample firms shows that they created 216 foreign MNE subsidiaries with investments of at least US$683 million (Table 2). The vast majority of these investments, however, were sales, trading and marketing-related investments, with only a very small minority involving larger, cross-border mergers and acquisitions. This finding contradicts claims made in much of the business and management literature that Chinese MNEs exhibit aggressive, high risk, strategic asset-seeking behaviour, involving large acquisitions in developed markets that target technologies, brands and management know-how.Footnote 100
Implications of volume biases
Reporting only immediate destination flows will almost certainly lead to positive volume biases for THOFCs and negative biases for non-THOFCs, as FDI routed via offshore jurisdictions is currently missed. Furthermore, volume biases seem to be present in every econometric study on Chinese MNEs published to date. Of the studies reviewed in Table 3, only three seem to have correctly identified the geographical composition biases created by using Chinese FDI data.Footnote 101 They all still go on to model Chinese OFDI statistically – two of them use the same official data sources. Kolstad and Wiig note the inherent secrecy of THOFCs and argue that the “nature and ultimate destinations of FDI flows are difficult to discern … For this reason, these flows likely reflect motives different from other FDI flows.”Footnote 102 Their solution is simply to exclude OFDI to all THOFCs in their econometric modelling. Similarly, Cheng and Ma also acknowledge that Hong Kong should be excluded: “Since FDI that goes into ‘tax havens’ and ‘offshore financial centers’ will typically be invested elsewhere, they are not the ultimate destination of the FDI.”Footnote 103 While it is an improvement on previous approaches, excluding THOFC FDI still does not adequately incorporate onward-journeying FDI routed via SPEs. As our sample shows, this is of significant volume, exceeding $500 million for our 100 MNEs alone (Table 2). So this approach is, in fact, no solution at all. Moreover, as onward-journey FDI appears to differ systematically from officially registered FDI in so far as it is more strongly driven by the private sector and does not typically have a strategic asset-seeking focus, its omission is likely to bias the results towards the finding that strategic asset-seeking is taking place.Footnote 104
Conclusion
Our contribution here is to show how Chinese MNEs often incorporate investment-holding companies in specific THOFCs, typically involving the triad jurisdictions of Hong Kong, the CI and BVI. We have shown how they not only direct FDI to these jurisdictions from China, but also that they route significant volumes of further FDI from these offshore locations to other countries. Drawing from a sample of 100 MNEs that have all used THOFCs in these ways, we demonstrate how geographic, industrial composition and volume biases are created in Chinese OFDI data as a result. We also have shown how these biases give rise to misleading results in much of the empirical literature that looks to explain Chinese MNE activity. While there are now over a hundred articles in the business and management fields exploring Chinese MNE activity, with many studies using econometric methods applied to officially published OFDI or firm-level data, the vast majority do not properly account for the ways in which Chinese MNEs route investments to and via offshore holding companies. As a result, a large number of empirical studies have been incorrectly accepted as rigorous scientific contributions to the understanding of Chinese MNE activity.
Future research should make greater efforts to account for the specific historical context in which China's MNEs have emerged and the idiosyncratic investment patterns these conditions have fostered. It could build upon the approach used here as well as those being developed elsewhere.Footnote 105 For example, larger samples of Chinese MNEs that have invested FDI via THOFCs should be analysed. This could be done by broadening the search among publicly listed companies. Owing to their greater levels of transparency, such companies provide a window of opportunity to examine the use of THOFCs further. Greater use and analysis of commercial databases that track ultimate ownership will also potentially provide further important insights into the extent and nature of Chinese FDI that is routed via THOFCs. As well as this, it may also be possible to undertake more fine-grained, firm-level qualitative research to ascertain the extent and nature of THOFC use. Using these approaches, it will be possible to make more detailed comparisons between onward-journey FDI routed via THOFCs and that undertaken directly from China. By doing so, further light will be shed upon the nature of existing geographical, industrial composition and volume biases, and a firmer basis from which to understand Chinese MNE activity can be developed.