The Voting Rights Act (VRA) is one of the most important—if not the most important—public policies developed over the last half century to increase access to the U.S. political system for people of color. The VRA also provides an important context for understanding the ascension of nonwhite groups into the elected leadership of the nation (Browning, Marshall, and Tabb 1984; Davidson and Grofman 1994; Menifield 2001; McClain and Stewart 2002; Segura and Bowler 2005; Bositis 2006). This essay assesses the present-day significance of the VRA for the political representation of communities of color by examining the implications of majority-minority districts and other key provisions in the VRA for the election of nonwhite officials in the beginning years of the twenty-first century.
A Brief History of the VRA
The VRA, as first passed in 1965, applied specifically to African Americans because of the long history of racial discrimination that was acknowledged by the U.S. Congress. Jurisdictions that met certain criteria, based on the proportion of the population registered to vote and on evidence of barriers to registration and voting, were designated “covered jurisdictions”; if they met the terms specified by Section 4 of the VRA, these jurisdictions were consequently subject to federal intervention and oversight in their electoral process. Section 2 is a key permanent provision that prohibits the use of any voting procedure or practice that may result in a denial or abridgement of the right to vote on account of race or color. Section 5 (the preclearance provision), a temporary provision that requires covered jurisdictions to obtain prior approval from federal authorities for any proposed changes in their voting laws or procedures, has been renewed three times by Congress, in 1970, 1975, and in 1982 when the Act was extended for 25 years until August 2007. In July 2006, the Congress renewed this provision a fourth time and extended it for 25 more years, until 2031, in the “Fannie Lou Hamer, Rosa Parks, and Coretta Scott King Voting Rights Act Reauthorization and Amendments Act of 2006” (H.R. 9). A recent report from the National Commission on the Voting Rights Act (2006) maintains that Section 5 has been effective not only in intercepting but in deterring numerous changes intended to abridge minorities' rights to political participation and representation.
In 1975, the Mexican American Legal Defense and Education Fund and other Latino organizations lobbied the Justice Department, the Leadership Conference on Civil Rights, and other organizations in the civil rights coalition to support the extension and expansion of the VRA. They succeeded in bringing all Latinos who were monolingual in Spanish under coverage, based on their status as language minorities (Pinderhughes 1995). The minority language provisions—Sections 203 (for written languages) and 4(f)4 (for unwritten or oral language)—precipitated coverage for American Indians, Asian Americans, Alaskan Natives, and Latinos and were renewed in 1982 for 10 years and in 1992 for 15 years. Pushed by Asian American and other civil rights organizations, the effort not only extended Section 203 to 2007, but expanded bilingual voting assistance to jurisdictions with 10,000 or more single-language minorities in the population (National Asian Pacific American Legal Consortium 1997). In 2006, Sections 203 and 4(f)4 were also extended, the former for 25 years.
Minority vote dilution, recognized as a constraint on the abilities of racial minorities to elect representatives of their own, was addressed and acknowledged in the 1982 amendment. The Supreme Court set criteria for implementation of protections against minority vote dilution in Thornburg v. Gingles, permitting the creation of so-called majority-minority districts in 1986. By 1990, the confluence of racially segregated housing patterns, the rapid rise of the nonwhite population due to international migration, the constitutional recognition of majority-minority districts, and the new capacity of civil rights litigators to use computer software to design districts led to the creation of a significant number of new electoral districts in the U.S. House of Representatives and in state and local legislative bodies (Parker 1990; Swain 1995; Lublin 1997; Grofman 1998; Canon 1999; Tate 2003). While this concept began to be challenged in Shaw v. Reno, involving a 1992 North Carolina redistricting case, the creation of majority-minority districts set the stage for a substantial expansion in the numbers of Black and Latino elected officials in the early 1990s. A preliminary look into the nation's nonwhite elected officials in recent decades suggests that the trend of growth has slowed but continued, especially at the local level and among women (Hardy-Fanta et al. 2005, forthcoming; Bositis 2006; Smooth 2006).
Data and Method
To assess the continuing significance of the VRA protections for the election of nonwhite officials, we begin with an examination of the current status of descriptive racial representation by legislative district at both congressional and state levels, followed by an analysis of its relationship to provisions in the VRA. We then provide analysis of the numbers of Asian, Black, and Latino elected officials in selected local offices nationwide using demographic data collected at the county level for those counties whose geographic boundaries coincide with those defined for VRA covered jurisdictions.
Key data used in this research are from the national database the authors created as part of the Gender and Multi-Cultural Leadership (GMCL) Project.1
The authors would like to acknowledge the generous support for this project provided by the Ford Foundation. For a more complete description of the entire project, which includes a national survey of elected officials of color by race/ethnicity and gender, see Hardy-Fanta et al. (2005, forthcoming).
The database includes elected officials who fall into the following office levels: congressional, statewide, state legislative, county, municipal, and school board. It does not include judicial or law enforcement positions, party officials, or miscellaneous officials elected to boards and commissions such as water, utility, and transportation. Data for American Indian elected officials are available only at the state legislative and congressional levels.
District information for the 109th Congress comes from the U.S. Census 2000.3
This data source (“Profiles of General Demographic Characteristics: U.S., Regions, Division, Metropolitan Areas, American Indian Areas/Alaska Native Areas/Hawaiian Home Lands, States, Congressional Districts”) is preferred over other Census products, for it provides district racial information that includes persons who may report more than one race and is considered a more complete count.
We would like to thank Daniel Levitas of the ACLU Voting Rights Project in Atlanta, Georgia for his generosity in providing us access to these databases.
Given our interest in descriptive racial representation, we include in our analysis the racial breakdown for each state legislative district, using demographic information for all ages (not just 18 and over)5
This decision was prompted by the concern that reappointment is based on the total population counts, not just the voting-age population.
Information used is in the Quick Tables of the American Fact Finder web site: http://factfinder.census.gov. Unfortunately, not all states participate in Phase 2 of the Census redistricting data program, and several states have districts that are numbered in ways different from the scheme used by the Census. We were able to compensate for some of the missing data by contacting state data centers but not all the attempts were successful and not all the data found were comparable. For example, we were able to find information for California, Texas, and Florida, but each of these states used a different system of reporting district racial information. We used the best estimates to make the information comparable and were forced to use the state average in the case of Hawaii.
The exception is for the Latino figures, which are not affected by the different means of racial counting because the Census treats this population as an ethnic group whose members may have one or more racial origin(s).
Information for local-level officials is taken from the GMCL database that includes nonwhites holding elective office as of January 2004. The racial and other demographic characteristics of the county population are taken from the Census 2000 State and County web site.8
This information is available from the Quick Facts web site: http://quickfacts.census.gov/qfd/.
VRA and Racial Representation in the House of Representatives
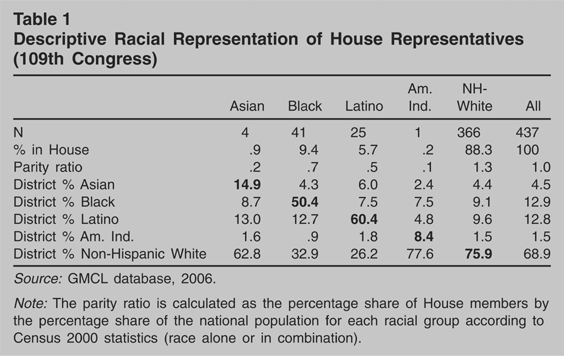
Despite the continuing increase of nonwhite elected officials in recent decades, nonwhites are still severely underrepresented in Congress. Although nonwhites were 31% of the national population in 2000, they were less than 12% of the House members. As shown in the top three rows of Table 1, there are a total of 71 nonwhite House members in the 109th Congress; 20, or 28%, of them are women. African Americans lead the way with 41 members, followed by Latinos with 25 members. There are also four Asian Americans and one American Indian member. The racial parity ratios in the House (calculated as the percentage share of the legislative body divided by the percentage share of the national population for each racial group) show that Whites received the highest ratio of descriptive racial representation and are the only group overrepresented, at 1.3 times their proportion in the population, followed by Blacks at 0.7, and then in descending order by Latinos at 0.5, Asians at 0.2, and American Indians at 0.1.
Descriptive Racial Representation of House Representatives (109th Congress)

Looking at the racial composition of each congressional district in the 109th Congress, Table 1 shows some evidence of the effects of the creation of majority-minority districts: Black members' districts average 50.4% Black and Latino members' districts average 60.4% Latino. Among Black representatives, the percent that their districts are Black ranges from 25% (MO-5, Emanuel Cleaver) to 66% (IL-1, Bobby Rush). Further analysis reveals that, whereas close to two-thirds (63%) of Black congress members were elected from majority-Black districts, close to nine out of 10 (88%) of them were elected from majority-minority districts. Among Latino representatives, the percent that their districts are Latino ranges from 22% (CO-3, John Salazar) to 78% (TX-16, Silvestre Reyes). Eight in 10 Latino congress members were elected from majority-Latino districts and all but one of the Latino congress members were elected from majority-minority districts.
Neither Asian nor American Indian House members were elected from districts in which the majority of the population is of their race.9
This is a change from the past when Congresswoman Patsy Mink represented Hawaii (1965–1977 and 1990–2002).
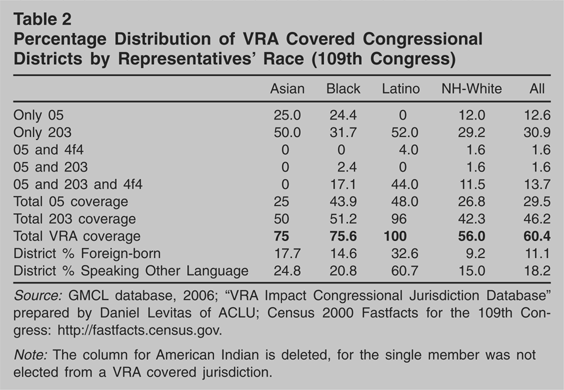
Table 2 examines the relationship between VRA statutes and House member districts. It shows that the vast majority of nonwhite House members were elected from districts covered by the VRA. In fact, every single Latino member in the House was elected from a congressional district covered by the VRA, particularly under Section 203. Furthermore, a higher share of Latino than Black representatives was elected from districts with Section 5 coverage. Although a very small number, an equal proportion of Asian officials were elected from covered districts. Significantly, up to 60% of all congressional districts nationwide and 56% of those districts represented by White members were also covered by VRA statutes. An important reason for the ubiquitous role of Section 203 for Latino representatives may be the relatively high percentage of the foreign-born in households in those districts that speak more than the English language at home. Up to one-third of the district populations represented by Latinos was foreign-born and six out of 10 persons in those districts spoke a language other than English at home.
Percentage Distribution of VRA Covered Congressional Districts by Representatives' Race (109th Congress)

VRA and Racial Representation in State Legislatures
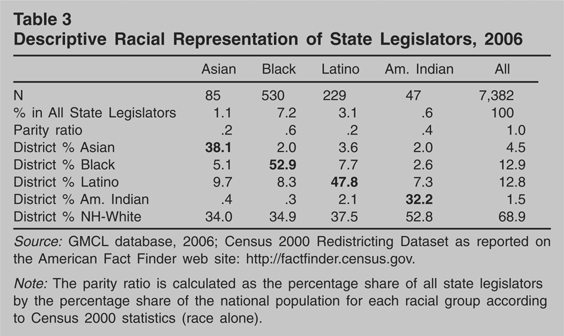
In January 2006, there were 891 nonwhite members among the 7,382 in the nation's state legislatures (Table 3); 303 or 34% of them were women. Blacks make up the largest group both in their number (530) and in the percent female (37%). Latinos follow with 229 members and 31% female. There were also 85 Asian Americans, 31% female; and 47 American Indians, 21% female. In terms of gender, nonwhite state legislators are distinctive from their White counterparts; Black, Latino, and Asian women's percentages within their respective racial/ethnic group are higher than that of non-Hispanic White women, who make up just 21.3% of White state legislators.10
For a more thorough discussion of the interaction between race and gender in descriptive representation, see Hardy-Fanta et al. (2005).
Descriptive Racial Representation of State Legislators, 2006

Similar to the situation in Congress, minorities are also severely underrepresented in the nation's state legislatures, as nonwhites represent only 12% of all state legislators. The racial parity ratios in the nation's state legislators as a whole show that Whites receive the same level of descriptive overrepresentation as in Congress, at 1.3, followed by a sharp drop in the parity ratio among Blacks (0.6). However, American Indians receive a higher level of descriptive racial representation at the state legislative level (0.4) than Latinos or Asians, both of whom receive a poor 0.2 score. The relative concentration of American Indians at the state legislative district level, compared to the congressional district level, may account for their better showing in terms of parity ratios. Table 3 also shows that the average percentage of American Indians in American Indian legislators' districts is 32%, as compared to 8% at the congressional level. By the same token, the lower proportion of Latinos at the state level appears to be influenced by their weaker concentration ratios. The average percentage of Latinos in Latino state legislators' districts is 48%, as compared to 60% in congressional districts.
Nevertheless, the greater degree of racial concentration at the state legislative district level does not explain the continuing lack of descriptive representation for Asians and Blacks. The average percentage of Asians in Asian legislators' districts is 38%, substantially greater than the 15% in congressional districts. The average percentage of Blacks in Black legislators' districts is 53%, modestly larger than the 50% figure at the congressional level. In contrast to their situation in Congress, and to that of other groups, we find that only Black legislators are elected mostly from districts in which the majority of the population is of the same race. Among other factors, the lower degree of VRA coverage at the state legislative level for Asians and Latinos may help explain the representation deficit for these two groups.
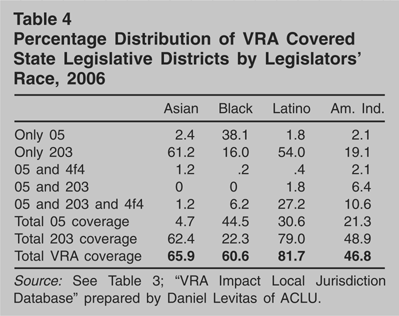
Table 4 examines the relationship between VRA statutes and state legislative districts. It shows that the vast majority of Asian (66%), Black (61%), and Latino (82%) state legislators were elected from districts covered by the VRA. Close to half of American Indian state legislators also came from such districts. The overall percentages of VRA coverage for each district represented by nonwhites are lower in state legislatures than in Congress, except for American Indians. For Asians the drop is 9%, for Blacks, 15%, and for Latinos, 18%. Still, over eight in 10 Latino legislators were elected from state districts covered by the VRA, nearly all under Section 203. Also, a much higher share of Asian, Latino, and American Indian state legislators than Blacks was elected from districts with Section 203 coverage. Among Blacks, the percentage of Section 5 coverage is twice as large as that of Section 203 and there is little overlap in terms of covered jurisdictions by the two provisions. No data are available on the proportion of the foreign-born and on non-English usage at the state district level. However, we suspect a mechanism similar to that which explains the disparate reliance of nonwhites on various VRA provisions in congressional districts may also be at work to explain the observed state-level patterns.
Percentage Distribution of VRA Covered State Legislative Districts by Legislators' Race, 2006

VRA and Racial Representation in Local Elective Offices
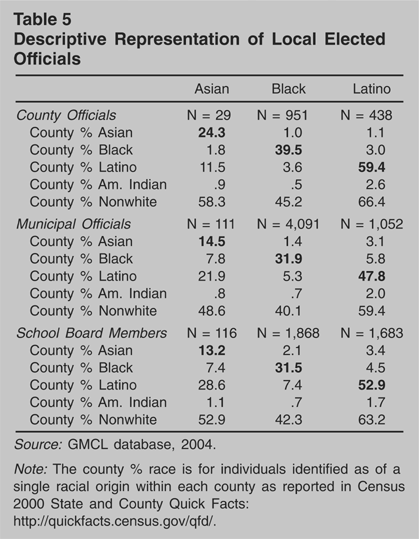
Local elective positions constitute the lion's share of the nation's nonwhite elected officials. According to the GMCL 2004 database, county, municipal (mayors and city/town councilors, selectmen, or aldermen), and school board officials make up 67% of Asian, 79% of Black, and 82% of Latino elected officials.
To assess the relationship between VRA coverage and racial representation at the local level, we link county-level demographics from the 2000 Census to each of the Asian, African, and Latino elected officials in the database by the county in which his or her office is located.11
The GMCL database does not contain American Indian elected officials below the state level. See Hardy-Fanta et al. (2005) for a fuller report of the findings.
Descriptive Representation of Local Elected Officials

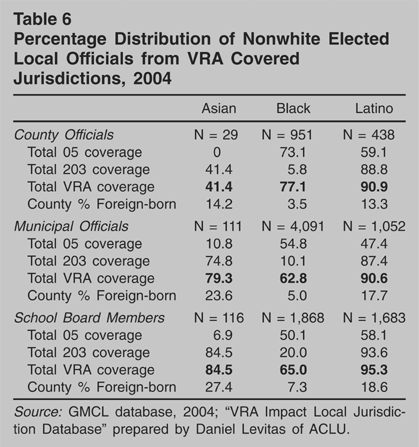
Last but not least, we look at the relationship between VRA coverage and the election of nonwhite officials at the local level. Table 6 shows that, except for Asians at the county level, the preponderance of the nation's nonwhite officials in 2004 were elected from counties (or the equivalent jurisdictions) that were protected by the VRA statutes. As is the case for state legislative district levels, this table reveals the critical importance of Section 203 for the election of Asian and Latino local officials and the much more important role of Section 5 than Section 203 for the election of Black local officials. We also observe that local officials of Asian descent tend to be elected from counties that had a higher share of the foreign-born population than those that elected Latinos and/or Blacks.
Percentage Distribution of Nonwhite Elected Local Officials from VRA Covered Jurisdictions, 2004

Conclusion
This research documents a substantial relationship between the VRA and the election of nonwhite officials at the national, state, and local levels. However, we also observe significant racial differences in the patterns of the relationship. We find greater VRA coverage at the congressional than at the state legislative level. Eighty percent of Latino and 66% of Black members of the U.S. Housewere elected from majority-Latino districts and majority-Black districts, respectively; such is not the case with the two other nonwhite groups. Among state legislators, Blacks were the only group to be largely elected from their own respective majority-ethnic district. Regardless of the level of office, we find that the vast majority of nonwhite elected officials were elected from jurisdictions covered by the VRA, especially Section 203. However, we also find very interesting patterns that challenge conventional wisdom—such as that, in addition to the close relationship between majority-minority districts and the election of Latinos and Blacks into Congress, there is a high correlation between the creation of majority-White districts and the election of Whites into the House of Representatives. Voting Rights litigators, particularly the late Frank Parker of the Lawyers' Committee for Civil Rights Under Law, invented the concept of majority-minority districts because of the post-1965 efforts by the Mississippi legislature to limit Black congressional representation even in some of the heaviest areas of African American residence in the country (Parker 1990). Also, although Blacks were much more likely to be elected from jurisdictions under the coverage of Section 5 rather than Section 203, this was true only at the state and local levels. We found that a greater share of Black House members were elected from districts with Section 203 coverage, and that Latinos were elected from congressional districts with the highest share of Section 5 coverage. Finally, we find that Asian local elected officials often represent jurisdictions that have a higher share of Latinos than Asians in the local population.
Despite the limited nature of our dataset for understanding the dynamics between VRA protections and the election of different groups of nonwhites into various levels of office, very interesting patterns emerge from the analysis that raise intriguing questions for further research. More importantly, we anticipate that our next stage of research, the 2006 GMCL telephone survey of nonwhite elected officials, will offer a more powerful tool to examine the substantive nature of representation. When analyzed in combination with the contextual database that we have reported, this new dataset should help us uncover the barriers and opportunities for more equitable representation between men and women across racial groups.
Author Bios
Pei-te Lien is associate professor of political science and ethnic studies at the University of Utah. Her research interests center on the intersection of race, ethnicity, gender, and nativity in political behavior. She can be reached by email at peite.lien@gmail.com.
Dianne M. Pinderhughes is professor and President's Distinguished Professor of Political Science and African Studies at the University of Notre Dame. Her areas of expertise include race, ethnicity, urban politics, and minority voting rights. She is the incoming president of the APSA, 2007–2008.
Carol Hardy-Fanta is director of the Center for Women in Politics & Public Policy, John W. McCormack Institute of Public Affairs, University of Massachusetts-Boston. She authored the widely-acclaimed Latina Politics, Latino Politics. Her email address is carol.hardy-fanta@umb.edu.
Christine M. Sierra is professor of political science at the University of New Mexico. Her primary research interest is on immigration, race, ethnicity, and Chicano/Chicana politics. She is the lead PI of the Gender and Multicultural Leadership project (www.gmcl.org).