Introduction
Despite the fact that wide areas are occupied by grassland worldwide (approx. 27% of the global land area), the crop does not receive the same attention as arable croplands (approx. 11%) (FAO 2014). Nevertheless, in the humid areas of the world, mainly situated in the northern hemisphere – Northwest and Central Europe, Northern America – and partly in the southern hemisphere in coastal Australia and New Zealand, grassland is intensively grazed, cut and fertilized by technology-assisted machinery and sensors (Schellberg and Verbruggen, Reference Schellberg and Verbruggen2014).
The interest in improving grassland management, e.g. by addressing in-field variability, is increasing. Potential applications for precision agriculture in grassland, their strengths and limitations, are described by several studies (e.g. Gianelle and Guastella, Reference Gianelle and Guastella2007; Schellberg et al., Reference Schellberg, Hill, Gerhards, Rothmund and Braun2008), but adoption in farm practice is low. Actual biomass and N-uptake of grass swards are mainly monitored by handheld devices, e.g. Grassmasters, Rising Plate Meters or spectrometers (Starks et al., Reference Starks, Zhao and Brown2008; Watanabe et al., Reference Watanabe, Sakanoue, Lee, Lim, Yoshitoshi and Kawamura2014), which require time-consuming measurements and limit the use on large farms. With the intensification of grassland areas, especially in Europe, the amounts of nutrients, e.g. nitrogen (N), being applied has been increased. As a consequence, improving the nitrogen use efficiency (NUE), aiming to increase farm profit and to avoid environmental issues, becomes a necessity. Proximal crop canopy sensors, such as Yara N-Sensor (Yara International ASA, Oslo, Norway), have been developed in the last two decades supporting tractor-based on-the-go N-recommendation, mainly in cereals, oil seed rape and maize. However, none of these optical sensors is calibrated or has recommendations for grassland so far. This study aims to evaluate the ability of the Yara N-Sensor® to estimate the actual biomass and N-uptake of grass swards during the first two cuts of the grass-growing season for several sites in Europe.
Materials and methods
Grassland sites
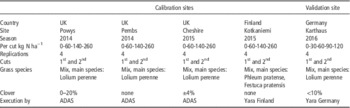
Typical intensively managed grass swards, grown under different climatic conditions on sites located in the UK and Finland, were investigated in 2014 and 2015. On each site, a randomized small plot design with increasing N rates and four replications was set-up. Additionally, a grass trial in Germany with a similar set-up was established in 2016 and used for cross-validation (Table1)
Overview and characteristics of the grassland sites

Yara N-Sensor measurements
A handheld version of the Yara N-Sensor® was used to measure the light reflection from the grass sward in the visible light and near infrared spectral regions (400–1000 nm) at a spectral resolution of 10 nm. The unit consists of two diode array spectrometers, one collecting the crop reflectance and the second spectrometer measures irradiance at the same time in order to correct the reflectance signal for changing ambient light conditions (Lammel et al., Reference Lammel, Wollring and Reusch2001). During the growing season, several sensor measurements, covering the growth periods of the 1st and 2nd cuts, were conducted. A spectral vegetation index (VI) using the ratio of near infrared (NIR) and the red-edge inflection point (REIP) was calculated (Jasper et al., Reference Jasper, Reusch and Link2009). This VI is optimized to estimate crop N-uptake and it is less affected by signal saturation in dense crops and by variety effects than widely used normalized indices combining red and NIR wavebands.
Destructive sampling and N-analysis
Immediately after the sensor scans, the measured spots were harvested by cutting the total above-ground biomass of a known area (e.g. 0.5 m²). The fresh samples were weighed in the field, dried until constant weight and analyzed for their N content using the Kjeldahl digestion method (Barker and Bryson, Reference Barker and Bryson2007). Grass dry matter and N-uptake were calculated from the data. Sensor VI readings and agronomic parameters of the 1st and 2nd cuts were related by regression analysis for calibration sites in the UK and Finland. At the end, calibration equations with the best-fit regression of dry matter biomass and N-uptake were used to estimate the same parameters from N-Sensor readings on the German validation site.
Results and discussions
Calibration on grass sites in the UK and Finland
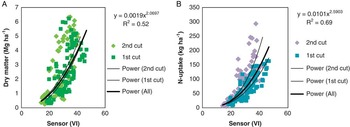
N-Sensor readings and crop agronomic parameters (Dry matter and N-uptake) from both cuts of the four grass calibration sites (Table 1) were pooled to one dataset for dry matter and another for N-uptake (Figure 1). Reliable and stable relations were found between the N-Sensor readings, dry matter biomass (R²=0.52), and N-uptake (R²=0.69) of grass swards across the studied sensor calibration sites for both cuts. Nevertheless, the relationship seems to be influenced by the cut, suggesting that a specific calibration for the 1st and 2nd cut might be required.
Sensor VI against sampled dry matter (A), and sensor VI against measured N-uptake (B) for all the calibration sites on 1st and 2nd cuts.

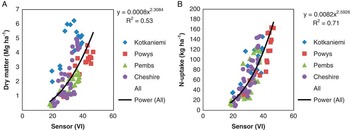
Figure 2 shows the regressions of the crop agronomic parameters with sensor VIs of the four calibration sites for the 1st cut. At the 1st cut, single observations from the Kotkaniemi site clearly reduced the accuracy in estimating dry matter, resulting in R2=0.53 (Figure 2A). On this site, using the derived average equation would lead to an underestimation of the dry matter biomass. This different behavior could be explained by the different grass species sown at the Finish site compared to the three sites in the UK (Table 1). Such a dependency on sward composition was not observed for the relationship between sensor VI and N-uptake, presumably the better suited parameter to guide variable rate N. With an R2=0.71 (Figure 2B), data from all sites equally fitted into the calculated regression.
Sensor VI against sampled dry matter (A), and sensor VI against measured N-uptake (B) for all the calibration sites on the 1st cut.

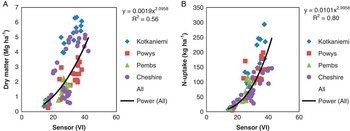
In comparison with the 1st cut, the sensor performed slightly better at the 2nd cut across all grass calibration sites, with R2=0.56 for dry matter (Figure 3A) and with R2=0.80 for N-uptake (Figure 3B). As observed at the 1st cut, the readings for dry matter are clearly scattered around the regression. In addition to the Kotkaniemi site, it seemed that the Cheshire site also contributed to the reduced accuracy in estimating dry matter based on a common regression. The change in the relationship between sensor readings and agronomic parameters between the 1st and 2nd cut might be explained by temporal changes of sward composition. Ergon et al. (Reference Ergon, Kirwan, Bleken, Skjelvag, Collins and Rognli2016) reported about changing relationships between species in pasture mixtures over time, which were affected by the cutting frequency. The relationship between N-uptake and sensor VI was slightly better for the 2nd (R2=0.80) than for the 1st cut (R2=0.71). It seems that N-uptake estimates were less affected by differences in sward composition than predictions of dry matter biomass.
Sensor VI against sampled dry matter (A), and sensor VI against measured N-uptake (B) for all the calibration sites on the 2nd cut.

Cross-validation with the grass site in Germany
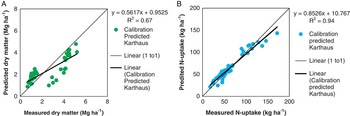
To test the calibration obtained from the four sites in 2014 and 2015, the regression equations were used to estimate dry matter biomass and N-uptake for the German site ‘Karthaus’ in 2016 (Figure 4 and 5). Figure 4 shows the results of this cross-validation for the 1st cut. The N-Sensor overestimated dry matter biomass at early measurements (intermediate harvest) and underestimated the amount of biomass at late measurements, i.e. at 1st cut (Figure 4A). In comparison to that, the sensor predicted N-uptake well, with a high accuracy (R2=0.94) and the readings were distributed along the 1:1 line (Figure 4B).
Measured dry matter against sensor predicted dry matter (A), and measured N-uptake against sensor predicted N-uptake (B) for the validation site on the 1st cut.

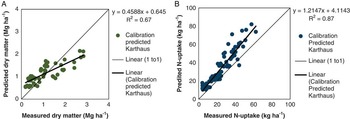
Measured dry matter against sensor predicted dry matter (A), and measured N-uptake against sensor predicted N-uptake (B) for the validation site on the 2nd cut.

The cross-validation for the second cut gave very similar results for the dry matter biomass prediction as for the first cut (Figure 5A). In the case of N-uptake (Fig. 5B), the predicted values overestimated the sampled values, with increasing deviation with increasing N uptake. This behavior can’t be explained from the available dataset and needs further investigation.
Similar to cereals, sensor readings on grass swards are a better predictor of N-uptake rather than biomass. Sensor based N-uptake estimations seem to be largely unaffected by changing combinations of biomass amounts and related dry matter and chlorophyll concentrations, whereas more accurate biomass predictions seem to require specific calibrations, e.g. taking sward composition and the phenological development stage of the predominant species into account.
Conclusions
Site-independent validation showed that the N-Sensor, when being thoroughly and cut-specific calibrated, is able to predict grass dry matter across sites with reasonable accuracy (R²=0.67 for the first and second cut). N-uptake predictions were even more accurate, showing R²=0.94 for the 1st cut and R²=0.87 for the 2nd cut. It is concluded that the technology has the potential to guide management decisions and variable rate nitrogen application on European grass swards. These findings can be used as a basis for real time N-Sensor based N topdressings in intensive grass production areas where the grass is being cut for silage or feeding in the stable.
Acknowledgements
The authors would like to express their gratitude to the colleagues from ADAS (United Kingdom), the Yara Research Farm in Kotkaniemi (Finland), and the Yara Research Centre Hanninghof in Dülmen (Germany) for preparing and taking care of the field trials, taking plant samples, performing laboratory N analysis and executing the sensor measurements.