Introduction
Lygus Hahn (Hemiptera: Miridae) species are native to North America and highly polyphagous. They feed on new growth and reproductive structures of a variety of plant species, including tree fruits, alfalfa (Medicago Linnaeus (Fabaceae)), wheat (Triticum aestivum Linnaeus (Poaceae)), canola (Brassica Linnaeus (Brassicaceae)), lentils (Lens Miller (Fabaceae)), potatoes (Solanum Linnaeus (Solanaceae)), strawberries (Fragaria Linnaeus (Rosaceae)), flax (Linum usitatissimum Linnaeus (Linaceae)), hemp (Cannabis Linnaeus (Cannabaceae)), faba bean (Vicia faba Linnaeus (Fabaceae)), and select weed species (Young Reference Young1986). Feeding by Lygus during seed development, filling, and maturation may not result in yield loss, but seed quality is affected, resulting in economic losses (Baker et al. Reference Baker, Synyder and Holland1946; Bushing and Burton Reference Bushing and Burton1974; Khattat and Stewart Reference Khattat and Stewart1975). Darkening around the feeding area along with potential shrinking of the seeds results in downgrading for the edible market (Canadian Grain Commission 2018). In western Canada, Lygus feeding can damage on average 7% of the crop, but depending on the year, as high as 40% of canola seed can be damaged (Jones Reference Jones1999). In pulse crops, with farm cash receipts estimated at CAD$ 2.2 billion in 2014 (Canadian Agri-Food Trade Alliance 2017), 5–20% of field bean seed is damaged by Lygus activity (Agriculture and Agri-Food Canada 2005).
In the agricultural sector, seed damage is primarily estimated through visual examination by a trained individual and/or reference to standardised photographs. The damage estimates, which are subjective and can be influenced by lighting conditions, are both time-intensive and labour-intensive. Over the past three decades, significant research into the use of non-destructive imaging to evaluate seed quality has been undertaken. Recent reviews outline the use of panchromatic, multispectral, hyperspectral, thermal, and x-ray imaging technology to evaluate seed physiological and physical damage (Shahin et al. Reference Shahin, Hatcher, Symons and Sun2012; Huang et al. Reference Huang, Wang, Zhu, Qin and Huang2015; Mahajan et al. Reference Mahajan, Das and Sardana2015; Rahman and Cho Reference Rahman and Cho2016; Saccon et al. Reference Saccon, Parcey, Paliwal and Sherif2017).
Successful discrimination of healthy seeds versus those damaged by a number of biotic and abiotic factors using black-and-white or red-green-blue broadband imaging systems has been reported. The assessment of seed damage as a result of biotic and abiotic factors using these systems involved the derivation of a large number of morphological, textural, and colour parameters. Subsequently, through the use of principal component analysis, a reduced set of optimal parameters was selected for seed discrimination. Disease or insect-damaged wheat (Triticum aestivum) kernels were discriminated from undamaged seeds with 91–94% accuracy using two morphological and four textural properties, derived from black-and-white imagery (Delwiche et al. Reference Delwiche, Souza and Kim2013). The top 10 of 179 colour and textural features derived from red-green-blue imagery were used to discriminate healthy and fungal-infected wheat kernels with 97–100% accuracy (Singh et al. Reference Singh, Jayas, Paliwal and White2012). In a second study, by the same authors, linear and quadratic discriminant analyses proved effective (91–100% accurate) in categorising wheat kernels damaged by wheat midge (Sitodiplosis mosellana (Gehin) (Diptera: Cecidomyiidae)) using the top 10 of 230 morphological, colour, and textural features derived from red-green-blue images identified through stepwise discriminant analysis (Singh et al. Reference Singh, Jayas, Paliwal and White2010a). Although the classification of wheat kernels damaged by rice weevil (Sitophilus oryzae (Linnaeus) (Coleoptera: Curculionidae)), lesser grain borer (Rhyzopertha dominica (Fabricius) (Coleoptera: Bostrichidae)), rusty grain beetle (Cryptolestes ferrugineus (Stephens) (Coleoptera: Cucujidae)), and red flour beetle (Tribolium castaneum (Herbst) (Coleoptera: Tenebrionidae)) was 88–99% successful, 16–27% of the healthy seeds were misclassified as damaged (Singh et al. Reference Singh, Jayas, Paliwal and White2010b). Image segmentation, to isolate individual seeds, followed by a neural network classifier involving 11 red-green-blue-derived colour features proved effective in identifying healthy, heat-damaged, and green-frost-damaged soybean (Glycine max (Linnaeus) Merrill (Fabaceae)) seeds (classification accuracy 90–100%), but was ineffective in differentiating Halyomorpha halys Stål (Hemiptera: Pentatomidae)–damaged seeds (classification accuracy of 51%) (Shatadal and Tan Reference Shatadal and Tan2003). The latter result was attributed to the insensitivity of the camera to slight colour changes and the use of the average colour of the whole seed when only small portions of the seed were damaged. A more recent study similarly found that a combination of colour, textural, and shape features extracted from red-green-blue imagery input into a neural network provided 86% accuracy in the identification of insect-damaged soybean kernels (Liu et al. Reference Liu, Ning, Li, Yang, Li and Gao2015).
An increasing number of studies are focussing on the use of hyperspectral imaging systems, particularly those measuring reflectance in the near-infrared (700–1000 nm) and the shortwave-infrared (1000–2500 nm) regions of the electromagnetic spectrum. Hyperspectral imaging systems generate significant amounts of raw data as images are collected in up to several hundred different wavelengths. The high degree of correlation among the information content of images of certain wavelengths and computational demands usually leads to the use of images from a reduced number of optimal rather than all wavelengths. In a variety of studies, principal component analysis or linear or quadratic discriminant analysis was employed to identify optimal wavelengths for the classification of healthy versus damaged seeds. In the wavelength range 700–1100 nm of 41 available wavebands, the 870 nm wavelength was optimal for identifying wheat kernel damage by a variety of insects (Singh et al. Reference Singh, Jayas, Paliwal and White2010a, Reference Singh, Jayas, Paliwal and White2010b). The accuracy of identification of damaged seeds using 13 parameters derived from the information at this single wavelength resulted in a classification accuracy of 85–98% for damaged seeds although it was noted that 14–25% of the healthy seeds were misclassified as damaged. In a second study involving wavebands in the shortwave-infrared (1000–1600 nm), classification accuracies of 85–100% were obtained using six statistical and 10 histogram features associated with the two wavelengths, 1102 and 1305 nm, that correspond to absorption by starch and lipid molecules (Singh et al. Reference Singh, Jayas, Paliwal and White2009a, Reference Singh, Jayas, Paliwal and White2009b). The addition of a third wavelength, 1447 nm, did not improve the classification. Interestingly, similar wavelengths (1101, 1290, and 1450 nm) were optimal in the discrimination of mung bean (Vigna radiata (Linnaeus) Wilczek (Fabaceae)) seeds infected with Callosobruchus maculatus (Fabricius) (Coleoptera: Chrysomelidae). Linear and quadratic discriminant analyses using the three wavelengths resulted in classification accuracies of 90% for healthy and 82% for infested bean kernels, respectively (Kaliramesh et al. Reference Kaliramesh, Chelladurai, Jayas, Alagusundaram, White and Fields2013). The use of four wavebands in each of three narrow shortwave-infrared regions (1209–1230, 1489–1510, and 1601–1622 nm) proved as effective in classifying Fusarium Link (Nectriaceae)-infected and healthy wheat kernels as the 121 wavebands over the 1013–1650 nm range (Serranti et al. Reference Serranti, Cesare and Bonifazi2013). The optimal wavelengths tended to correspond to regions of absorption by starch, cellulose, lignin, and water and their associated O–H stretch and bend-first overtones (Curran Reference Curran1989; Aenugu et al. Reference Aenugu, Kumar, Srisudharson, Parthiban, Ghosh and Banji2011). Changes in kernel composition, in particular cell wall destruction, as a result of feeding by the insects or degradation due to fungal activity are believed to be responsible for these observations (Ridgway and Chambers Reference Ridgway and Chambers1998; Ridgway et al. Reference Ridgway, Cowe and Chambers1999).
To our knowledge, quantification of Lygus damage in faba beans using imaging technology has not been investigated. Thus, the objective of this study was to determine the ability to quantify Lygus damage in faba bean using shortwave-infrared remote sensing and accepted image analysis techniques. Adult and nymph stages of Lygus insert their proboscis into the reproductive organs of the plant, secrete digestive juices, and suck back the juices along with pre-digested plant nutrients (Hori Reference Hori, Scott and O’Keeffe1976), leading to cell wall destruction (Cohen and Wheeler Reference Cohen and Wheeler1998; Shackel et al. Reference Shackel, Celorio-Mancera, Ahmadi, Greve, Teuber, Backus and Labavitch2005; Paz Celorio-Mancera et al. Reference Paz Celorio-Mancera, Allen, Powell, Ahmadi, Salemi and Phinney2008). Thus, our hypothesis was that simple indices involving absorption features centred on cellulose, an important component of the cell walls, could be used to quantify seed coat damage. Two detection approaches were tested: (1) an advanced spectral angle mapper method that uses optimised spectral information and (2) a targeted approach using simple reflectance indices.
Materials and methods
Seed samples
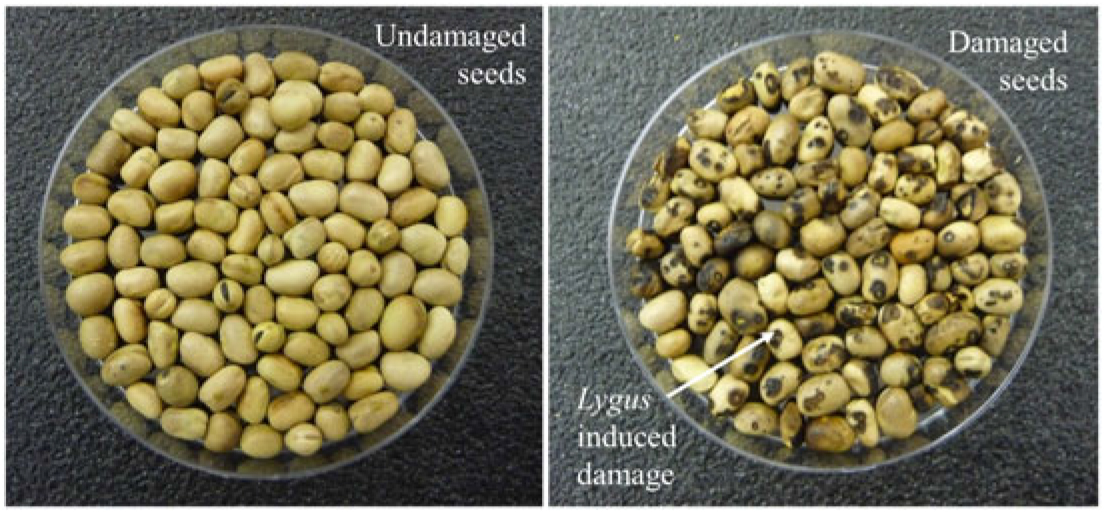
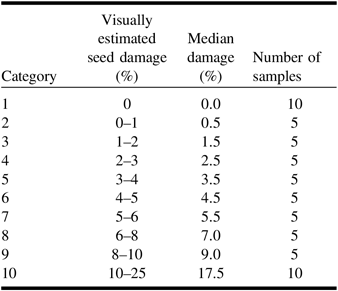
Vicia faba seeds from 2013 field trials were used in this study. The trials were plot studies near Lethbridge (Alberta, Canada) designed to optimise insecticide spraying for the prevention of Lygus damage in faba bean. A total of 60 samples, each comprising 70–75 seeds, were available. Visual assessment of the seeds was conducted by one assessor who examined both sides of a seed and assigned a percentage of the surface with necrotic damage. Lygus damage, as noted by the black/brown necrotic spots (Fig. 1), ranged from 0% to 25% of the surface. The samples were separated into 10 categories (Table 1). Damage was defined for the sample rather than individual seeds.
Seed samples showing healthy (left) and Lygus-damaged faba beans (right).

Categories of Lygus seed damage and number of samples per category.

Imaging
A single layer of seeds was placed in a plastic petri dish (9 cm diameter) and the sample was imaged using a hyperspectral scanner system (SisuRock scanner; Specim, Oulu Finland) that provides 242 bands of spectral information (6.3 nm sampling rate and 10 nm spectral bandwidth) in the shortwave-infrared (980–2500 nm) of the spectrum. The data were collected at a spatial resolution of 0.3 mm/pixel. After each sample was scanned, the petri dish was carefully inverted to minimise seed disturbance and re-scanned, resulting in 120 samples. The lid of the petri dish was removed before each scan. For each image acquired, dark current and a 99% reflectance Spectralon white panel were measured. The dark current data were subtracted from all data, and reflectance value for the sample imagery was obtained by normalising to the spectrum of the white panel.
Spectral analysis
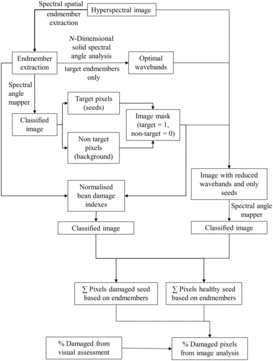
An outline of the workflow in Figure 2 shows the steps involved in the analysis.
The initial stage in the image analysis was to determine the spectral characteristics of both target (i.e., healthy and damaged seeds) and non-target (petri dish, background) scene elements such that the latter could be masked and the analysis focused on the quantification of healthy as opposed to Lygus-damaged seeds only.
Workflow of data analysis.

The identification of reference spectra with distinctly differing spectral characteristics was achieved using the three-step spatial spectral endmember extraction (Rogge et al. Reference Rogge, Rivard, Zhang, Sanchez, Harris and Feng2007). In the first step, the image was divided into equal-sized non-overlapping subsets, typically 25 × 25 pixels in size. A set of eigenvectors explaining the majority of spectral variance was determined for each subset. In the second step, the eigenvectors from all subset regions were compiled and the image data projected onto these eigenvectors. The pixels that were positioned at the extremities of the vectors were retained as candidate endmembers. In the last step, spatial constraints were implemented to determine which spectrally similar candidate endmembers to average. The entire process enables the separation of endmembers in the scene that are spectrally similar, but that occupy different parts of the scene (i.e., are spatially independent). Spatial spectral endmember extraction typically results in several endmembers with many that are similar. Expert knowledge was used to select the final endmembers.
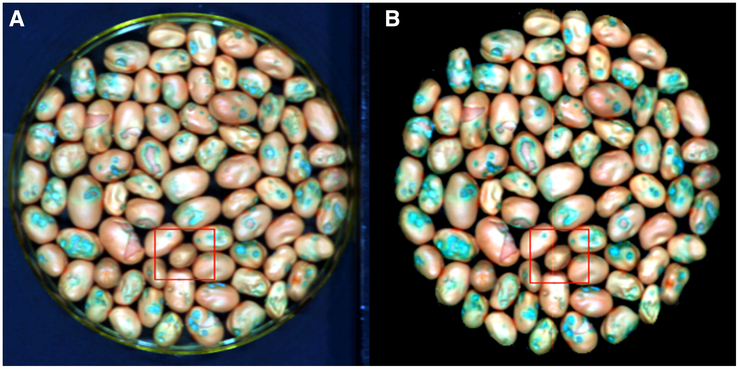
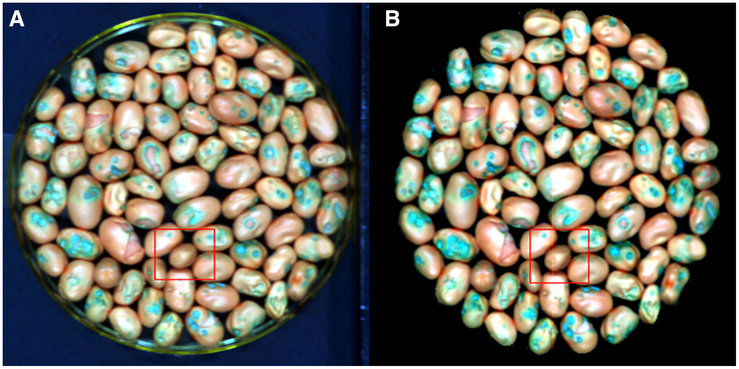
Fifteen endmembers were identified using the spatial spectral endmember extraction process, seven of which were attributed to non-target elements. Five of the non-target endmembers characterised the plastic petri dish, one was attributed to the paper labels in each image, and one related to the dark background. Of the remaining eight endmembers, three and five were associated with healthy and Lygus-damaged areas of the bean seeds, respectively. In the ENVI image analysis software (Harris Geospatial Solutions; www.harrisgeospatial.com/SoftwareTechnology/ENVI.aspx), the spectral angle mapper algorithm calculates the spectral angle between a pixel spectrum and each spectrum of a suite of reference endmembers and assigns a class based on the smallest angle obtained. Spectral angle mapper was used to classify the image into target and non-target pixels. A mask was created to eliminate all non-target pixels (the plastic petri dish, paper, and dark background), which was then used in all subsequent image processing (Fig. 3).
Colour composite image (red = 1015 nm, green = 1475 nm, and blue = 2100 nm). A, Lygus-damaged areas of faba bean seeds as blue/green; B, with non-target materials removed from the image using spectral angle mapper.
Quantification of seed damage using spectral angle mapper
In spectral angle mapper, the angle between a given pixel spectrum and reference spectra is assessed for a given set of bands, typically a contiguous set within a spectral region. The high spectral dimensionality of hyperspectral data and ensuing collinearity of neighbouring bands can confound classification, especially when targets of interest have similar spectral characteristics. The n-dimensional solid spectral angle was used to identify the optimal bands for discrimination (Tian et al. Reference Tian, Feng, Rivard and Zhao2016) among the eight endmember vectors associated with healthy seed areas. This procedure enabled the initial 242-band endmember spectra to be reduced to 102-band endmembers. These 102 bands encompassed four spectral intervals (1023–1263, 1622–1767, 1999–2143, 2312–2399 nm) and were used in the spectral angle mapper classifier to identify Lygus-damaged as opposed to healthy seed pixels. All classes associated with damaged seed pixels were merged into one end class, while those related to healthy seed pixels were merged into a second end class. The per cent Lygus damage in each sample was calculated as:
 $${{\left( {{\rm{Lygus}}{-}{\rm{damaged \ seed \ pixels}}} \right)*100} \over {\left( {{\rm{Total \ seed\ pixel \ count}}} \right)}}$$
Quantification of seed damage using spectral indexes
The n-dimensional solid spectral angle analysis showed that the greatest differences in the spectral signatures of healthy and damaged seeds were in the first and last spectral intervals listed above, namely at 1023–1263 and 2312–2399 nm. Normalised bean damage indexes (NDBI1 and NDBI2) were created to exploit these differences:
 $${\rm{NDBI}}1 = \left( {{R_{1313}} - {R_{1086}}} \right)/\left( {{R_{1313}} + {R_{1086}}} \right)$$
 $${\rm{NDBI}}2 = \left( {{R_{2218}} - {R_{2342}}} \right)/\left( {{R_{2218}} + {R_{2342}}} \right)$$
where R is reflectance and the subscript refers to the respective wavelengths. Each index involved a wavelength of the highest n-dimensional solid spectral angle value within their respective spectral interval that captured the greatest disparity between healthy and damaged beans and a wavelength of low n-dimensional solid spectral angle value (a reference band) at a nearby wavelength outside the spectral interval.
The index values for healthy and damaged seed pixels were examined and manual thresholds of NDBI1 > 0.04 and NDBI2 < 0.15 established to outline damaged seed pixels. The thresholds were set based on the examination of frequency histograms of the values for each index for all samples with approximately 10–25% damage. When parts of the seeds are damaged, the histogram of NDBI1 or NDBI2 values displays a bimodal pattern that allows the determination of a threshold. Seed damage was estimated by combining all pixels identified by NDBI1 and NDBI2. The per cent Lygus damage was estimated as:
 $${{{\left[ {\left( {{\rm{NDBI}}1{\rm{only \ pixel \ count}}} \right) + \left( {{\rm{NDBI}}2{\rm{ \ only \ pixel \ count}}} \right) - ({\rm{NDBI}}1{\rm{ \ and \ NDBI}}2{\rm{ \ pixel \ count}}} \right)]*100} \over {\rm{Total \ seed \ pixel \ count}}}}$$
Validation of image-derived seed damage
Visual assessments of per cent seed damage conducted by laboratory personnel were used to validate the per cent seed damage derived using the image processing methods. Regression analysis was used to determine the statistical nature of the relationship. In the case of visual assessments, damage categories included a range of percentages so the relationships were examined using the median per cent for each category (Table 1). Concordance correlation was also used to examine the relationship between the damage estimates derived using the two different image analysis methods. Concordance correlation provides not only a measure of the best fit line between the estimates (Pearson correlation) but also a measure of how far the best fit line deviates from the one-to-one relation (concordance correlation coefficient) (Lin Reference Lin1992). The per cent relative differences in the seed damage estimates derived visually and through imaging were calculated to provide a measure of “error” associated with the image detection method.
 $$\% {\rm{ \ Relative \ difference}} = \left ( {{{{\rm{Image}}\, {\rm{derived \ damage}} - {\rm{Visually \ estimated \ damage}}} \over{{\rm {Visually \ estimated \ damage}}}}} \right )*100$$
where the median values for each category were used as the visually estimated damage values.
Results
Spectral analysis
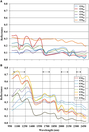
The spatial spectral endmember extraction procedure identified 15 endmembers in total – seven that were identified as non-target (EMB1–EMB6) materials (plastic petri dish, paper label, and background) and eight that related to the faba beans. The magnitude and shape of the spectra of the non-target endmembers were distinct from the endmembers associated with the faba beans (Fig. 4A–B). The background endmember where reflectance was < 0.02 for all wavebands is not shown. Of the eight endmembers associated with faba bean, three were associated with healthy and five with damaged areas of the seed. Within the endmembers attributable to healthy seed areas (EMH1–EMH3), the magnitude of reflectance varied, but the shape of the spectra tended to be similar. Distinct differences in the shape of the spectral curves of the endmembers for healthy and damaged (EMD1–EMD5) seeds were observed in the wavelength regions 1023–1263, 1622–1767, 1999–2143, and 2312–2399 nm and were identified as important through n-dimensional solid spectral angle analysis. Visually the differences in the spectral curves were more pronounced in the 1023–1263 and 2312–2399 nm intervals, which were also identified as optimal in the n-dimensional solid spectral angle analysis. In the wavelength region 1023–1263 nm, with one exception (EMD1), the damaged seed endmembers showed the absence or reduction in the depth of absorption feature around 1200 nm (Fig. 4B) and a steady increase in reflectance values from 1023–1263 nm. The healthy seeds showed an absorption feature at 1200 nm, and unlike the damaged seeds, reflectance at 1023 nm was greater than at 1263 nm. The spectral curve, with the exception of EMD5, was relatively flat with little change in reflectance values over the wavelength region 2312–2399 nm. The endmembers for the healthy seed showed some variation in this region and a trend towards a decrease in reflectance from 2312–2399 nm. Damaged seeds EMD2 and EMD3 only showed a difference in reflectance characteristics over the region 1622–1767 nm compared with healthy seeds, with lower variation. In the waveband region 1999–2143 nm, the damaged seed endmembers, with the exception of EMD5, showed a reduction in the depth of absorption feature around 2100 nm with a smaller decrease in reflectance from the first (1999 nm) to the last (2143 nm) wavelength compared with healthy seeds.
Spectral signatures of endmembers. A, Non-target endmembers; B, target (healthy and damaged beans) endmembers. Vertical lines define the ranges of the wavelengths selected as optimal using spatial spectral endmember extraction.
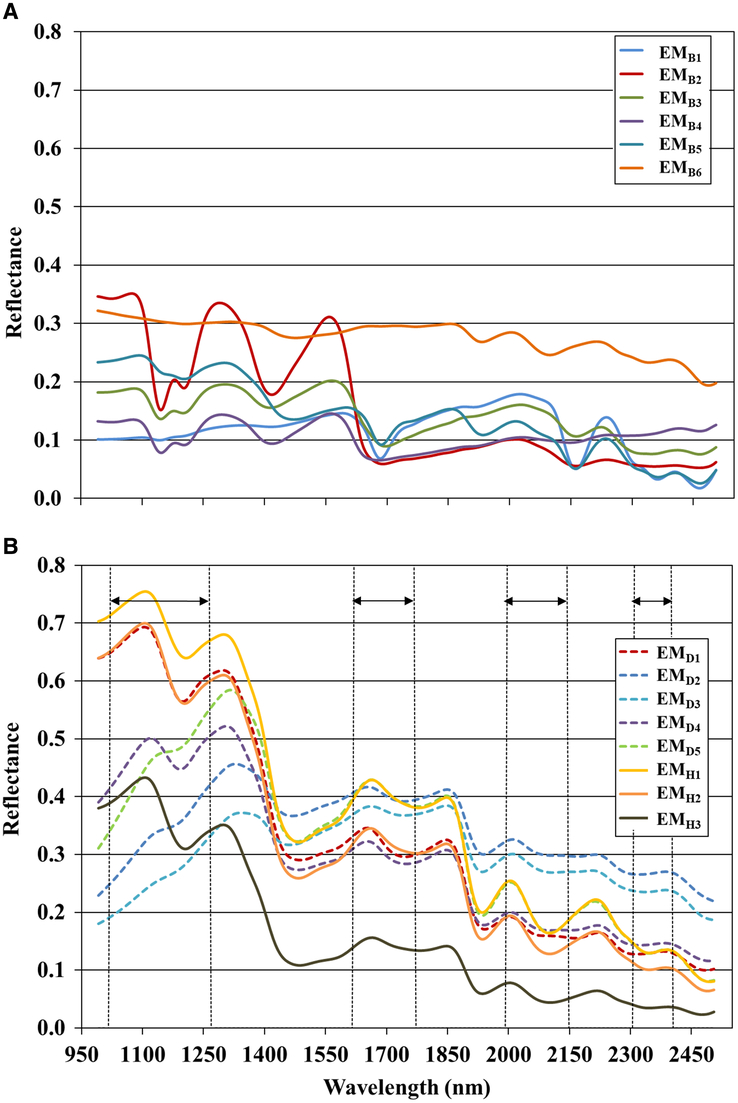
The wavebands used in NDBI1 highlight the contrasting spectral slope observed between four of the five damaged bean endmember spectra (EMD2–EMD5) and the spectra of healthy beans (EMH1–EMH3) (Fig. 4B). The wavebands selected for NDBI2 capture systematic spectral differences between four of the five endmembers (EMD1–EMD4) associated with the damaged beans at longer wavelengths, primarily related to the development of the absorption feature near 2300 nm.
Quantification of seed damage using spectral angle mapper
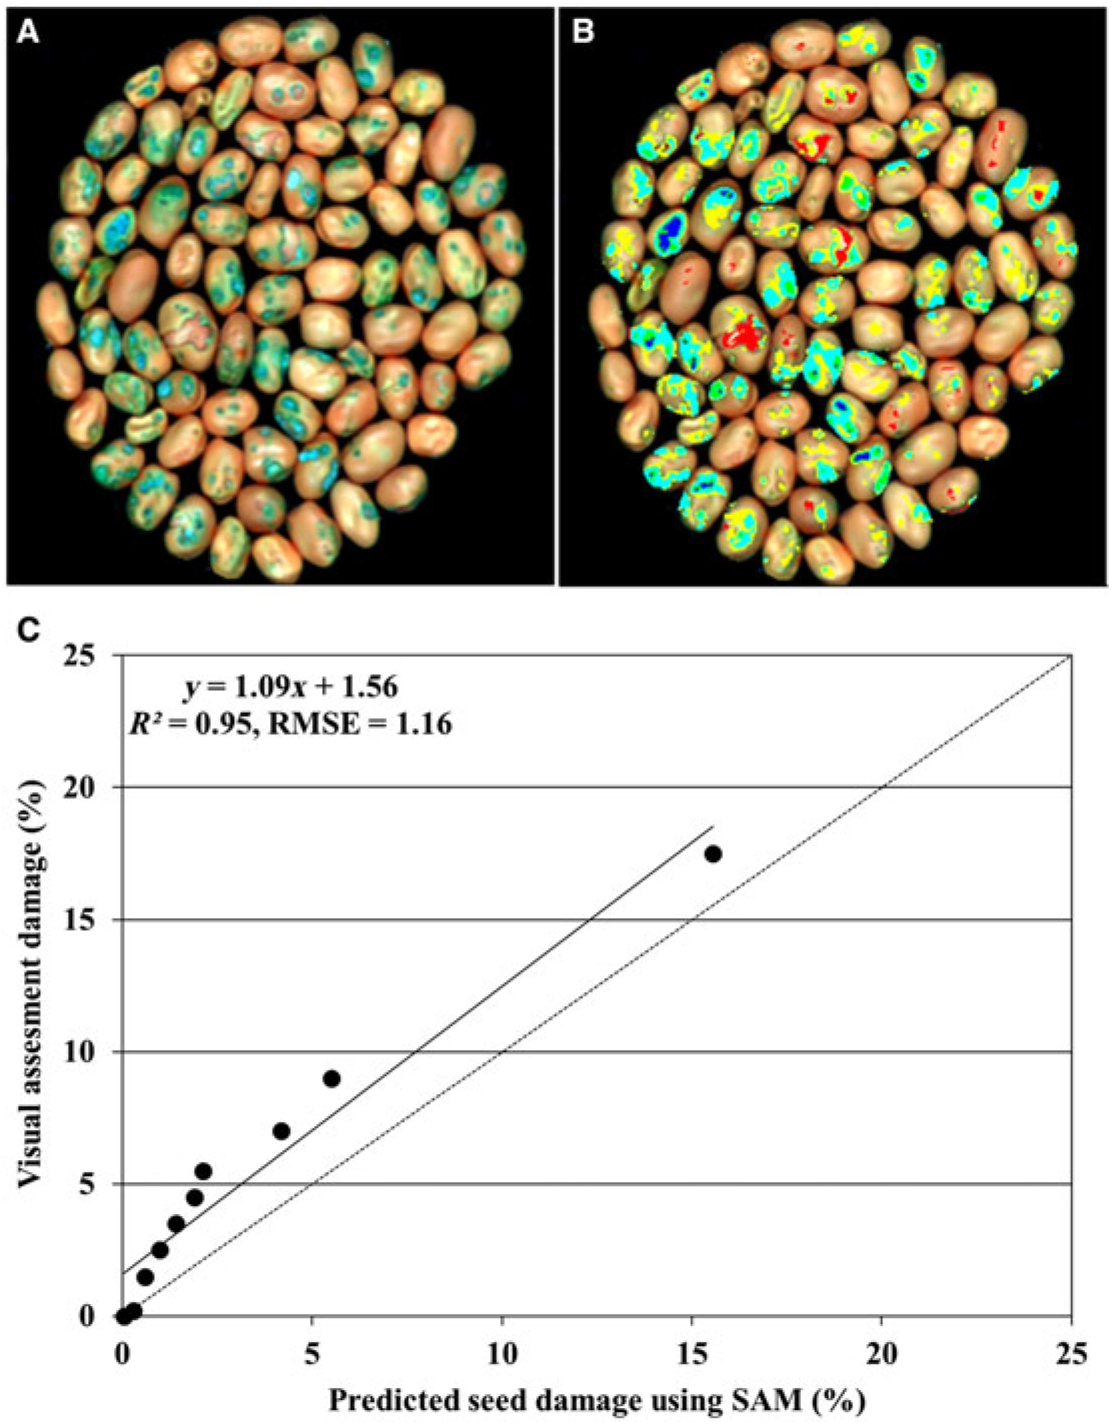
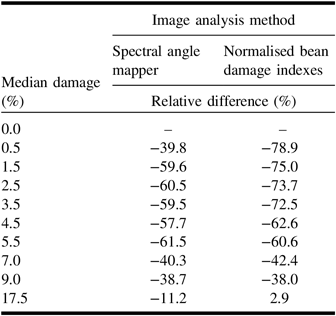
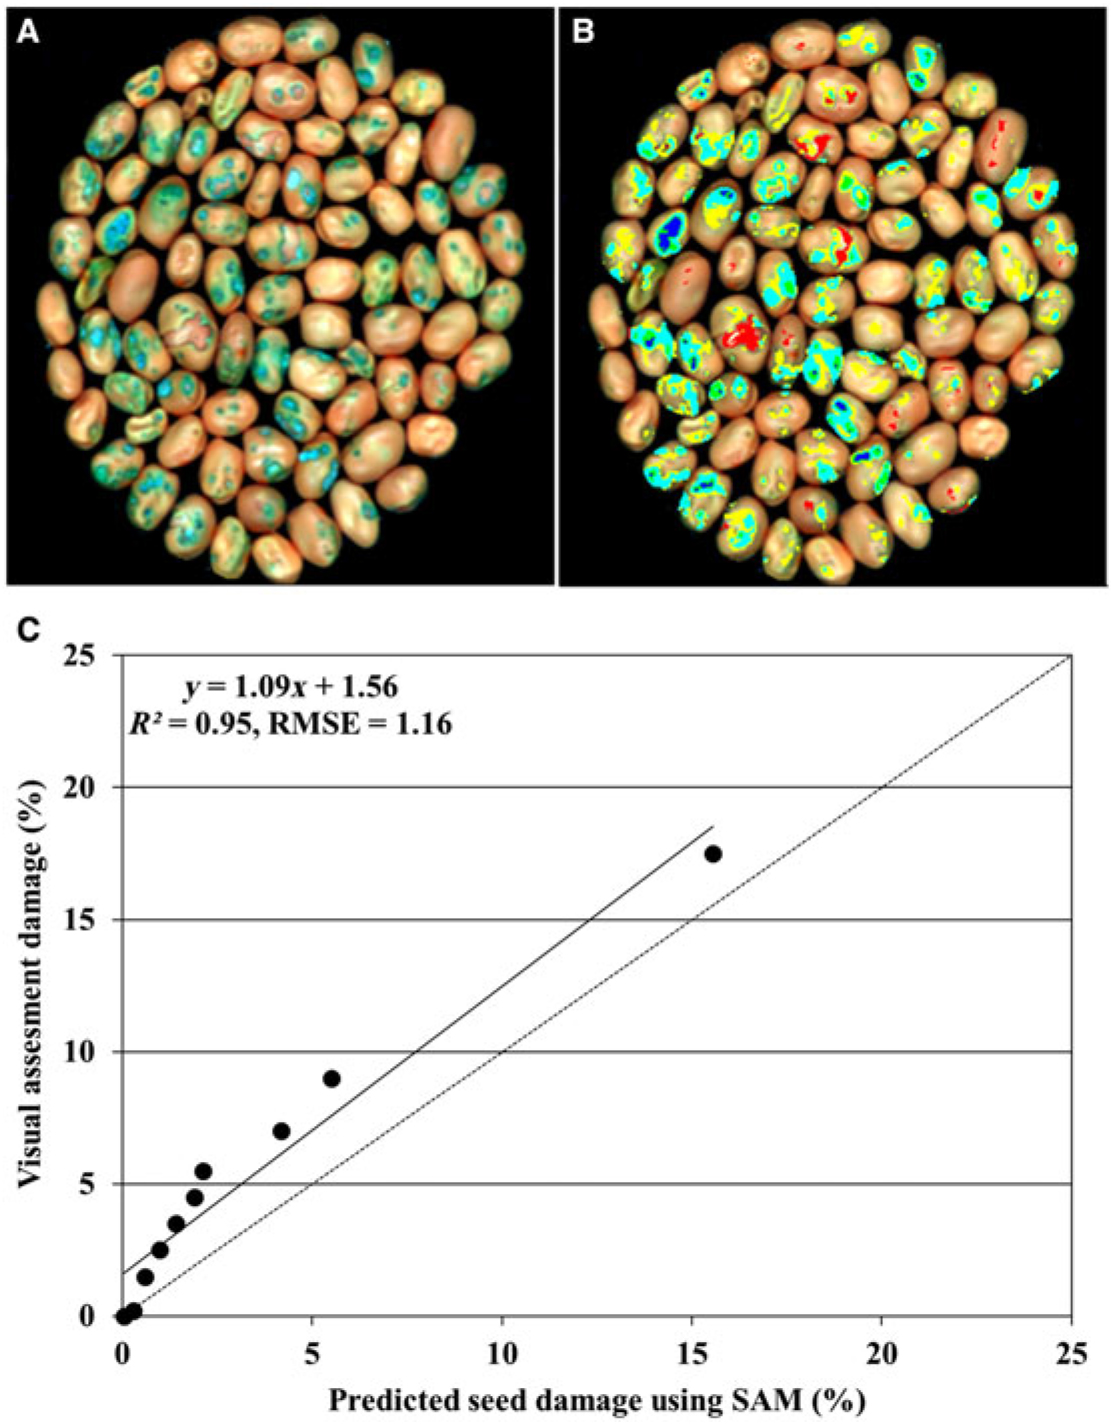
The per cent damage derived using the spectral angle mapper classifier showed a similar trend to the visual estimates; as the visual estimate increased, so did the per cent damage derived using the spectral angle mapper. Regression analysis confirmed a strong relationship between the visual damage categories and area of the seed damage derived using the spectral angle mapper (R2 = 0.95; root mean square error = 1.16) (Fig. 5). The spectral angle mapper classification appeared to underestimate the per cent damage for all categories, but particularly those with < 10–25%, compared with the visual observations. The image-derived value for the 10–25% category was close to the category median value of 17.5% for the visual estimation. The relative difference in the visual and image-derived values tended to be high at the lower damage levels and decreased as the amount of damage increased (Table 2). It should be noted that this value is not the true error but a measure of relative difference between the visual and image-derived estimates of damage expressed as a percentage. Thus, the relative difference is magnified at the lower damage levels as the absolute values are small and any differences appear larger.
Example colour composite image (red = 1015 nm, green = 1475 nm, and blue = 2100 nm). A, Lygus-damaged areas of faba bean seeds as blue/green; B, spectral angle mapper-classified image showing damaged areas of the faba bean seed; C, relationship between predicted per cent seed surface damage derived from images using spectral angle mapper and visual assessment of seed damage. The dashed line represents the 1:1 line and the solid line represents the best fit. Top right image (B) shows five colours corresponding to five damaged bean endmember classes shown in Fig. 4. RMSE, root mean square error; SAM, spectral angle mapper.
Relative difference in the Lygus damage between visual assessment and image analysis.

Quantification of seed damage using spectral indexes
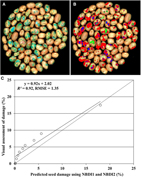
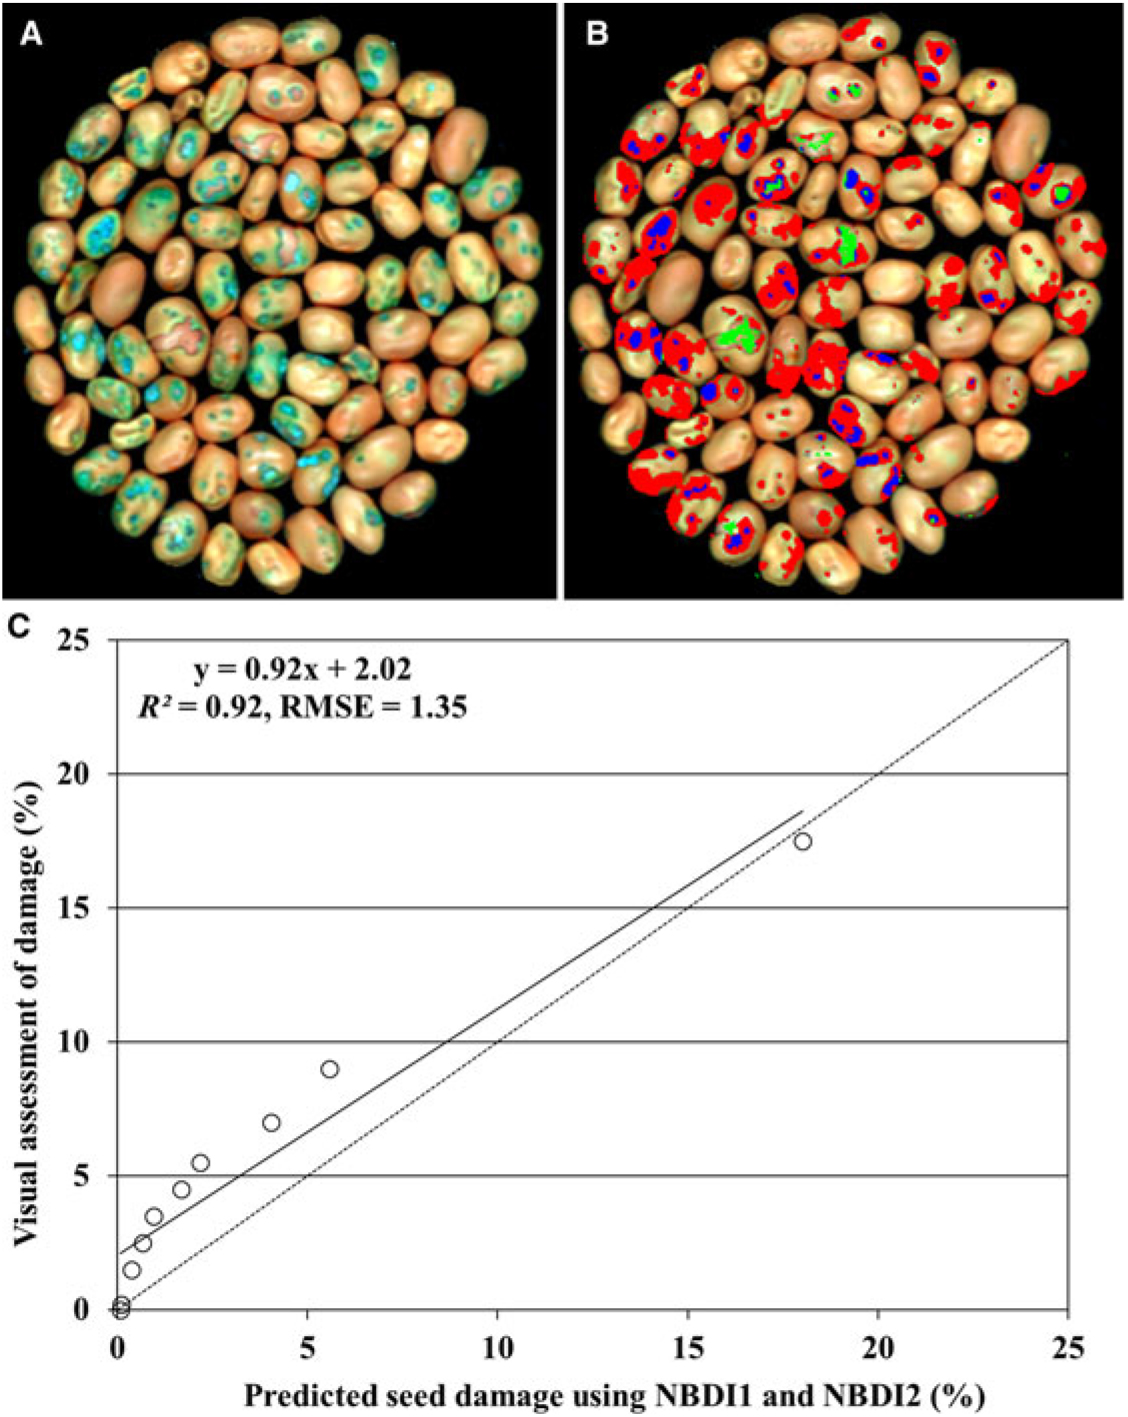
The NDBI1 and NDBI2 indices were designed to capture the differences in the spectral slopes and absorption features between healthy and damaged bean seed spectra within the wavelengths 1100–1300 and 2200–2400 nm. NDBI1 (1086 and 1313 nm) appeared to outline the darkened or blackened regions around the outer limit of the Lygus feeding area, while NDBI2 (2218 and 2342 nm) was more closely associated with areas within the centre of the seed surface area attacked by Lygus. The per cent seed damage estimated using the spectral indices showed a similar positive trend to the visual estimates of Lygus damage. Regression analysis showed a strong relationship between the visual estimate and the damaged area derived from the normalised bean damage indexes (R2 = 0.92; root mean square error = 1.35) (Fig. 6). The indices appeared to underestimate the amount of damage particularly at the lower visual assessment categories of ≤ 10%. The estimated damage for the visual category 10–25% was similar to the category median value (Table 2). As with the n-dimensional solid spectral angle method, the relative differences in the image-derived and visual assessments are magnified at the low damage levels, but the differences decrease as the amount of damage increases.
Example colour composite image (red = 1015 nm, green = 1475 nm, and blue = 2100 nm). A, Lygus-damaged areas of faba bean seeds as blue/green; B, classified image showing damaged areas of the faba bean seed; C, relationship between predicted per cent seed surface damage derived from images using NDBI1 and NDBI2 and visual assessment of seed damage. The dashed line represents the 1:1 line and the solid line represents the best fit. Top right image (B) shows damage in red obtained from NDBI1 and in green from NDBI2. Pixels in blue are common to both indices. RMSE, root mean square error.
Prediction of seed damage using spectral angle mapper versus spectral indexes
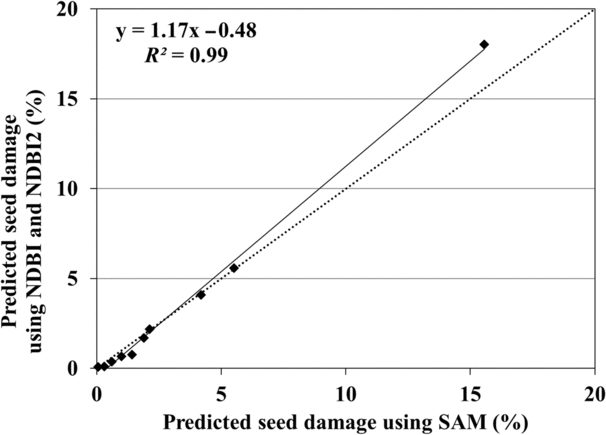
Concordance correlation analysis showed a strong linear relationship between the damage estimates derived from the two different image analysis methods (Fig. 7). The similarity between the Pearson and concordance correlations (r = 0.99 for both) indicates a near-perfect relationship between the derivation of estimates using the two techniques. The scale shift (1.175) also indicates a strong relationship, a value of 1 being optimal. The small location shift (0.017) can be attributed to the slightly higher estimate of damage at the 10–15% category using the spectral indexes.
Relationship between predicted Lygus damage in faba bean seed using spectral angle mapper and normalised bean damage indexes. The dashed line represents the 1:1 line and the solid line represents the best fit. NDBI, normalised bean damage index; SAM, spectral angle mapper.

Discussion
This study concentrated on the use of shortwave-infrared reflectance to estimate the per cent damage to seeds of faba bean as a result of Lygus feeding. Visual examination of the endmember spectra and n-dimensional solid spectral angle results showed four wavelength regions of importance in the discrimination of healthy and Lygus-damaged seed areas. The important wavelength regions 1023–1263 and 1622–1767 nm derived from the n-dimensional solid spectral angle encompass absorption features at approximately 1200 and 1710 nm, and are consistent with the results from other studies. In particular, the 1200 nm wavelength, which is associated with starch and/or cellulose content (Curran Reference Curran1989; Elvidge Reference Elvidge1990), is widely documented as being important in identifying damaged seeds (Ridgway and Chambers Reference Ridgway and Chambers1998; Singh et al. Reference Singh, Jayas, Paliwal and White2009a; Kaliramesh et al. Reference Kaliramesh, Chelladurai, Jayas, Alagusundaram, White and Fields2013; Serranti et al. Reference Serranti, Cesare and Bonifazi2013; Chelladurai et al. Reference Chelladurai, Karuppiah, Jayas, Fields and White2014). As in this study, reflectance around 1710, 2090, and 2250 nm was also identified as important in the separation of Picea abies (Linnaeus) Karsten (Pinaceae) seeds infested with Megastigmus strobilobius Ratzeburg (Hymenoptera: Torymidae) larvae, and healthy seeds (Dumont et al. Reference Dumont, Hirvonen, Heikkinen, Mistretta, Granlund and Himanen2015). These wavelengths, as is the case for 1200 nm, are in regions of the electromagnetic spectrum that are associated with absorption by cellulose, hemicellulose, and lignin (Curran Reference Curran1989; Elvidge Reference Elvidge1990). Lygus activity is known to result in the destruction of cell walls close to the site of feeding (Cohen and Wheeler Reference Cohen and Wheeler1998; Shackel et al. Reference Shackel, Celorio-Mancera, Ahmadi, Greve, Teuber, Backus and Labavitch2005; Paz Celorio-Mancera et al. Reference Paz Celorio-Mancera, Allen, Powell, Ahmadi, Salemi and Phinney2008). Thus, the loss or reduction in the absorption features around 1200, 1700, 2100, and 2350 nm in the images of seeds subjected to Lygus feeding could be attributed to the breakdown of cell wall constituents, including cellulose, lignin, hemicellulose, pectin, and proteins. The lack of an absorption feature directly related to pectin can be attributed to overlap with those associated with accompanying carbohydrates and, in some cases, proteins (Polesello et al. Reference Polesello, Giangiancomo, Forni and Braga1990).
The quantitative estimates derived using the two different image analysis techniques, the “automated” spectral angle mapper analysis and the “manual” thresholding of the simple reflectance indexes, NDBI1 and NDBI2, were consistent, which is encouraging given they both used the same “optimal” band set. With both methods, there was a greater discrepancy with visual estimates of seed damage at < 10% as opposed to > 10%, although we note that only one of our samples had > 10% seed damage. We speculate that the areas of darkening in the seeds assessed as having 8–10% seed damage and below were much smaller than in the 10–25% category, leading to an overestimation of the per cent damage. There is increasing recognition that, visually, low levels of plant disease are overestimated (Bock et al. Reference Bock, Poole, Parker and Gottwald2010). In studies of citrus canker (Xanthomonas axonopodis (Hasse) (Bacteria: Xanthomonadaceae)), the tendency for overestimation in the visual assessment of citrus canker symptoms on leaves compared with the use of image analysis was attributed to the size and not the number of lesions present. The visual rating of disease was overestimated in leaves with a large number of small lesions compared with leaves with few large lesions despite the actual leaf area affected being similar (Bock et al. Reference Bock, Parker, Cook and Gottwald2008).
The results suggest that visual examination of spectra from Lygus-damaged and healthy seeds, followed by targeting wavebands associated with a number of absorption features, performed as well as an advanced image analysis method. The wavelengths selected for the NDBI1 and NDBI2 characterised the slope of the spectrum in the region encompassing the 1200 nm absorption and the absorption features near 2250 nm, respectively. These absorptions are related to the cell wall chemical constituents such as cellulose, lignin, starch, and proteins. The similarity in seed damage estimates using the two different image analysis methods agrees with a previous study by Dumont et al. (Reference Dumont, Hirvonen, Heikkinen, Mistretta, Granlund and Himanen2015). Thus, the use of strategically located wavebands and simple thresholding could be as effective as advanced image analysis methods in quantifying seed damage. The use and analysis of imagery from a few strategically located wavebands would be less computerintensive and perhaps more functional for non-remote sensing specialists. Furthermore, the simple spectral indices approach allows easy instrumentation in the future.
Shortwave-infrared sensor systems are expensive in comparison with visible systems, but we argue that the initial cost can be offset in terms of reduced human involvement and greater objectivity in assessing seed damage. In the visible part of the spectrum, “colour” is often related to photosynthetic pigments that are primarily absent from seeds, and consequently the determination of colour does not provide information in terms of chemical composition. The shortwave-infrared, by contrast, can provide powerful information related to the presence of functional groups of compounds through the measurement of bending and stretching of chemical bonds. There are characteristic wavelengths at which peaks and troughs in the spectra can be related to particular functional groups and chemical composition. Changes in the presence or magnitude of the chemical composition, in turn, can be related to the physiological basis of seed damage. The use of the shortwave-infrared signature is independent of factors such as lighting, human perception, and fatigue and thus is likely to provide more consistent results than using visible (colour) information.
Conclusions
The hypothesis in this study – that simple spectral indexes involving absorption features centred on cellulose, an important component in cell walls, could be used to quantify Lygus damage in faba bean seeds – was supported by our data. In this study we estimated visual damage on a percentage seed surface basis. In the future, the use of a tray that separates each individual seed could provide estimates of damage based on the number of seeds or weight of seeds. Simple indices employing strategically selected wavelengths in the shortwave-infrared regions related to cell wall contents, namely cellulose, hemicellulose, lignin, and starch, could be as effective as using all bands in a hyperspectral system for quantitatively estimating Lygus damage in faba beans. These technologies may have future applications in the provision of more accurate and objective means for grading seed quality.
Acknowledgements
The authors are grateful for the funding provided by Agriculture and Agri-Food Canada. The contributions of Jonathan Reid in preparing the seed samples, and of Cheryl Chelle in conducting the visual ratings of seed damage, are greatly appreciated by the authors.