I. INTRODUCTION
Wide application of low voltage electrical apparatus in numerous industrial occasions contributes to the usage of increasing amount of contacts and relays in recent years. Reference Benjemaa, Queffelec and Travers1 Different types of silver based contact materials have been developed to meet the requirements for different applications. Reference Wu, Yi, Li, Xiao, Wang and Zheng2–Reference Chen, Sun and Du4 Due to their relatively high electrical and thermal conductivities, good mechanical properties as well as antiwelding behavior and oxidation resistance, silver oxides (Ag/MeO) contact materials have aroused interest in the technical field of contact materials. Among which Ag/CdO has long been recognized for their outstanding performance in electrical and electronics industries. Reference Gustafson and Kim5–Reference Guzmán, Munoz, Aguilar, Iturriza, Lozada, Rojas, Thirumurugan and Martinez7 However, a carcinogenic Cd element is produced during switching operations. In response to strict environmental regulation, such as the Restriction of Hazardous Substances of the European Union, Cd-free environmentally-friendly contacts are now emphasized and studied extensively. Reference Zhang, Cao and Qi8,Reference Zhang, Li, Ding and Zhang9 A variety of Ag/MeO contact materials has been investigated, such as Ag/SnO2, Ag/ZnO, Ag/NiO, and Ag/FeO x , Reference Hetzmannseder and Rieder10,Reference Hetzmannseder and Rieder11 among which Ag/ZnO has been considered as one of potential promising candidates because of its low contact resistance, nontoxic and the like. Reference Rieder12–Reference Gavriliu, Lungu, Enescu, Nitu and Patroi14 Guzmán Reference Guzmán, Munoz, Aguilar, Iturriza, Lozada, Rojas, Thirumurugan and Martinez7 has pointed out that Ag/ZnO electrical contact materials have aroused interest in the technical field as a replacement for the Ag/CdO, because the physical and chemical properties of Zn are similar to those of Cd. Results of many other investigations Reference Mayer and Michal15–Reference Schoepf, Behrens, Honig and Kraus18 on the switching behavior also show that there is evidence that Ag/ZnO is superior to other silver metal oxides at the investigated resistive load. Furthermore, Doublet Reference Doublet, BenJem, Hauner and Jeannot13 reported that Ag/ZnO has an contrasting behavior, as it is the most sensitive material for welding at high currents, followed by pure silver, but its welding force is weaker than silver. Electrical performance of Ag/ZnO contact materials depend on the configuration of ZnO oxide particles into the Ag matrix. Reference Guzmán, Munoz, Aguilar, Iturriza, Lozada, Rojas, Thirumurugan and Martinez7,Reference Wan, Zhang and Rong19,Reference Schoepf and Hauner20 Properties and configuration of Ag/ZnO contact material rely on the second phase ZnO to some extent. It is of great importance to control the shape and size of ZnO using a controllable method since novel properties of ZnO depend on its size, shape, and crystalline structure. Reference Alivisatos21–Reference Zhang, Yan, Zhang and Lu27 Zinc oxide with a diversity of well-defined morphologies has been synthesized by decomposing Zn(OH)4 2− or Zn(NH3)4 2+ precursor in various solvents at suitable reaction conditions. Reference Hadioui, Merdzan and Wilkinson28–Reference Kumar, Umar, Kumar, Akhtar, Wang and Kim33 The flower-like, disk-like, and dumbbell-like ZnO microcrystals have been controllably achieved by a capping-molecule-assisted method. Reference Chelouche, Touam, Djouadi and Aksas34–Reference Chen, Cheng, Cheng and Cheng39
Given the demand for a longer service life, many studies have been done for a better understanding of effects of the composition. The initial microstructure of electrical contact materials on the performance of electrical equipment such as antiarc erosion, welding susceptibility, and contact resistance are also investigated. Reference Ambier, Bourda, Jeannot, Pinard and Ramoni40–Reference Basak and Ghosh43 The contact surface melts and phase transformation takes place because of arcing generated during switching operations. When the surfaces of electrical contact materials experience a single arc or repeated arc erosion, surface morphology and process of arc erosion are very complicated. It is found that there are two stages namely adjustment state which occurred during the initial period of operations and quasisteady state which occur with the increased number of operations. Reference Wan, Zhang and Rong19 Since the base metal is cold, the cooling rate of the melting liquid is very high. Reference Wan, Zhang and Rong19 The melting layer on the surface of contact can be very thin depending on the current. As for Ag/ZnO, Wan Reference Wan, Zhang and Rong19 pointed out that the serious transformation and loss of liquid droplets were mainly Ag during the initial adjustment arc erosion stage. Especially, the failure mechanism of contact materials is still under issue. Generally speaking, the microstructure of eroded contacts is very sophisticated and cannot be explained by a simple interpretation of experimental results. Investigations of the Ag/ZnO corrosion mechanism can offer important information desired for their practical applications in low current apertures. However, mechanism of the erosion process for Ag/ZnO is still obscure to our knowledge.
Considering the above description, the objective of this work was to study the failure behavior of Ag/ZnO contact material though experimental and theoretical approaches. Two kinds of sizes of ZnO particles synthesized via different methods as the second phase for the preparation of Ag/ZnO electrical contact materials with diverse configuration were compared. Then both the influences of failure behavior on the structure and erosion mechanism of Ag/ZnO electrical contact material were concluded by x-ray diffraction (XRD) scanning electron microscopy (SEM) and energy dispersive spectroscopy (EDS), transmission electron microscopy (TEM), and X-ray photoelectron spectroscopy (XPS) experiments. In addition, fundamental systematic investigations of XPS on Ag/ZnO performed in this study were used to verify if it can serve as a tool for confirming the erosion behaviors during the arcing process.
II. EXPERIMENT METHODS
A. Materials and production processes
1. Preparation of ZnO powder
For a typical coprecipitation method, 2 g PEG2000 was dissolved in 50 mL 45 °C deionized water for 1 h to form a symmetrical solution firstly. 0.1 mol zinc acetate solution was dissolved in 50 mL deionized water, and then 80 mL NaOH (10 M) was added under continuous stirring. 30 min later, the final zinc acetate mixture was added dropwise into the above PEG2000 solution. Precipitation appeared when 40 mL glacial acetic acid was added. The precipitate was centrifuged and washed thrice with ethanol and deionized water, then dried at 80 °C. The result powder was sintered at 900 °C for 6 h for later usage and marked as ZnO(c). Another kind of ZnO powder was bought from Aladdin Industrial Inc. (Shanghai, China), which was prepared by ammonization method and marked as ZnO(a).
2. Preparation of Ag/ZnO contact material
Typical contacts were prepared by a powder metallurgy (PM) method. Silver powder was synthesized by chemical method with particle size ranged from 1 to 5 µm. Silver powder and two kinds of ZnO powders were firstly sieved through 100 meshes and 200 meshes separately, and then 88 wt% silver and 12 wt% ZnO powders were mixed into a reagent bottle for 4 h ball mill. Composite powders were compacted into billets with a diameter of 10 mm at 20 °C for pressing. The PM process was as followed: pressed with 600 MPa pressure, sintered at 600 °C, repressed with 800 MPa pressure, resintered at 800 °C. The final prepared specimens were marked as Ag/ZnO(c) and Ag/ZnO(a). Then they were processed into a cylinder (Φ 2.5 mm × 3 mm) by wire-electrode cutting for electrical life testing.
B. Characterizations
The bulk density of each sintered specimen was measured using the Archimedes' method with water as the immersion medium, while the relative density was estimated by the ratio of bulk value to theoretical value, which was calculated by the rule of mixture. All samples were smoothly polished using a diamond paste and ultrasonically cleaned. The morphology and elemental composition were characterized by field emission scanning electron microscopy (FE-SEM) (S-4800, Hitachi, Tokyo, Japan). The TEM and high-resolution transmission electron microscopy (HRTEM) analysis images were performed on a FEI Tecnai G2 F20 S-TWIN TEM (FEI Company, Hillsboro, Oregon) operating at an accelerating voltage of 200 kV. The sample for the TEM analysis was prepared by ultrasonic dispersion for 60 s with ethanol (4 mL) in a 5 mL centrifuge tube. Then, the products were dropped onto a carbon-coated copper grid and dried in air before TEM analysis. XRD analysis was performed to determine the crystalline phases in sintered contact materials using Cu Kα radiation. The scanning rate was 2°/min and the scanning angles ranged from 10° to 90° with a sampling width of 0.02°. The XPS spectra were recorded on ESCALAB 250Xi (Thermo Fisher Scientific, Waltham, Massachusetts) using Al Kα radiation as the x-ray source, operating at 12.5 kV and 20 mA under a vacuum pressure of 10−8 Pa. The analysis of the XPS spectra was performed using Casa XPS software (Casa Software Ltd, Teignmouth, UK). For the fitting spectrum, the background was subtracted from the spectrum by a Shirley mold and Gaussian (30%)–Lorentzian (70%) peak shape function was used to fit XPS spectrum. The conductivity was detected by a conductivity gauge D60K produced by Xiamen Xinbote Science & Technology Co Ltd. (Fujian, China). Metallographic examination was carried by GX40. Microhardness was measured by Vickers' indentation on polished sections with a load of 4.9 N and a dwell time of 15 s.
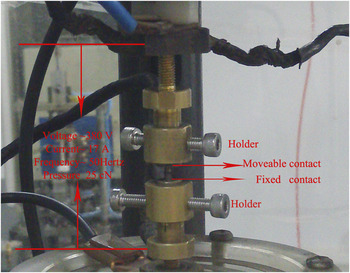
Electrical contact life testing was evaluated by an electrical life testing arrangement. The movable contact and the fixed contact (Φ 2.5 mm × 3 mm) with same materials fixed aligned vertically with the help of holders shown in Fig. 1. The test voltage was 380 V while test current was 17 A (AC) and the voltage frequency was 50 Hz. The direction of the current flow was alternated at every switching cycle. The contact pressure was 25 cN and the number of operations was 20,000. The breaking and making speed were both 1 × 10⁻³ m/s. An instantaneous arcing energy was calculated from voltage and current waveforms and then integrated to calculate total arc energy E a as follows;
 $${E_{\rm{a}}} = \sum\limits_{}^N {\left( {{i_{\rm{a}}} \times {v_{\rm{a}}} \times \Delta t} \right)} \quad ,$$
where i
a: arc current (A),
 ${v_{\rm{a}}}$
: arc voltage (V),
 $\Delta t$
: sampling interval (s), and N: total sampling number. N is a number of sampling from the arc beginning to the disappearance.
Photo of the experimental setup for electrical life testing.

III. RESULTS AND DISCUSSION
A. Characterizations of ZnO powders
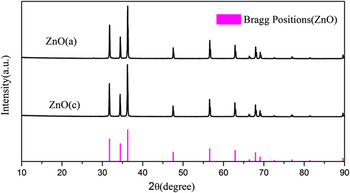
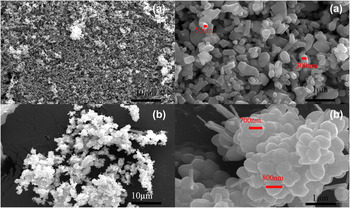
The structure, size, and shape of as-prepared ZnO powders have been investigated. Figure 2 presents XRD patterns of the second phase synthesized via different methods. Diffraction peaks of products indicate that both powders contain pure ZnO phase without any impurities. Figure 3 shows the FE-SEM micrograph of different ZnO powders. Compared with powder ZnO(a) [Fig. 3(a)], ZnO(c) has the similar morphology but consists of larger grains and some of ZnO nanorods [Fig. 3(b)].
XRD of ZnO powders.

SEM view of ZnO powders [(a) ZnO(a), (b) ZnO(c)].

B. Characterizations of Ag/ZnO electrical contact materials
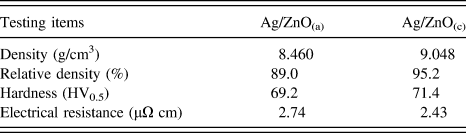
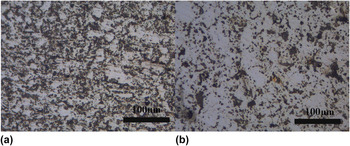
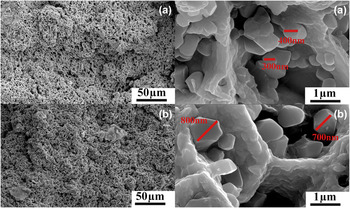
Mechanical and electrical properties of contacts are important technical parameters for the practical application. Table I shows physical properties of Ag/ZnO(a) and Ag/ZnO(c) composites. It can be seen that Ag/ZnO(c) has better properties with its higher hardness of 71.4 HV and relative density of 95.2%. Metallographic views of Ag/ZnO(a) and Ag/ZnO(c) are shown in Fig. 4. For Ag/ZnO(a), some ZnO strip embed in silver matrix. For Ag/ZnO(c), some speckles scatter in silver matrix. SEM views of cross sections of Ag/ZnO(a) and Ag/ZnO(c) are given in Fig. 5. It shows that ZnO grains distribute in porous silver matrix for both composites. The former ZnO(a) grain size ranged around 400 nm, which is different from the latter ZnO(c) with a size of 700 nm. Moreover, the size of ZnO(a) powder is so small that it can accumulate conveniently [Fig. 5(a)], which may deteriorate the sintering properties on the contrary.
Physical properties of Ag/ZnO investigated.

Metallographic view of Ag/ZnO [(a) Ag/ZnO(a), (b) Ag/ZnO(c)].

SEM view of the cross section of Ag/ZnO [(a) Ag/ZnO(a), (b) Ag/ZnO(c)].

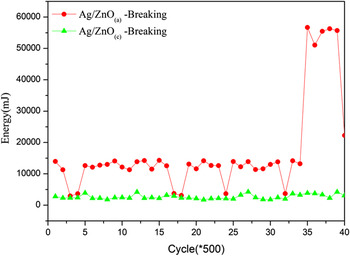
To better simulate the practical application progress, dynamic electrical contact properties obtained from electrical life testing are another technical parameters. Short arcs occur during bouncing. Reference Hadioui, Merdzan and Wilkinson28 At break, it is well known that arcing takes place after contacts rupture and the metallic phase and gaseous phase occurs for arcs. Reference Benjmeaa, Nedelec, Benhenda and Neveu44–Reference Morin, Benjmeaa, Jeannot and Sone47 Figure 6 shows typical arc energy at breaking state. It shows that the Ag/ZnO(c) has lower breaking arc energy and more concentrated distribution than those of Ag/ZnO(a) at the same load condition.
Energy of Ag/ZnO during the life testing.

C. Characterizations of compositions of Ag/ZnO electrical contact materials after the life testing
Contact has high arc energy as its surface condition becomes worse. Besides, it is conceivable that the life testing makes some irregularities on the surface under the same conditions for different materials. Investigations were done to provide further detailed information about the whole process.
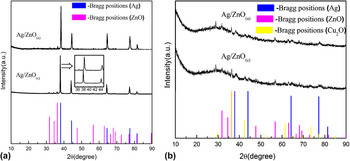
The XRD testing of the as-prepared samples before and after the life testing was performed and the corresponding XRD patterns are shown in Fig. 7. Three weak distinct peaks at 31.8°, 34.4°, and 36.3° observed in both patterns before the life testing represent (100), (002), and (101) crystal planes of ZnO oxides. It is assigned to pure wurtzite ZnO phase denoting P63mc space group (JCPDS No. 65-3411), just the same as the original ZnO powders. Those of 38.2°, 44.4°, 64.6°, and 77.5° can be indexed to fcc metallic Ag (JCPDS No. 04-0783). Peaks corresponding to AgO and Ag2O are not detected. Reference Waterhouse, Bowmaker and Metson48 Obviously, it is interesting to see that there is a slight shift of Ag diffraction peaks for the sample Ag/ZnO(c) before the life testing. It might be due to the formation of Zn1−x Ag x O solid solution, which may lead to the lattice shrinkage of Ag/ZnO nanocrystals.
XRD of the Ag/ZnO before and after the life testing [(a) before, (b) after].

However, phases of Ag/ZnO(a) and Ag/ZnO(c) after life testing appear to be mostly amorphous with some broad peaks centered at positions of around 31.71°, 36.32°, 38.2°, and 42.53° in 2θ. Positions around 31.71°, 36.32° probably correspond to the high intensity peaks of crystal line ZnO at 2θ positions of 31.8°, 34.4°, and 36.3°, representing (100), (002), and (101) crystal planes respectively. Besides, position around 38.2° probably corresponds to the high intensity peaks of crystal line Ag at 2θ position of 38.2° for the (111) crystal planes. At last, broad peaks at 2θ positions of around 31.71°, 36.32°, and 42.53° appear corresponding to positions of 29.58°, 36.44°, and 42.32° for Cu2O, representing (110), (111), and (200) crystal planes (JCPDS No. 05-0667). The existing Cu2O comes from holders which carry cylindrical contacts.
For comparison, a major difference between samples before and after the life testing is the phase state. Before the testing, samples are in good crystalline state, differing from the amorphous state after life testing largely. Besides, a new impure phase Cu2O is introduced.
D. Characterizations of morphologies of Ag/ZnO(a) after the life testing
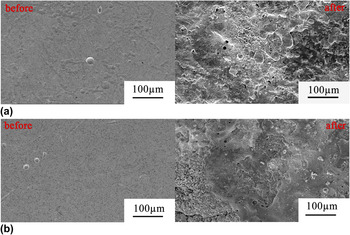
Ag/ZnO(a) and Ag/ZnO(c) samples before and after the life testing were further examined using SEM/EDS to identify the existing morphologies and to probe elemental partitioning within various zones. Figure 8 shows the morphology of the Ag/ZnO before and after life testing. After life testing, not only compositions and contents of samples have been changed which can be seen from the difference between Figs. 6 and 7, but also the morphology varies distinctly. Some serious molten surfaces occur in both samples because of arcing. Heavy molten areas appeared are loose zones with plenty of micro holes on the surface for both samples. Besides, there are serious liquid splashed zones and vaporization traces as well.
SEM view of the Ag/ZnO before and after the life testing [(a) Ag/ZnO(a), (b) Ag/ZnO(c)].

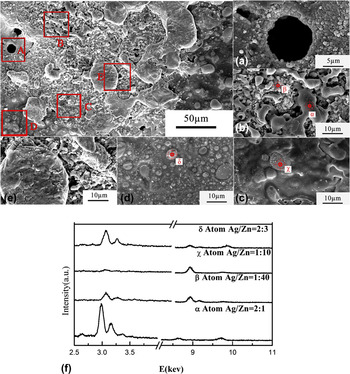
Figure 9 is magnified images of Fig. 8 from different areas. Some typical morphologies can be observed, Reference Ambier, Bourda, Jeannot, Pinard and Ramoni40–Reference Galinov and Luban42 such as holes [Fig. 9(A)], Ag enrichment zones, ZnO enrichment zones [Fig. 9(B)], Ag skeletons [Fig. 9(C)], bubbling areas [Fig. 9(D)] and the like. These phenomena are due to the arc combustion which generates lots of heat. During this process, surface components of the sample reacted and redistributed. Reference Hetzmannseder and Rieder10–Reference Rieder12
SEM and EDS view of the Ag/ZnO(a) after the life testing [(A) holes, (B) element enrichment region, (C) skeletal structure zone, (D) bubbling area, (E) reunite zone, and (F) EDS view from the corresponding zones].

From Fig. 9(A), it can also be seen that holes have walls coated with gathering oxide particles. Their shape and size vary considerably, and they are distributed practically throughout the entire melted zones (Fig. 8). Structures of the Figs. 9(B) and 9(C) are networks, which invade the melted area. There are also holes in these zones, which are smaller than the ones in Fig. 9(A). Especially, networks are intermittent in Fig. 9(B), they are divided into Zn enrichment regions [Fig. 9(F)-β] and Ag enrichment regions [Fig. 9(F)-α]. For Fig. 9(C), networks are almost complete, consisting of Ag base embedding with ZnO particles [Fig. 9(F)-χ]. Figure 9(D) shows that bubbles with shape and size varied considerably distribute practically throughout the entire melted zone. It shows that bubbles are composed of walls coated with oxide grains and middle parts fill with some silver. Their sizes vary from 1 to 30 µm in the entire melted zones.
E. Characterizations of morphologies of Ag/ZnO(c) after the life testing
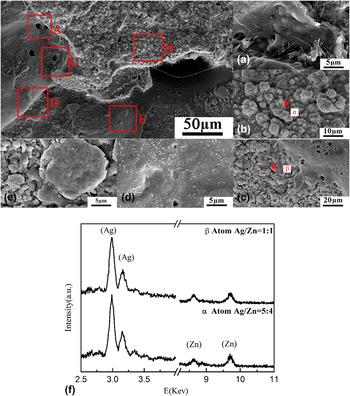
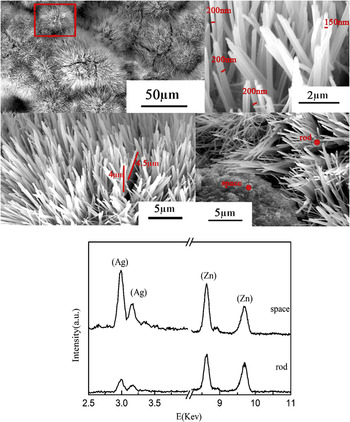
However, besides the normal morphologies mentioned above (Fig. 10), many clusters of rods enrichment zones come into being for Ag/ZnO(c) (Fig. 11). This phenomenon has never been reported before. For every separated single cluster, it can be found that diameters of these zones varied from about 100 nm to about 100 µm. As for a single rod, it can be seen that the rod have a uniform length and diameter, which are about 4 µm and 200 nm separately. From EDS spectrum, it can also be seen that, clusters of rods are mainly ZnO, and the blank place are mainly Ag.
Normal SEM view of the Ag/ZnO(c) after the life testing [(A) holes, (B) element enrichment region, (C) skeletal structure zone, (D) bubbling area, (E) reunite zone, and (F) EDS view from the corresponding zones].

Special SEM and EDS view of the Ag/ZnO(c) after the life testing.

To achieve a deeper insight into the structure and morphology of the synthesized ZnO rods, selected specimens were subjected to TEM and HRTEM analyses. The observed topological features are in agreement with results provided by FE-SEM investigation (compare Fig. 11) and confirm the formation of uniform nanorod arrays. The detailed microstructure of the ZnO nanorods is shown in Fig. 12. Green lines and arrows mark two lattice fringes, and the corresponding lattice spacing is about 0.52 nm, which is in good agreement with the d value of the (0001) facets of ZnO crystal. In the present case, it can be found that the preferential growth orientation of these ZnO nanorods is along the c-axis [0001] direction. A reasonable justification for the highly oriented growth of ZnO nanorods relies on the intrinsic polarization along the c-axis of the wurtzite structure, favoring the rod alignment in the direction of the applied electric field. Reference Bekermann, Gasparotto, Barreca, Bovo, Devi, Fischer, Lebedev, Maccato, Tondello and Tendeloo49
Special TEM view of the Ag/ZnO(c) after the life testing [(A) TEM image of the as-prepared ZnO nanorods, (B) HRTEM image of middle part of the individual ZnO nanorods, (C) HRTEM image of top part of the individual ZnO nanorods, and (D) HRTEM image of the product as shown in panel].

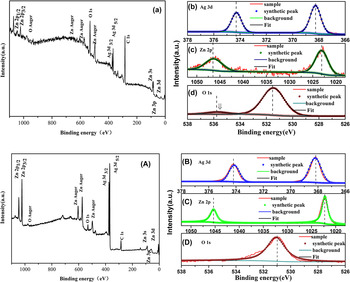
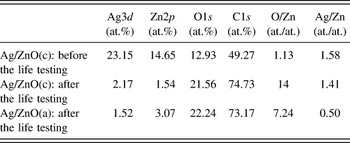
To confirm the composition of the final product, XPS analysis before and after the life testing was performed. Figure 13 shows the XPS data of the sample Ag/ZnO(c) before and after the life testing. The analysis depth of XPS is typically about 3–10 nm, which is suitable and powerful to investigate the influence of the chemical composition from the ultrathin surface. The shift of binding energy due to relative surface charging has been corrected using the C1s level at 284.6 eV as an internal standard. It can be seen that the binding energies of O1s, Agd5/2, Agd3/2, Zn3d, Zn3p, Zn3s, Zn2p3/2, and Zn2p1/2 are corresponding to 531.1, 367.9, 373.9, 32.1, 62.9, 87.7, 1022.4, and 1045.4 eV, respectively. For Zn2p, these spectra display a doublet at 1022.4 and 1045.4 eV [vertical dotted lines in Figs. 13(C) and 13(c)] corresponding to the Zn 2p3/2 and 2p1/2 core levels of ZnO. The binding energy of Ag 3d5/2 and Ag 3d3/2 peaks at 367.9 and 373.9 eV indicates existence of the pure Ag chemical state at the surface. From the XPS spectra strong O1s and C1s peaks around 531.5 and 285 eV after the life testing are observed. They come from ambient air contamination on the nanoparticle surface which is exposed to ambient air. Table II gives detailed information about atomic composition of Ag/ZnO before and after the life testing using XPS data. A quantitative estimation of the ratio O/Zn gives the values of 14 after life testing for Ag/ZnO(c), which is substantially higher than the initial value of 1.13. This is due to the adsorbed oxygen at the surface of the sample the arcing process. The value of metal Ag to metal Zn ratio can also be determined. It is 1.41, which is much lower than the beginning value of 1.58. The large excess ratio from expected values is partly due to the splash of Ag from the sample surface during the arcing process.
XPS data for Ag/ZnO(c) before [(A)–(D)] and after [(a)–(d)] the life testing [(a), (A) wide range of energy survey (b), (B), (c), (C), (d), and (D) high resolution energy survey for different elements].

Atomic composition of Ag/ZnO before and after the life testing.

The XPS data of the sample Ag/ZnO(a) after life testing has also been obtained. It has the same peaks as the above-mentioned sample. Comparatively analysis of the ratio of metal Ag to metal Zn, Ag/ZnO(a) has a much lower value of 0.50, which indicates that a more severe splashing of Ag phase has took place.
F. Electrical erosion mechanism of Ag/ZnO electrical contacts materials
As Swingler Reference Swingler and McBride50 pointed out that there are three stages of arc erosion including the metallic ion stage, the evaporation stage, and the liquid removal stage. Each is dominant at a particular supply current. Reference Kossowsky and Slade51,Reference Michal and Saeger52 During the heating process, the silver melts first. Reference Chang, Hsu, Hsu and Lin53,Reference Hsu, Chang, Chou and Lin54 Then the liquid silver absorbs a number of oxygen. Furthermore, the molten mass is agitated by the electromagnetic effect. Reference Zhu, Wang and Wang55,Reference Biyik, Arslan and Aydin56 As the temperature becomes higher, ZnO begins to decompose and atoms Zn and O come into being, which contributes to the material's microstructure rearrangement. The oxygen contained in the material may also arise from the initial porosity of the starting material since it can hardly discharge all the air during the pressing and sintering process. The oxygen that has dissolved into the silver during melting is another reason for the causation of oxygen.
The solidification which occurs afterward contains an air expulsion (mostly oxygen expulsion) process. Reference Gustafson and Kim5,Reference Wan, Zhang and Rong19,Reference Wang and Saka41,Reference Benjmeaa, Nedelec, Benhenda and Neveu44 When the pressure of the air is high enough, the surface of the material has been broken through and the holes come into being. Besides, the agitation under the Marangoni effect and natural convection can also lead to the splashing of material which results in the discontinuity surface and some large holes [Figs. 9(A) and 10(A)]. Reference Wang and Saka41 If the pressure referred before is below a certain value, the action of forces cannot break through the entire surface, the bubble entrapment then lead to bubbling areas [Figs. 9(D) and 10(D)]. Furthermore, the solidification contains structural rearrangement as well. Reference Chang, Hsu, Hsu and Lin53,Reference Hsu, Chang, Chou and Lin54 Since the poor wettability between Ag and ZnO and the probability of natural convection is not fast enough, the separation of the oxide and the liquid silver occurs, leading to the rearrangement of oxide grains in the shape of a more or less regular and ramified mesh with holes heavily coated with highly agglomerated oxide [Figs. 9(B), 9(C), 10(B), and 10(C)]. Reference Basak and Ghosh43
To explain the mechanism for the generation of nanorod clusters for erosion morphology of Ag/ZnO(c), the solid–vapor–solid mechanism is proposed which is similar to vapor–solid model and vapor–liquid–solid model conventionally used for the generation of ZnO nanorods. Reference Umar, Kim, Lee, Nahm and Hahn57–Reference Tak and Yong59 There are three stages that occurred during arcing. The dominant mass transfer mechanism is moveable contact evaporation and fixed contact condensation. The Zn atoms and O atoms are continuously evaporated from the surface of the Ag/ZnO electrical contact material during arcing. Besides, lots of O2 from the open air decomposes into O atoms. These O atoms are absorbed by Zn vapors and then react to form ZnO nuclei. As the reactant concentration increases, the ZnO nucleus individually grows in the upward [0001] direction in the form of nanorods in the direction of the applied electric field. All these processes take place in a short time. During the reaction process, holes, Zn, and O rich zones and any other morphology come into being because of the coarse surface and the nonuniform material.
However, the Ag/ZnO(a) does not show the same morphology of ZnO arrays. Regarding all processes, it is believed that the composition of beginning phases acts as an important role for the production of the nanorods. The Zn1−x Ag x O may offer better positions for the growth of ZnO rod. On the other hand, the generated energy may have an influence on surface condition. The high energy will damage the surface enormously and lead a more serious damage, which is not suitable for the existence of ZnO nuclei. That is to say, the growth of ZnO nanorods needs proper energy to meet the demand for both the existence of ZnO nuclei and the atoms' evaporation from the surface of the Ag/ZnO.
A more detailed investigation on the formation of the ZnO nanorods is currently in progress.
IV. CONCLUSIONS
Two kinds of Ag/ZnO electrical contact materials using ZnO synthesized by two different methods were successfully processed by PM method and their mechanical and electrical properties were tested. The erosion behavior of the contacts was also investigated by electrical life testing in detail. The microstructure and the composition formed during this process were investigated in depth. The conclusions were as follows. Firstly, the mechanical and electrical properties of Ag/ZnO(a) were significantly inferior to that of Ag/ZnO(c). Ag/ZnO(a) had a more severe splashing of Ag phase than that of Ag/ZnO(c). Secondly, corresponding phases of Ag/ZnO contacts have changed from the well-crystallized state to an amorphous state after the life testing. From surface profiles, obvious holes, Ag enrichment zones, ZnO enrichment zones, Ag skeletons, and bubbling areas were observed in both two eroded contacts. Thirdly, vertically aligned ZnO nanorod arrays were observed for the first time on the surfaces of eroded Ag/ZnO(c) contact after the life testing without any other supporting equipment. It can be found that nearly all rods had an average length of about 4–4.5 mm and diameter of about 150–200 nm. The preferential growth orientations of these ZnO nanorods were along the c-axis [0001] direction. It may be caused by both the existence of a solid solution Zn1−x Ag x O and different energy generated during arcing process. Lastly, XPS analysis was used as a tool to predict the relative degree of Ag splashing for the first time. It has the potential to serve as an index for evaluate the antiarc property for Ag/ZnO practical applications in low current apertures in the future.
ACKNOWLEDGMENTS
This work was supported by the National High-Tech Research and Development Program of China (863 Program) (No. 2013AA031803) and Special Fund for Postdoctor of Zhejiang Province, China.