INTRODUCTION
Altitudinal gradients provide an attractive setting for biodiversity research because they offer the potential to test hypotheses of global processes at local scales (Rahbek Reference RAHBEK2005). The altitude–richness relationship is influenced by a number of factors including taxonomy (Goodman & Rasolonandrasana Reference GOODMAN and RASOLONANDRASANA2001, Graham Reference GRAHAM1990), scale (Colwell & Lees Reference COLWELL and LEES2000, McCain Reference MCCAIN2007a, Romdal & Grytnes Reference ROMDAL and GRYTNES2007) and evolutionary history (Smith et al. Reference SMITH, NIETO MONTES DE OCA, REEDER and WIENS2007), and varies both spatially and temporally through seasonal and climatic change (Grytnes & McCain Reference GRYTNES, MCCAIN and Levin2007, Sánchez-Cordero Reference SÁNCHEZ-CORDERO2001). There is a general recognition of three predominant patterns: declining species richness with altitude (declining); a low plateau where richness remains high until the mid-altitudes before declining (low plateau); and a mid-altitude peak in species richness (midpeak) (Grytnes & McCain Reference GRYTNES, MCCAIN and Levin2007).
A global meta-analysis for bats (Chiroptera) demonstrated the presence of all three such patterns, apparently dependent on an interplay between temperature and water availability as determined by the surrounding regional climate (approximated by latitude) of the mountain in question (McCain Reference MCCAIN2007b). On mountains with arid lowlands, the peak in species richness is predicted to occur at mid-altitudes, where a unimodal water-availability gradient reaches a maximum while temperatures are still relatively high. Where water is not a limiting factor, as in the humid tropics, richness peaks at low altitudes where temperatures are highest. Such large-scale meta-studies are extremely useful for characterizing broad-scale patterns and untangling the causal factors that create them. Yet adequate geographic representation is an important factor, hence it is worth noting that the meta-analysis of McCain (Reference MCCAIN2007b) lacked data from the African continent. In terms of biodiversity patterns and overall levels of species richness of bats and many other groups, Africa appears to stand as the ‘odd man out’ because of its unique geological and climatic history (Findley & Wilson Reference FINDLEY and WILSON1983, Meggers et al. Reference MEGGERS, AYENSU and DUCKWORTH1973; but see Fahr & Kalko Reference FAHR and KALKO2011). This presents an interesting opportunity to test a model that was largely developed using data from Asia and the Americas on a different continent.
To our knowledge, bat diversity along an altitudinal gradient has not yet been studied systematically in Africa. In this paper, we present novel data from Mount Mulanje, southern Malawi, a region surveyed poorly for bats in the past (Happold & Happold Reference HAPPOLD and HAPPOLD1997, Happold et al. Reference HAPPOLD, HAPPOLD and HILL1987). We use these data to test the predictions generated by the climatic model of McCain (Reference MCCAIN2007b), which estimates a peak in species richness at c. 1000 m on Mt. Mulanje according to its latitudinal position.
STUDY AREA
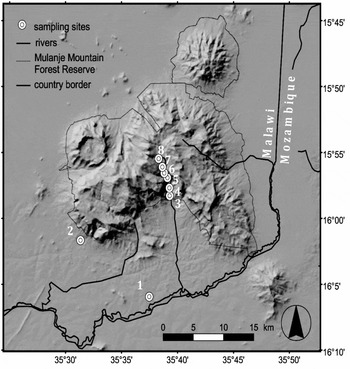
Mount Mulanje represents Malawi's only UNESCO Biosphere Reserve. It rises from a relatively featureless plain to 3002 m asl, covering an area of roughly 650 km2 at 15°50′–16°03′S, 35°30′–35°47′E (Figure 1). The mountain contains a remarkable variety of habitats that support many rare, threatened and endemic species, which include the endemic Mulanje cedar, Widdringtonia whytei Rendle, a critically endangered flagship species (Bayliss et al. Reference BAYLISS, MAKUNGWA, HECHT, NANGOMA and BRUESSOW2007). The montane forests are part of a National Forest Reserve, but in response to growing rates of deforestation and illegal encroachment, reserve boundaries have been constricted five times since their delineation in 1927 (Bouvier Reference BOUVIER2006; available at http://www.joyhecht.net/mulanje/refs/Bouvier-Ioana.Mulanje.LC.TimeSeries.2006.pdf). This period has witnessed a near-total loss of lowland forests (replaced by agricultural land, including tea, Acacia and Eucalyptus plantations) and large reductions in the extent of mid-altitude forest (between 1972 and 2002, submontane and montane forest has declined at a rate of 0.5% y−1; Bouvier Reference BOUVIER2006).
Shaded relief map of the study area with locations of sampling sites.

Climate
Rainfall regimes on Mount Mulanje typically show a peak from November to April where many seasonal streams and rivers become active and flash floods are common after heavy storms. Average annual precipitation (rainfall records 1969–1978) is 1725 mm in the lowland, rising to 2425 mm at the entrance to the Ruo Gorge where mid-altitude vegetation starts (900 m), and increasing further to 3108 mm on the Lichenya Plateau west of our gradient (1850 m; Dowsett-Lemaire Reference DOWSETT-LEMAIRE1988). A large proportion of this precipitation (17–21%) arrives during the dry season (May–September) in the form of mist, drizzle and occasional showers brought by moist maritime air from the Mozambique Channel to the high plateaux and steep slopes. Mean annual temperatures are 22.6 °C at the lowland site (630 m), 15–19 °C at altitudes of 1400–1800 m and dropping to 13–15 °C on the high plateaux above 2000 m (Dowsett-Lemaire Reference DOWSETT-LEMAIRE1988).
Sampling sites
We studied bat diversity along a transect consisting of eight sampling sites spanning 1380 m altitude. This covered roughly 55% of the altitudinal gradient on Mount Mulanje, which extends from lowland plains undulating at 500–600 m to the peak of the mountain at 3002 m. Only 5% of the gradient were unrepresented at lower altitudes while about 40% were unrepresented at the top of the gradient. Six sampling sites were located within evergreen mid-altitude and high-altitude forest in the Ruo Gorge (sites 3–8) as well as two spatially detached sites in the last areas of lowland forest at the mountain base (site 1, located 14.6 km SSW of the gorge entrance, and site 2, located 10 km W of the gorge entrance; Figure 1). Forest classification was adopted from Dowsett-Lemaire (Reference DOWSETT-LEMAIRE1988) and Chapman (Reference CHAPMAN1962). The mountain's southern aspect originally supported a lush cover of semi-deciduous lowland forest extending from the base of the mountain at 600 m to roughly 950 m. In contrast, the dominant habitat type in the surrounding plains is miombo woodland interspersed with gallery forests. The historical extent of lowland forest is unknown, but is believed to have bridged the gap between Mount Mulanje and Mount Mchese (south-east of Mount Mulanje in Figure 1), which would have encompassed sample sites 1 (630 m) and 2 (720 m) (Chapman Reference CHAPMAN1962, Dowsett-Lemair Reference DOWSETT-LEMAIRE1988). Mid-altitude forest (900–1500 m) makes up a largely continuous block within the Ruo Gorge, encompassing sample sites 3 (900 m), 4 (1030 m), 5 (1220 m) and 6 (1330 m). Higher-altitude forest is divided into submontane (ranging from 1500–1850 m) and montane forest (up to 2100 m). Much of the forest above 1600 m is dominated by the Mulanje cedar. Site 7 (1850 m) was situated in the transition between submontane and montane forest, and site 8 (2010 m) was located on the plateau in a habitat composed of montane forest–grassland mosaic.
METHODS
Bat sampling
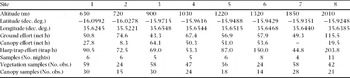
Sampling took place between September and December of 2007, and again in November and December of 2008. This period largely marks the transition between the dry and wet season. Each site along the altitudinal gradient was visited before and after the first rains for variable numbers of sampling nights depending on the cumulative capture success. We aimed to obtain similar numbers of individuals for site comparisons (i.e. equalizing sampling success, rather than effort), therefore the number of sample nights varied per site (Table 1). Multiple sampling techniques were employed at each site. At each site we used between four and six ground nets and one canopy net (Vohwinkel, Germany: size 6 × 3 m and 9 × 3 m, respectively; five-shelved nylon nets, 16-mm mesh, 70 denier/2-ply netting). The canopy net consisted of two to four vertically stacked nets raised to a height of c. 12 m above ground at the top shelf. Additionally, we employed two four-bank, custom-built harp traps (1.5 × 1.5-m sampling area; M. Obrist, WSL, Switzerland and D. Pio, University of Lausanne, Switzerland). Nets and traps were placed opportunistically across fly-ways such as paths, rivers and habitat edges (Kunz et al. Reference KUNZ, HODGKISON, WEISE, Kunz and Parsons2009), and opened from sunset until midnight or later depending on activity levels and weather. Average opening time for ground nets was 4.3 h. At least one harp trap was left open until sunrise on almost all sampling nights (weather permitting). Canopy nets were used on only 28 of the 51 nights of sampling, and this included at least one night of sampling at every site except site 7 (1850 m, Table 1). For this reason (and because of low capture success) the site was removed from the analysis.
Sampling effort and locality information across sampling sites. One net/trap h equals the equivalent of one 6-m net/trap open for 1 h; obs. = observations. Data from site 7 (1850 m) were excluded from most analyses.

Standard external measurements (forearm and body mass) were taken for all captured bats, with additional measurements (tail length, head length, ear length, tragus length, horseshoe width, hind foot length and tibia length) taken from a representative sample of individuals of each species. Captures were also checked for sex and reproductive status. Field identification was based on Hayman & Hill (Reference HAYMAN, HILL, Meester and Setzer1971) and Bergmans (Reference BERGMANS1997). Between two and seven voucher specimens were taken from all species except Eidolon helvum (Kerr 1792), Miniopterus sp. 1 (cf. minor Peters 1867) and Rhinolophus hildebrandtii Peters 1878. Voucher specimens were preserved in 70% ethanol and deposited in the Museum of Natural History, Geneva (MHNG), the National Museums of Malawi (MoM) and the Transvaal Museum Pretoria. Field IDs were confirmed by comparing external and cranial measurements as well as qualitative characters of the voucher specimens with those of reference specimens in MHNG, The Natural History Museum, London, Senckenberg Museum Frankfurt and reference collection of JF at the University of Braunschweig. Reference echolocation calls and molecular analysis of tissue samples and wing punches from subsequently released individuals provided additional support for some species (B. Appleton, unpubl. data for Miniopterus spp. using mitochondrial genes ND2 and cytochrome b). Because the taxonomy of African Miniopterus requires further revision (Miller-Butterworth et al. Reference MILLER-BUTTERWORTH, EICK, JACOBS, SCHOEMAN and HARLEY2005), the species recorded in this study are referred to as sp. 1–4, with likely affiliations to known species given in parentheses. Taxonomy follows Simmons (Reference SIMMONS, Wilson and Reeder2005) unless otherwise stated.
Analysis of species diversity
Species richness estimators were employed at each site following the selection framework of Brose & Martinez (Reference BROSE and MARTINEZ2004). First, a range of species estimation values (Sest) was calculated by using a number of abundance- and incidence-based estimators (those included in EstimateS, with the addition of abundance-based variants of Jack-knife 1, 2 and 3). This range was then compared with observed species richness (Sobs) to estimate sample completeness. Sample completeness at each site determines the optimal estimator to use (Brose & Martinez Reference BROSE and MARTINEZ2004). The sample unit was a single night of sampling (pooling data from harp traps, ground and canopy nets) and sample size (n) ranged from four to 11. One hundred randomizations of sampling order (without replacement) were carried out for each site to derive confidence intervals. The programs SPADE version 3.1 (Species Prediction and Diversity Estimation, available at http://chao.stat.nthu.edu.tw) and EstimateS (EstimateS program and user's guide available at http://purl.oclc.org/estimateshttp://purl.oclc.org/estimates) were used to calculate species richness with different estimators.
Fisher's α values for each site were calculated using the computer program Species Diversity and Richness (PISCES Conservation Ltd., Lymington, UK). All sites were tested for deviation from the log-series distribution (no significant deviations, P > 0.05). The bias-corrected form of Shannon's entropy (Chao & Shen Reference CHAO and SHEN2003) was also calculated for all sites and transformed into the effective number of species (eH), also termed diversity of order one (Jost Reference JOST2006), using the software SPADE. Because eH and Fisher's α showed similar results, only Fisher's α was analysed further. Statistical tests were carried out using the software R version 2.7.1 (http://www.r-project.org) and Spatial Analysis in Macroecology (SAM) version 4 (Rangel et al. Reference RANGEL, DINIZ FILHO and BINI2010).
Data biases and artefacts caused by sample incompleteness are a major concern in ecological field studies (Gotelli & Colwell Reference GOTELLI and COLWELL2001). We investigated undersampling bias in our dataset by inspecting smoothed species accumulation curves (SACs) and tested for relationships between diversity measures (observed and estimated species richness, Fisher's α) and proxies of sampling intensity (number of nights, abundance of individuals, number of ground and canopy net hours, number of trap hours and total sampling hours). We analysed estimator precision by plotting estimated species richness against the number of samples (Walther & Moore Reference WALTHER and MOORE2005). Stable estimator values when adding the last two samples were assumed to indicate adequate precision.
We also analysed patterns in assemblage turnover (ß-diversity) using the Chord-Normalized Expected Species Shared index (CNESS; Trueblood et al. Reference TRUEBLOOD, GALLAGHER and GOULD1994), calculated using the program COMPAH96 (Combinatorial Polythetic Agglomerative Hierarchical Clustering, available at http://alpha.es.umb.edu/faculty/edg/files/edgwebp.htm). We produced a distance matrix that was subject to non-metric multidimensional scaling (NMDS) using the program PRIMER (Vers. 5, Plymouth, UK).
Measurements of vegetation density and canopy cover for a single sample site were respectively pooled and the frequency of each class was expressed as a percentage of all measurement points. These data were then standardized (value minus gradient mean and divided by gradient standard deviation) and entered into a principal component analysis (PCA), producing a (Euclidian) distance matrix of habitat dissimilarity between sites. We assessed whether variation in species turnover was correlated with habitat dissimilarity through a partial Mantel test (using the vegan package in R). The Partial Mantel test controls for a third variable, in this case geographic distance between sites (Legendre et al. Reference LEGENDRE, BORCARD and PERES-NETO2005).
Explanatory environmental variables
At each sample site, indices of vegetation density and canopy cover were subjectively estimated by the same observer using criteria described below. Horizontal vegetation density was assessed around each netting and trapping position (on both sides of the net/trap, and on both sides of the fly way c. 10 m ahead and behind the net/trap, giving six measurement points per net/trap position). Values were discrete and ranged between 1 and 3 (1 = uncluttered and background clutter, 2 = intermediate clutter, 3 = dense clutter). The classification scheme deviates slightly from that of Schnitzler & Kalko (Reference SCHNITZLER and KALKO2001) because totally uncluttered habitat was rare in our transects. In this study, uncluttered and background clutter was considered to be open ground or very sparsely vegetated areas, with distance between neighbouring trees at breast height, or distance to edge habitat, generally greater than 5 m. Intermediate clutter was characterized by distances between neighbouring trees at breast height, or proximity to edge, generally between 2 and 5 m with sparse understorey vegetation. Cluttered habitat was characterized by distances between neighbouring trees at breast height less than 2 m and dense understorey vegetation. Canopy cover was assessed on a six-point scale in 20%-cover steps (0 = open to 5 = 80–100%) based on the field of view directly above a net position and two points 10 m in front and behind the net, giving a total of three measurements points per net position (see Table 1 for number of observations per site).
We used the mean score of the two measures at each site to quantify changes in vegetation density and canopy cover along the gradient. We used the standard deviation of the two measures at each site to quantify changes in vegetation heterogeneity and canopy heterogeneity along the gradient. Site values for each of these four measures were then standardized by expressing them as a negative or positive standard deviation from the gradient mean. We also summed the standardized values at each site (i.e. vegetation density + canopy cover and vegetation heterogeneity + canopy heterogeneity) to obtain combined estimates of overall habitat structure and heterogeneity, respectively. Each of these measures was then tested for a univariate correlation with bat diversity using linear regression. We also assessed whether the variation in species turnover was correlated with habitat dissimilarity between sites through a partial Mantel test (vegan package in R), using geographic distance between sites as an additional variable (Appendix 1).
In addition to measures of habitat structure, we developed a series of environmental variables representing several factors known to play a role in altitude–diversity relationships. These were average nightly temperature and relative humidity at the time of sampling, mean annual temperature, mean annual relative humidity, total and forested area within 100-m altitudinal bands centred around each sampling site, and the Normalized Difference Vegetation Index (NDVI) as a proxy for productivity. Because the low number of sampling sites prevented application of a multivariate approach to elucidate the role of these predictors, such as stepwise multiple regression (Sanders et al. Reference SANDERS, LESSARD, FITZPATRICK and DUNN2007), we tested each predictor for a univariate correlation with diversity using simple linear regression. Additional information pertaining to the study, including a detailed account of the methodology used to derive these additional variables, can be found at http://sites.google.com/site/jakobfahr.
RESULTS
Sampling summary
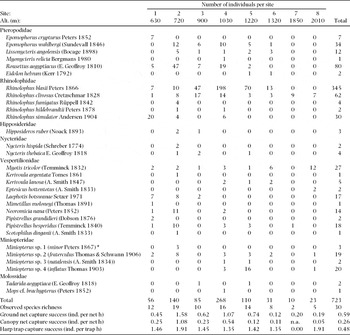
A total of 51 sampling nights across eight sites yielded 723 individuals, which comprised 30 species, 19 genera and seven families (Tables 1 and 2). We captured additional individuals, and one extra species, Myotis welwitschii (Gray 1866), during opportunistic sampling at various localities. Sampling effort differed markedly across sites (Table 1), as did the number of captured individuals and overall capture success (Table 2). Overall capture success, measured as the number of individuals captured per ground net, canopy net and trap h, also differed across sites. Fruit bat captures were biased towards canopy nets with a ratio of canopy to ground net capture success of 1.1–8.8, with the highest values at sites 3 (ratio = 8.8) and 4 (ratio = 5.7). In animalivorous bats, the trend was reversed with capture success always heavily biased towards ground nets (C:G ratio of 0.03–0.228).
Individuals per species and site along the altitudinal gradient, including total captures. * = specific status assigned based on very small forearm length and echolocation calls distinct from other Miniopterus species. One additional species, Myotis welwitschii, was captured during opportunistic sampling and is not included in this table.

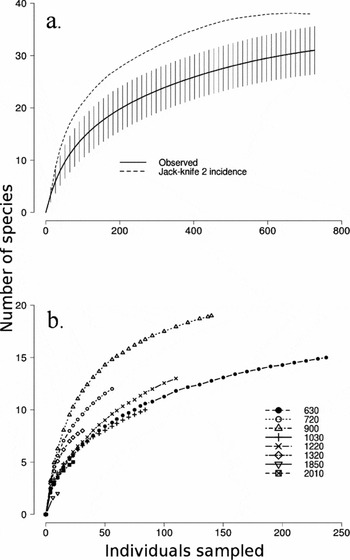
A smoothed species accumulation curve for our entire dataset (i.e. all sites pooled, including additional sites not included in the analysis) appeared to level off, indicating that a large proportion of the regional species pool had been sampled (Figure 2a). Observed SACs at the site level showed varying degrees of completeness. Three sites (630 m, 1320 m and 2010 m) were clearly in a stage of accumulation, a further two sites (900 m and 1220 m) approached an inflection point, and only two sites (720 m and 1030 m) showed signs of levelling off (Figure 2b). Precision of estimators was satisfactory at almost all sites, with only one site (1220 m) showing signs of imprecision (data not shown). Sobs was significantly and positively correlated to the number of individuals (n = 7, r2 = 0.81, P < 0.01). Employing species richness estimators weakened this correlation, but the relationship remained significant (n = 7, r2 = 0.74, P < 0.05). Fisher's α was not significantly correlated to any measures of sampling effort. Appendix 1 contains a summary of all regression parameters.
Smoothed species accumulation curves (SACs) for pooled data from all sampling sites (a), which includes additional opportunistic captures from sites not included in the analysis, and separately for all sampling sites (b). Vertical lines around observed species richness curve (a) represent upper and lower 95% confidence intervals, dotted line represents estimated species richness (Jack-knife 2).

Species diversity along the gradient
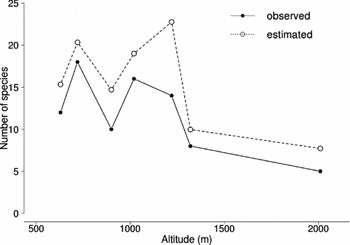
Estimated species richness (Sest) followed a low-plateau pattern with richness remaining comparably high until the mid-altitudes (peaking at c. 1220 m), before decreasing thereafter (Figure 3). In order to investigate if the pattern was driven by the diversity of fruit bats in the mid-altitudes (where the highest species richness of Pteropodidae occurred), a second analysis was performed including only animalivorous species. Although less pronounced, the shape of the pattern remained the same, but the peak shifted to 720 m (data not shown). Fisher's α declined with altitude (data not shown), and this relationship was significant even when accounting for spatial non-independence of samples (Dutilleul's method, software SAM v 4: n = 7, r = −0.811, Fcorr = 8.1, dfcorr = 4.2, P = 0.044).
Changes in observed (solid line, filled circles) and estimated species richness (dotted line, open circles) with altitude.

Non-metric multidimensional scaling (NMDS) of the CNESS dissimilarity matrix resulted in a two-dimensional ordination plot (two-dimensional stress value 0.003; data not shown). When the order of sites is considered, separation along the x-axis mirrored changes in altitude. Habitat dissimilarity between sites was significantly correlated to variation in assemblage dissimilarity, even after correcting for geographic distance (partial Mantel test; R = 0.71, P < 0.01).
Environmental correlates of local diversity
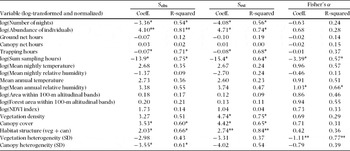
Sest was significantly correlated with vegetation density (n = 7, r2 = 0.75, P < 0.05), canopy cover (n = 7, r2 = 0.65, P < 0.05) and combined habitat structure (n = 7, r2 = 0.84, P < 0.01). Sest was further negatively correlated with combined habitat heterogeneity (n = 7, r2 = 0.73, P < 0.05), but not to vegetation heterogeneity or canopy heterogeneity alone (Appendix 1). We did not detect any strong or significant correlations between Sest and the additional environmental variables (r2 values ranging 0.04–0.47, the latter with mean annual relative humidity). Fisher's α was strongly, but negatively, correlated to vegetation heterogeneity (n = 7, r2 = 0.77, P < 0.01) and combined habitat heterogeneity (n = 7, r2 = 0.92, P < 0.001). It was also correlated to mean annual relative humidity (n = 7, r2 = 0.66, P < 0.05). Although we did not account for covariances among predictors using a multivariate approach, we did assess the degree of covariance between predictors by regressing them against altitude. In particular, altitude was negatively and significantly correlated to mean annual temperature (n = 7, r2 = 0.87, P < 0.001), mean annual relative humidity (n = 7, r2 = 0.95, P < 0.001), NDVI (n = 7, r2 = 0.63, P < 0.05) and canopy cover (n = 7, r2 = 0.61, P < 0.05).
Climate model of McCain
We tested whether our findings fit the climate model proposed by McCain (Reference MCCAIN2007b), which postulated that the species richness peak of bats along altitudinal gradients is a function of regional climate approximated by latitude. According to the geographic position of Mount Mulanje (15.96°S), the climate model predicts a peak at c. 1000 m asl. Our analysis revealed a peak at 1220 m for estimated species richness (Figure 3), which preserved the significance and explanatory power of McCain's climate model, when re-analysed with our data included (n = 13, r2 = 0.44, P = 0.012). When only animalivorous species were analysed, the peak in richness in our study shifted to 720 m. Again, this supports the climate model, which predicts a richness peak for animalivorous bats at c. 700 m (McCain Reference MCCAIN2007b, Figure 3c). Likewise, combining our results with the global dataset did not affect the model (n = 12, r2 = 0.58, P = 0.003). However, the shift in the peak in richness for animalivorous bats compared with all bat species relied on negligible changes in estimated species richness (14.9 species at 720 m against 14.5 species at 1220 m).
DISCUSSION
Implications for the altitude–diversity relationship
The paucity of sampling sites in our study prevented a multivariate treatment of our explanatory data (predictors) therefore we conducted a series of linear regressions with predictors and diversity measures. Because each variable was standardized before analysis, regression parameters could be directly compared across predictors. Yet because of the considerable collinearity across predictors (e.g. altitude was significantly correlated to temperature, humidity, NDVI and canopy cover), inferences are highly limited. In general, predictors related to habitat structure measured in the field (e.g. vegetation density, canopy cover, habitat heterogeneity) had high model-fit values (i.e. r2 values ranging 0.65–0.84). In contrast, model-fit statistics for the additional climatic and geometric variables were comparatively low (r2 = 0.04–0.47), the strongest of which was a negative relationship with mean annual relative humidity.
In terms of rigorously testing the various hypotheses proposed to explain altitude-diversity relationships, our data are largely inadequate, but some general conclusions arise. It is likely that the small sampling grain of our study shifted importance from overarching climatic and geometric influences to small-scale variation in biotic factors embodied in our proxies of habitat structure. Spatial grain is known to affect the form and mechanisms underlying many diversity gradients (Rahbek Reference RAHBEK2005), particularly area, which is more influential at larger sampling grains (Romdal & Grytnes Reference ROMDAL and GRYTNES2007, Sanders Reference SANDERS2002). This may explain the lack of a strong effect in our data. We did not investigate the mid-domain effect (MDE) because we deemed our sampling data insufficient to reconstruct species’ altitudinal ranges, and because of the lack of theoretical support for the MDE concept (Hawkins et al. Reference HAWKINS, DINIZ-FILHO and WEIS2005). Of the climatic variables, annual relative humidity showed the strongest relationship with estimated species richness, and the relationship with Fisher's α was significant. According to the climate model of McCain (Reference MCCAIN2007b), richness is expected to peak on mountains with a dry base where a unimodal water availability gradient intersects with a declining temperature gradient. In our study, both temperature and humidity declined with altitude, indicating that we did not sample low enough (or outside of the mountain's rain shadow) to detect significant limits to water availability. This is likely due to the fact that Mount Mulanje itself rises from an undulating plateau at 500–600 m, with further declines in altitude occurring over much larger distances than contained within our gradient.
Predictors related to habitat structure were strongly correlated with our richness data, indicating some form of biotic mechanism influencing the altitude–diversity relationship (Graham Reference GRAHAM1990, Sánchez-Cordero Reference SÁNCHEZ-CORDERO2001, Terborgh Reference TERBORGH1977). Our simple measure of habitat heterogeneity was negatively correlated to both estimated species richness and Fisher's α. Since the latter exhibited a stronger (and highly significant) relationship, it indicates that uniformity in understorey vegetation and a canopy cover influence both species richness and the distribution of individuals between species (i.e. evenness), thereby increasing Fisher's α relative to Sest. At the same time, habitat heterogeneity explained a significant degree of species compositional change between sites, potentially leading to increased gamma diversity at the landscape scale (Fahr & Kalko Reference FAHR and KALKO2011).
Potential sources of bias
Species accumulation curves (SACs) indicated observed species inventories were incomplete at numerous sites, yet only one metric of sampling effort, abundance of individuals, was positively and significantly correlated to Sobs. Applying richness estimators weakened the correlation but it remained significant, indicating that either undersampling bias remained in Sest or the relationship was driven by alternative (environmental) factors, such as productivity (Beck et al. Reference BECK, BREHM and FIEDLER2011). While we did not have data available to investigate this further, we favour the latter explanation because (1) we found negative relationships with other measures of sampling effort (i.e. number of nights, trapping and total sampling hours), (2) our assessment of estimator precision was generally positive, and (3) simulation studies have shown that species richness estimators perform reliably at the level of sampling intensity of our least-surveyed site (five samples; Walther & Moore Reference WALTHER and MOORE2005). Fisher's α has also been shown to perform well at low to medium sampling intensities (Beck & Schwanghart Reference BECK and SCHWANGHART2010, Fisher et al. Reference FISHER, CORBET and WILLIAMS1943, Hurlbert Reference HURLBERT1971), and showed no significant relationship with any proxy of sampling effort. Some authors (Sanders et al. Reference SANDERS, LESSARD, FITZPATRICK and DUNN2007) have used Fisher's α as a direct proxy for species richness because of its robustness to undersampling, but we avoided this because the two indices measure different properties of diversity, and Fisher's α may be misleading where samples approach completeness (Beck & Schwanghart Reference BECK and SCHWANGHART2010).
A second potential criticism of our study is that we did not assess or account for the effects of anthropogenic disturbance, which acted at variable intensities along the gradient, including the widespread clearance of lowland forest, small-scale degradation of low- and mid-altitude forests, and man-made fires at the top of the gradient (see Bayliss et al. Reference BAYLISS, MAKUNGWA, HECHT, NANGOMA and BRUESSOW2007 for an account of the anthropogenic threats facing Mount Mulanje). While anthropogenic disturbance is known to exert a strong influence on the composition and abundance of local bat assemblages (Racey & Entwistle Reference RACEY, ENTWISTLE, Kunz and Fenton2003), we did not collect data on the type of disturbance and its intensity along the gradient, and thus cannot assess its influence on our results. Finally, we lacked comprehensive seasonal representation, sampling each site at the end of the dry season and in beginning of the wet season. We acknowledge that additional data from other times in the year may potentially alter the observed pattern (Beck et al. Reference BECK, ALTERMATT, HAGMANN and LANG2010, Sánchez-Cordero Reference SÁNCHEZ-CORDERO2001).
Conservation relevance
The predictive ability of the climate model (McCain Reference MCCAIN2007b) is impressive, and potentially valuable for conservation assessments of poorly surveyed mountain areas. However, further testing across a range of representative gradients is recommended, particularly within the unique geological and climatic context of the African continent, for which our study is the first. Coastal and montane forests across East and Southern Africa are known to be important centres of bat diversity and endemism (Cockle et al. Reference COCKLE, KOCK, STUBLEFIELD, HOWELL and BURGESS1998, Kock et al. Reference KOCK, CSORBA and HOWELL2000, Monadjem et al. Reference MONADJEM, SCHOEMAN, RESIDE, PIO, STOFFBERG, BAYLISS, COTTERILL, CURRAN, KOPP and TAYLOR2010). We recorded important distributional records of forest-associated species such as Myonycteris relicta and Lissonycteris angolensis, for which isolated montane forests likely constitute important regional stepping stones of habitat.
Mount Mulanje appears to be an important centre of diversity for bats at both a national and regional scale, harbouring a significant portion of Malawi's bat diversity. Our results indicate that future conservation efforts should continue to focus on the strict protection of mid-altitude forest while aiming to increase lowland forest cover around the base of the mountain.
ACKNOWLEDGEMENTS
We express our appreciation to the National Geographic Society/Waitts Institute for Discovery (grant number W37–08), the Josef und Olga Tomcsik-Stiftung, the Freiwillige Akademische Gesellschaft Basel and the Swiss Academy of Sciences for funding. We also thank the National Research Council of Malawi and the Department of Forestry (permit numbers TC/14/2/2007/01 and 6/5/2005/3, respectively), the National Museums of Malawi and the Mulanje Mountain Conservation Trust. We are grateful to Julian Bayliss, Dorothea Pio and Blessings Walawala, Teresa Kearney and Earnest Seamark for assistance and advice. Peter Nagel supervised the research at Basel University. Manuel Ruedi and the technical staff at MHNG prepared the voucher specimens. The World Bat Library (Muséum Histoire Naturelle de Genève) provided access to some literature.
Simple linear regression applied to a range of variables relating to sample completeness and environment, with most data log-transformed to conform to a normal distribution (except temperature which was already normally distributed). Observed and estimated species richness was also log-transformed for regressions with area variables. Environmental variables were further normalized by subtracting the gradient mean and dividing by the standard deviation (SD). Data on mean annual temperature and relative humidity were created by interpolating weather station data using the commercial software MeteoNorm (http://www.meteonorm.com). Altitudinal area band figures were calculated using a GIS (Geographic Resource Analysis Support System, ver. 6.4.1; grass.fbk.eu/) and the SRTM 90 m resolution digital elevation model (www2.jpl.nasa.gov/srtm/). Forest area was approximated using categories 40 through 100 of the ESA Globecover 2009 landcover dataset (www.esa.int). A Normalized Difference Vegetation Index was computed using bands 3 and 4 from an orthorectified Landsat ETM+ image (available at www.landsat.org), acquired on 9 July 2002. Further information is available at http://sites.google.com/site/jakobfahr. * = P < 0.05, ** = P < 0.01, *** = P < 0.001.