I. INTRODUCTION
Carbon black has for a long time served as electrocatalyst support for porous electrodes in fuel cells and metal–air batteries.Reference Newman and Tiedemann1–Reference Débart, Bao, Armstrong and Bruce7 These carbon particles contribute as reaction sites for the oxygen reduction reaction (ORR) or oxygen evolution reaction (OER), especially during discharge and recharge processes. However, the fact of severe corrosion of carbon materials at high potentials during electrochemical reactionsReference Willsau and Heitbaum8 makes such applications impractical under long-term cell operation in acidic media.Reference Natarajan and Hamelin9 Therefore, alternative catalyst supports have to be sought, and recent attention has been focused on TiO2 as a stable support candidate.Reference Song, Qiu, Li, Zhu and Chen10–Reference Fuentes, Farell and Weidner12 Due to the semiconducting nature of TiO2, great efforts were taken to improve its electronic conductivity.
One type of reduced TiO2, called Magneli phase (TixO2x−1), has been shown to have high stability and electron conductivity in corrosive electrolytes and at high potentials.Reference Walsh and Wills13–Reference Han and Wang16 Yet, the reduction condition for making the Magneli phase is generally rather harsh, requiring very high temperatures under hydrogen, leading to severe sintering and consequently significant loss of surface areas. On the other hand, carbon-modified anatase TiO2 nanoparticles and nanotube arrays under relatively mild conditions have been demonstrated to be effective in photocatalysis and applied in dye-sensitized solar cells.Reference Tsumura, Kojitani, Izumi, Iwashita, Toyoda and Inagaki17–Reference Grimes and Mor21 The TiO2 carbon modification methods include carbon monoxide reduction,Reference Park, Kim and Bard20 acetylene reduction,Reference Kammler and Pratsinis22 flame made with TiC,Reference Choi, Umebayashi and Yoshikawa19, Reference Choi, Umebayashi, Yamamoto and Tanaka23 or polymer TiO2 composites.Reference Tsumura, Kojitani, Izumi, Iwashita, Toyoda and Inagaki17, Reference Inagaki, Hirose, Matsunaga, Tsumura and Toyoda24 X-ray photoelectron spectroscopy (XPS) results of these samples revealed the presence of carbon in all of them.Reference Grimes and Mor21 However, the particle size distributions obtained by these processes are rather broad.Reference Inagaki, Kojin, Tryba and Toyoda25, Reference Toyoda, Yano, Tryba, Mozia, Tsumura and Inagaki26
Carbon coating has been reported to suppress sintering of TiO2 during high temperature annealing.Reference Tsumura, Kojitani, Izumi, Iwashita, Toyoda and Inagaki17, Reference Kammler and Pratsinis22, Reference Inagaki, Hirose, Matsunaga, Tsumura and Toyoda24 The technique could allow tuning the nanoparticle TiO2 electronic conductivity while maintaining its high surface areas, making it possible to obtain titanium oxycarbide (TiOxCy), which can be viewed as a solid solution of TiO in TiC and various titanium suboxides (TiOx, x < 2).Reference Hahn, Schmidt-Stein, Salonen, Thiemann, Song, Kunze, Lehto and Schmuki27 For example, Hahn et al.Reference Hahn, Schmidt-Stein, Salonen, Thiemann, Song, Kunze, Lehto and Schmuki27 have reported TiO2 arrays that were converted into TiOxCy with high conductivity and stability during redox cycles. Carbothermal techniques have been widely used to make metal carbide from metal oxide. The current work aims at making nanoscale TiOxCyin a carbothermal process from Degussa P25, which is commercially and cheaply available.
To date, it is quite common that platinized TiO2 were reported as catalysts in the field of photocatalysis.Reference Kibombo and Koodali28, Reference Lee and Choi29 Also, those active components for OER in bifunctional electrocatalysts in regenerative fuel cells are normally precious metals or their oxides, such as Ir or IrO2.Reference Ioroi, Kitazawa, Yasuda, Yamamoto and Takenaka30, Reference Song, Zhang, Ma, Shao, Zhang and Yi31 However, there is not much literature on such electronically conductive TiO2 as the substrate for loading Pt electrocatalyst for ORR but also active for OER. Herein, we report a carbothermal reduction technique to convert P25 TiO2 nanoparticles into nanoscale TiOxCy in a one-step two-stage process. It is shown that the carbon-modified TiO2 has a narrow size distribution. Their sizes increased but remain small at less than 50 nm, even annealed at 1100 °C. Electrochemical characterizations revealed that the obtained TiOxCyis a very active OER catalyst. Together with Pt, the catalyst is bifunctional, good for both ORR and OER.
II. EXPERIMENTAL
Amorphous TiO2 powders (P25; Degussa Corp., Germany) with a mean size at 22 nm were thermally coated with carbon under 10% acetylene C2H2 in N2 for 20 min at 700 °C in a tubular quartz furnace. After carbon coating, the products were further annealed under 10% H2 in N2 between 900 and 1100 °C for another 4 h. The samples were designated as P25-700 for the thermally coated TiO2 at 700 °C and P25-700-1100h for the annealed and carbon-doped TiO2 at 1100 °C. The latter notation is also referred to c-TiO2. Pt (10 wt%) loaded on the samples for electrochemical measurements was achieved using a salt reduction method reported previously.Reference Xing32
The morphologies of the powders were examined by transmission electron microscope (TEM) (Tecnai F20, FEI, Hillsboro, OR) operating at 300 kV and scanning electron microscope (SEM) (Helios NanoLab 600, FEI, Hillsboro, OR) operating at 30 kV. The crystalline phase of the catalysts was analyzed by x-ray diffraction (XRD) equipped with Cu Kα; the XRD data were collected with a Philips X’Pert Diffractometer (Netherlands). XPS (Kratos Axis 165, Japan) was used to analyze C (1s), Ti (2p), and O (1s) by using Al Kαexcitation, operated at 150 W and 15 kV.
Electrochemical techniques such as cyclic voltammetry (CV), ORR, and OER were used for testing support conductivity and measuring the electrochemical activities of the titanium oxide nanopowders. CV of 10 wt% Pt-loaded or Pt-free catalyst was carried out at a scan rate of 50 mV/s in N2-purged 1.0 M H2SO4 from 0 to 1.2 V versus reversible hydrogen electrode (RHE). All measurements were performed with a standard three-electrode cell using a glassy carbon rotating disk electrode (Pine Instruments, Grove, PA) supporting 0.02 mg catalyst as working electrode. A Pt wire was used as the counter electrode and a saturated Ag/AgCl as reference electrode. CV, OER, and durability of the catalysts were carried in a N2-saturated 1.0 M H2SO4 electrolyte solution. ORR was carried in an O2-saturated 1.0 M H2SO4electrolyte solution.
III. RESULTS AND DISCUSSION
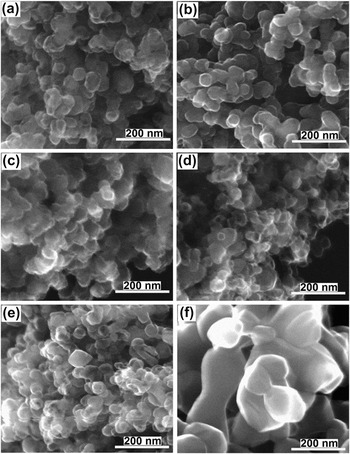
Figures 1(a)–1(f) show the morphologies of P25 untreated and thermally treated at different temperatures. After carbon coating process at 700 °C, the amorphous TiO2 crystallized and the mean size grows from the original 22 nm to about 35 nm [see Fig. 1(b)]. Further annealing up to 1000 °C, the particles only yield tiny growth and are still in a range of 30–40 nm; no obvious sintering was detected and the shape of particles still appears spherical, shown in Figs. 1(c) and 1(d). When the annealing temperature was increased to 1100 °C, some particles agglomerated and their sizes increased to about 55 nm, see Fig. 1(e). A sample of P25 was directly annealed in air at 800 °C for the same duration, resulting in a substantial growth of particle size (up 300 nm), as can be seen from Fig. 1(f). It is clearly shown that the carbon nanocoating is necessary to prevent severe sintering in the TiO2nanoparticles.
SEM images of titanium oxide nanopowders obtained under different thermal treatments. (a) P25: original TiO2, (b) P25-700: P25 carbon coated at 700 °C, (c) P25-700-900h: P25 carbon coated at 700 °C and further annealed at 900 °C, (d) P25-700-1000h: P25 carbon coated at 700 °C and further annealed at 1000 °C, (e) P25-700-1100h: P25 carbon coated at 700 °C and further annealed at 1100 °C, and (f) P25 annealed in air at 800 °C. Annealing time was 4 h for all samples.

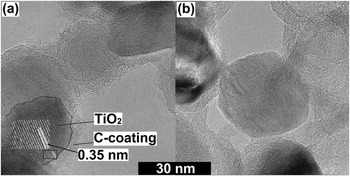
Further investigation of these carbon-doped TiO2 morphology by TEM revealed the reason for the suppression of particle growth. Figure 2 presents the TEM micrographs of P25-700 in Fig. 2(a) and P25-700-1100h in Fig. 2(b). The darker areas are crystalline TiO2 particles, whose lattice spacing is shown in the inset [Fig. 2(a)], and the lighter areas surrounding the darker areas are amorphous carbon coatings with a thickness of ∼5 nm. Apparently, the coating process produces an extremely uniform thin carbon on the TiO2surface. The TEM images also indicate that carbon existed as amorphous, which is consistent with the XRD finding and will be further discussed below.
TEM micrographs of (a) P25-700 and (b) P25-700-1100h, showing uniform carbon coating on the oxide nanoparticles. A contrast is observed between the amorphous carbon and the crystalline titanium oxide or oxycarbide. The inset in (a) shows the lattice spacing of TiO2.

The carbon coating prevents the interaction of individual TiO2 particles through surface or solid diffusion, limiting their sintering. With further annealing under N2/H2 at 1100 °C, as shown in Fig. 2(b), the particles started to coarsen and grow. It was found that some surrounding carbon coating has disappeared. However, some free carbon still can be seen. Koc and FolmerReference Koc and Folmer33 suggested that the reaction of carbon with TiO2only complete at above 1500 °C. No further studies were conducted at higher temperatures to avoid growth.
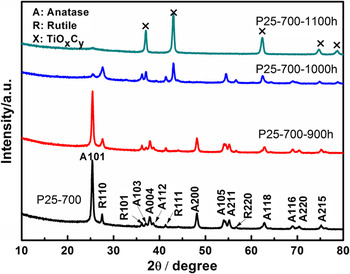
Figure 3 shows the XRD patterns of the samples annealed at different temperatures. After carbon coating at 700 °C, all peaks are related to the TiO2 anatase or rutile phases, implying that the pyrolytic carbon formed was amorphous (no graphitic phase).Reference Grimes and Mor21, Reference Chen and Mao34 Annealing at 900 °C did not produce new phases either. However, when annealed at 1000 °C, clearly, five new diffraction peaks at 2θ ≈ 37°, 43°, 62°, 74°, and 78° were formed, which all can be attributed to the formation of titanium oxycarbide (TiOxCy).Reference Hahn, Schmidt-Stein, Salonen, Thiemann, Song, Kunze, Lehto and Schmuki27, Reference Koc and Folmer33 As Hahn et al.Reference Hahn, Schmidt-Stein, Salonen, Thiemann, Song, Kunze, Lehto and Schmuki27 suggested, titanium oxycarbide is a solid solution of TiO in TiC and various suboxides. XPS analysis below will further support the formation of titanium oxycarbide. Increasing the temperature to 1100 °C, the anatase and rutile phases disappeared completely; the TiOxCy peaks become shaper and well defined, which means the formation of TiOxCywas completed in the duration of treatment.
XRD patterns of P25-700 and those samples annealed at 900, 1000, and 1100 °C. Complete conversion to TiOxCywas found at 1100 °C.

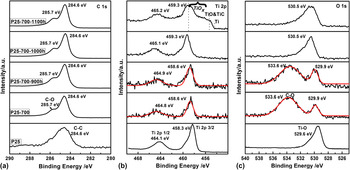
The chemical states of O, Ti, and C were investigated by XPS, and the results are shown in Fig. 4. Two C 1s peaks found at 284.6 and 285.7 eV in all powders are attributed to the carbon source from carbon tape (for sample mounting) and carbonaceous species (in sample).Reference Reyes-Garcia, Sun, Reyes-Gil and Raftery35 No additional C 1s peak was found near 281.5 eV, which would correspond to TiC.Reference Luo, Ge, Jin and Fisher36 This result is indicative of that even annealing at 1100 °C, the doped carbon can only interact with TiO2 to form TiOxCy but not TiC. Generally, TiC can be produced by carbon reduction of TiO2only at 1500 °C or above.Reference Koc and Folmer33
XPS results of C 1s, O 1s, and Ti 2p for P25, P25-700, P25-700-900h, P25-700-1000h, and P25-700-1100h. A broad shoulder is observed in the last sample, showing formation of TiOxCy.

Figure 4(b) presents the Ti 2p spectra. For pure TiO2 samples, Ti 2p 3/2 and 2p 1/2 peaks can be found at binding energy (BE) of 458.3 and 464.1 eV, respectively. Small peak shifts of Ti 2p toward higher binding energies can be observed in all samples. According to Li et al.,Reference Li, Zhu, Qu, Wang, Hui, Zhang and Zhang14 pure TiO2 displays BEs at 464.2 and 485.5 eV, while the reduced form, Magneli phase Ti4O7, has BEs at 464.7 and 459.0 eV. Göpel et al.Reference Göpel, Rocker and Feierabend37 suggested that the shift of Ti 2p from defect-free TiO2 is caused by surface oxygen vacancy defects. Carbon can be incorporated into TiO2 lattice or substituted for oxygen, which can have synergistic effect with oxygen vacancies, resulting in the change of electronic structure between the conducting band and the valence band.Reference Di Valentin, Pacchioni and Selloni38 Our recent work also reported this Ti 2p shift.Reference Huang, Sasaki, Adzic and Xing39 Therefore, the Ti 2p shift suggests that a reduced oxide layer was formed from carbon doping. When annealing at 1100 °C, a typical shoulder belonging to TiOxCy was detected.Reference Hahn, Schmidt-Stein, Salonen, Thiemann, Song, Kunze, Lehto and Schmuki27 This broad shoulder can be divided into several groups, titanium suboxide (TiOx), TiO, TiC, and Ti, as Blackstock et al.Reference Blackstock, Donley, Stickle, Ohlberg, Yang, Stewart and Williams40 suggested. The Ti 2p spectra of the sample P25-700-1100h further consolidated our previous argument that TiOxCywas formed.
The O 1s spectra showed one peak at 529.6 eV in pure TiO2, which is due to the Ti–O bonding. By doping with carbon and further annealing at 1000 °C, two new peaks were discovered. The peak at 529.9 eV can still be ascribed to the contribution of Ti–O bonding, even though there is a small shift. The shift may be caused by replacement of oxygen by carbon to form TiO2−xCx, with trace carbon distortion to the TiO2 lattice. The other peak found at 533.6 eV can be assigned to C–O in carboxyl groups.Reference Moreno-Castilla, Maldonado-Hódar, Carrasco-Marín and Rodríguez-Castellón41 When annealed at above 1000 °C, the O 1s peak at 533.6 eV disappeared and an obvious shift was observed for the Ti–O bonding, which was also found by Hahn et al.Reference Hahn, Schmidt-Stein, Salonen, Thiemann, Song, Kunze, Lehto and Schmuki27 Both XRD and Ti 2p spectra have shown the formation of TiOxCy, and we can ascribe the O 1s at 530.5 eV to the Ti–O bonding in TiOxCy.
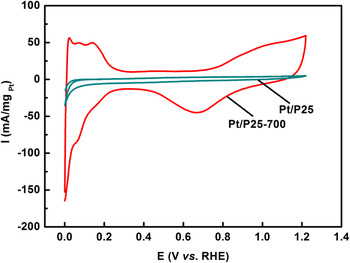
Figure 5 compares the electrochemical activity of Pt/P25 with that of Pt/P25-700. It clearly demonstrates that Pt nanoparticles supported on P25-700 exhibit much higher electrochemical activity, while Pt loaded on undoped TiO2 shows negligible catalytic activity due to low conductivity of the support. These results demonstrate that carbon doping indeed significantly increased the electronic conductivity in P25 with carbothermal treatment. The combined effects of substitutional carbon, interstitial carbon, and oxygen vacancy contribute to the change in the band structure of TiO2,Reference Di Valentin, Pacchioni and Selloni38 resulting in the increase of its conductivity. The close contact of Pt with its conducting support enables the catalyst to have typical Pt electrochemical activity in the CV, as displayed in the regions of hydrogen adsorption/desorption, platinum oxidation, and platinum oxide reduction.Reference Bauer, Lee, Song, Xie, Zhang and Hui11
Cyclic voltammograms of 10 wt% Pt supported on samples P25 and P25-700 in 1 M H2SO4. Much larger currents were observed in the latter sample, which is attributed to the much higher conductivity of the carbon-doped support.

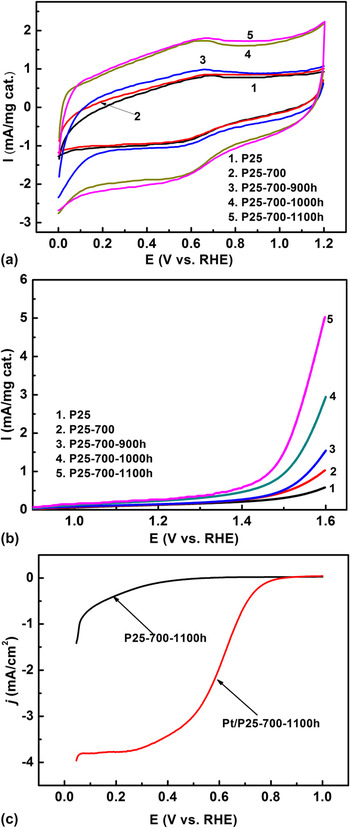
CV tests of thermally treated TiO2 were performed to investigate the electrochemical activity of different nanopowders, results of which are shown in Fig. 6. The anodic peak at 0.65 V and cathodic peak at 0.58 V in Fig. 6(a) are associated with the oxidation and reduction of the surface oxide groups. The bigger double layer capacity in P25-700-1000h and P25-700-1100h can be attributed to the formation of TiOxCy since surface carbon coating is consumed during annealing, as observed from the TEM images [Fig. 2(b)]. OER was carried out to investigate the catalyst activity toward oxidation of water to generate molecular oxygen in acidic electrolyte medium, 2H2O = 4e− + 4H+ + O2, and the onset potential for this reaction is a basic criterion to evaluate the efficiency of the catalyst.
Electrochemical characterization: (a) cyclic voltammograms of undoped and doped TiO2 in N2-saturated 1.0 M H2SO4 with scanning rate at 50 mV/s, (b) OER results of the corresponding nanopowders in N2-saturated 1.0 M H2SO4 with scanning rate at 5 mV/s. (c) Typical ORR results of TiOxCy nanopowders in O2-saturated 1.0 M H2SO4with scanning rate at 5 mV/s, with or without Pt electrocatalyst.

According to Nowotny et al.,Reference Nowotny, Bak, Nowotny and Sheppard42 the presence of defects at TiO2 surface, e.g., oxygen vacancies, is essential for water splitting. Undoped TiO2 showed the worst OER activity, as can be seen in Fig. 6(b). The sample has the highest onset potential and lowest current, which could be attributed to its low surface defects.Reference Nowotny, Bak, Nowotny and Sheppard42–Reference Menetrey, Markovits and Minot44 Introducing carbon doping and further annealing can create oxygen vacancies as predominant defects, as confirmed by the formation of reduced Ti from previous XPS analysis.Reference Bauer, Lee, Song, Xie, Zhang and Hui11, Reference Li, Zhu, Qu, Wang, Hui, Zhang and Zhang14, Reference Park, Kim and Bard20, Reference Hahn, Schmidt-Stein, Salonen, Thiemann, Song, Kunze, Lehto and Schmuki27 Annealed at 1100 °C, the carbon-coated TiO2 has almost completed the transformation from TiO2 to TiOxCy, which has the most oxygen vacancies. As a result, the catalyst showed the best OER catalytic activity, with the lowest OER onset potential at 1.45 V.
Many efforts have been made in seeking other oxides to replace the expensive OER catalyst, IrO2, which is considered to be the state of the art. Among various candidates, perovskites exhibited comparable or better OER activity than previous reports. Suntivich et al.Reference Suntivich, May, Gasteiger, Goodenough and Shao-Horn45 most recently reported perovskites with an onset potential in range of 1.5–1.65 V (versus RHE). At 0.4 V overpotential versus RHE (1.23 V), the OER current activities are in a range of 0.12–14 mA/mgcatal.. The TiOxCy (curve 5) in Fig. 6(b) yielded a ∼5 mA/mgcatal.current density at 1.6 V, therefore, having a comparable OER activity as the reported perovskites and further demonstrating the substantial OER activity of the titanium oxycarbide.
However, none of our samples exhibit ORR activity, as shown in Fig. 6(c), in which large overpotentials and negligible currents were observed. To obtain ORR activity, Pt was deposited on the TiOxCy and typical ORR curvesReference Xing, Cai, Vukmirovic, Zhou, Karan, Wang and Adzic46 were obtained [Fig. 6(c)]. An onset potential at ∼0.85 V shows that the TiOxCy support is an excellent alternative support to the high surface area carbon black. Altogether, the catalyst Pt/TiOxCyhas both OER and ORR activities, demonstrating an effective bifunctional catalyst.
IV. CONCLUSIONS
In this paper, we demonstrated a carbothermal technique that allows making nanoscale TiOxCy from commercial TiO2 P25 nanoparticles. The process is a simple one-step two-stage process. It can be achieved in most lab furnaces under relatively low temperatures. The process involves a carbon coating stage, followed by an annealing stage. By doing so, sintering of the nanoparticles is substantially suppressed, allowing us to maintain the large surface areas of the particles needed for catalyst support. It was found that partial carbon substitution in the TiO2 lattice occurred at below 1000 °C. But at 1100 °C, the TiO2 nanoparticles can be completely converted to TiOxCy, with only a small increase in particle size. It was also found that markedly improved electronic conductivity can be obtained in TiOxCy, which makes it a good substrate for supporting the Pt electrocatalyst. The TiOxCy nanopowders obtained showed a significant activity in OER. By depositing Pt on it, a bifunctional catalyst, Pt/TiOxCy, was demonstrated to be effective for both ORR and OER.
ACKNOWLEDGMENTS
The authors would like to thank partial financial support for this research from the U.S. Department of Energy ARPA-E Grant No. DE-AR0000066. We thank Dr. Eric Bohannan for XRD analysis, Mr. Brian Porter for XPS analysis, and Dr. Kai Song for taking TEM images.