

Through the more than ten-year history of the WTO's Doha Agenda, successive rounds of negotiations have moved through a framework for negotiations (WTO, 2004), draft ‘modalities’ of agreement (WTO, 2006), and the detailed draft agreements on market access of December 2008 (WTO, 2008a,b). The extensive consultations and negotiations leading to the Ministerial Meeting in April 2011 resulted in almost no change from the December 2008 agreements, and confirmed that the critical questions to be addressed were now political, rather than technical (WTO, 2011), and hence no longer amenable to resolution through the continuing process of WTO negotiations. With major concern focused on the extent to which the proposed agreement would increase market access (Baldwin and Evenett, Reference Baldwin and Evenett2011), it seems important to have a concise summary and assessment of the economic impacts of the particularly complex market access proposals on the table, whether as a basis for changes in approach that may lead to an agreement, or as part of the process of identifying a path forward for future negotiations (Schwab, Reference Schwab2011).
Despite, or perhaps because of, their detailed nature, it remains very difficult to assess the implications of these draft agreements for developing countries. While the draft agreement is based on general tariff-cutting formulas, there is an enormous range of exceptions for products and for countries. This results in an important information asymmetry. It is relatively easy for countries to assess the ‘pain’ associated with the negotiations. They know the preferences and constraints on their policy makers, and have good information on their policies. Working out the ‘gain’ side of the deal is much more difficult. Even if policy makers in an individual country know what their trading partners are likely to do, they face a challenge in adding up the implications of these decisions. In this paper, we attempt to deal with these problems, to allow countries to assess the ‘gain’ as well as the ‘pain’ associated with negotiating proposals.
Some key questions include. What are the implications of the current formulas for tariffs levied by WTO members, and for the tariffs facing developing countries? What would happen if these formulas were adopted without exceptions? How are the benefits affected by the flexibilities in agriculture and non-agricultural market access (NAMA)? Answers to these questions are clearly of critical importance if informed decisions are to be taken to move the overall process of negotiations forward.
This analysis incorporates two methodological innovations not previously applied in assessments of draft Doha agreements. The first is systematic approach to the selection of exceptions from the tariff-cutting rules, based on the political objective function proposed by Grossman and Helpman (Reference Grossman and Helpman1994) and applied in Jean, Laborde, and Martin (Reference Jean, Laborde and Martin2010b, Reference Jean, Laborde and Martin2011). The second is the use of optimal aggregators of trade distortions when measuring the welfare impacts of reform (see Laborde, Martin, and van der Mensbrugghe, Reference Laborde, Martin and van der Mensbrugghe2011) to overcome the well-known problems with trade-weighted averages – that the higher the tariff, the lower the weight on any tariff, and that partial reforms generate benefits from increases in the volume of imports subject to continuing tariffs.
The Doha Development Agenda is about much more than market access in agricultural and non-agricultural merchandise trade. We focus on these parts of the agreement because: (i) they appear to be much more important for welfare impacts than other quantifiable impacts such as agricultural domestic support or export competition; (ii) they are complex proposals, the impact of which requires very careful evaluation; (iii) acceptance of something like these proposals is a necessary, albeit far from sufficient, condition for a broader agreement to be reached; and (iv) our ability to make informed assessments on agricultural and NAMA market access is much greater than in areas such as services or trade facilitation. For a more comprehensive discussion, including other aspects of the draft agreements, such as sectoral agreements, and possible approaches to future negotiations, see Martin and Mattoo (Reference Martin and Mattoo2011).
In this paper, we begin by examining the key market access features of the current draft agreement. We first consider the impacts of the formulas on average tariffs, and then assess the implications of the flexibilities for different countries and commodities. Through most of the paper, we focus on the impacts on the well-understood weighted-average tariff rates applied by, and facing, individual countries and groups of countries. Then, in the final section of the paper, we consider the impacts of these reforms for real incomes.
Proposed reforms in agricultural and non-agricultural merchandise trade
The December 2008 proposals on agriculture and non-agricultural trade reforms were negotiated separately, although it is widely recognized that the final outcomes in each negotiation would be linked.
Agricultural market access modalities
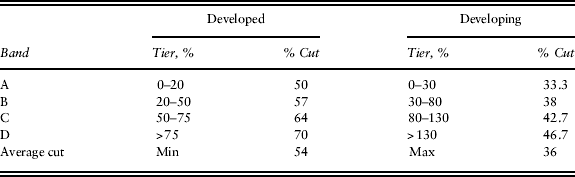
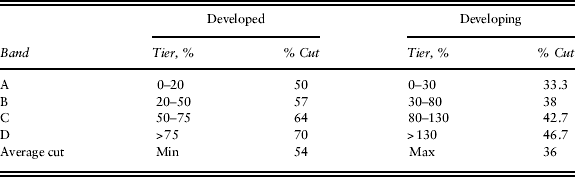
The draft agreement on agriculture calls for the use of a tiered formula, with larger proportional cuts on higher tariff rates. The boundaries of the four tariff bands for developed and developingFootnote 1 countries are given in Table 1, together with the proportional cuts to be made in bound agricultural tariffs in each band.
The tiered formula for agricultural tariff cuts
The tiered formula requires that tariffs be available in ad valorem form. This involves an element of discretion in the case of agriculture because of the presence of tariff-rate-quotas (TRQs), for which the recorded price of imports may be inflated through inclusion of quota rents, thus resulting in underestimates of the true ad valorem equivalent. A consistent method for evaluation of ad valorem equivalents has been agreed (Annex A to WTO, 2006) and this methodology is used in assessing the bands in which tariffs are placed, and hence the tariff cuts required.
As is evident from Table 1, the tariff-cutting formula is quite aggressive, particularly relative to the approach used in the Uruguay Round negotiations. In the Uruguay Round, countries were required to meet a target only in terms of the average cut in their tariffs, a procedure which encouraged them to make larger cuts in their smaller tariffs. The Doha tariff-cutting formulas have the economically desirable feature of making larger cuts in the higher – and hence more costly – tariffs.Footnote 2 In line with long-standing practice, developing-country cuts in each band are two-thirds of those of the industrial countries. The bands are also wider, in part to allow for the fact that many developing countries would otherwise have more tariffs included in the higher bands.
Special provisions apply for tariff escalation products. Here the general principle is that processed products subject to tariffs higher than their raw or intermediate forms are moved to the next higher tier. If they are in the highest tier, the cut is increased by 6 percentage points. If the gap between the processed and unprocessed product is less than 5 percentage points, then the tariff escalation procedure is not used, and the tariff on the processed product should not be brought below the tariff on intermediates.
A list of tropical and diversification products will be subject to deeper-than-formula cuts. Two lists of products have been considered – one includes highly sensitive products such as rice, sugar, and bananas (see Appendix G of the agricultural modalities), and the other is the more limited list used in the Uruguay Round. Two alternative treatments have been discussed. Under the first, tariffs below 25% would be reduced to zero, and no sensitive product treatment permitted. Under the second, tariffs below 10% would be reduced to zero, while higher tariffs would be reduced by 70%, except for products already in the top tier, which would be cut by 78%. Under the second alternative, sensitive product treatment will not be ruled out. The Uruguay Round set of products is used in the empirical analysis without allowing for sensitive products, so that the tariff cuts are as outlined above.
Several groups of developing countries are allowed smaller tariff reductions. Least developed countries (LDCs) are not required to make any reductions. Small and vulnerable economies (SVEs)Footnote 3 can make reductions 10% smaller in each band than other developing members, or may make an average cut of 24%. Recently acceded members (RAMs) are allowed to: make cuts reduced by 8 percentage points, make zero cuts in tariffs below 10%, delay their reductions until a year after completion of their accession commitments, and have one-tenth more special products with cuts 2 percentage points smaller. A group of very recently acceded members (VRAMs) and transition economies is not required to make any cuts. The members of these groups are listed in Table 2 below, which summarizes the approach taken in the analysis.
All countries are permitted to make smaller cuts on ‘sensitive’ products. The modalities include a limit on the number of sensitive products, and provisions for increases in market access under TRQs for sensitive products. In industrial countries, 4% of tariff lines can be classified as sensitive, except for countries with over 30% of bindings in the top band, or with tariffs scheduled at the six-digit level, in which case this percentage can be increased by 2 percentage points. If the cut is reduced to one-third of the formula cut, then TRQ access must be increased by 4% of estimated domestic consumption; if the reduction is to half the formula cut, the TRQ increase is 3.5%; if the reduction is to two-thirds of the formula cut, then the TRQ increase is 3% of domestic consumption. Developing countries have the right to one-third more sensitive products than developed countries.
In addition to sensitive products, developing countries will be able to self-designate a set of special products guided by indicators and to make smaller-than-formula cuts on these products. Twelve percent of agricultural tariff lines are to be allowed this treatment, with an average cut of 11%, and up to 5% subject to no cuts.Footnote 4 Several countries ‘expressed reservations’ on the number of special products and have requested more tariff lines.
Sensitive products are likely to be selected from an agreed list of products nominated by any member – a process that means the list will not constrain the choice of products unless a country wishes to add a product after the list has been finalized. Special products are self-designated, guided by a set of indicators. These indicators cover a range of issues such as importance as a staple food, the proportion of demand met from domestic production, importance in employment, the share of output processed, whether productivity is low in any part of the member relative to the world average. It seems likely that these indicators will allow countries considerable freedom to self-designate products.
A key question in forming an ex ante assessment of the implications of these flexibilities for tariff reductions and market access is how the sensitive and special products will be chosen. Some studies have assumed that the products likely to be chosen for smaller or zero cuts would be those with the highest bound tariffs (Sharma, Reference Sharma2006), while others have assumed that they would be those with the highest applied tariffs (Vanzetti and Peters, Reference Vanzetti and Peters2008), and still others have used a tariff-revenue-loss criterion under which the products selected tend to be large imports subject to large cuts in applied tariffs (Jean, Laborde, and Martin, Reference Jean, Laborde, Martin, Anderson and Martin2006). None of these approaches has any firm conceptual basis.
Following Jean, Laborde, and Martin (Reference Jean, Laborde and Martin2010a, Reference Jean, Laborde and Martin2011), we use the Grossman–Helpman (Reference Grossman and Helpman1994, equation (5)) government preference function to identify the products whose treatment as sensitive would give the largest reduction in the political costs associated with tariff-cutting. Jean, Laborde and Martin (Reference Jean, Laborde and Martin2011) show that this leads to selection of products with relatively large shares of total imports, high applied tariffs, and that would face large cuts in applied rates. They also show that the consequences of selecting sensitive products on this basis are likely similar to those of their tariff-revenue-loss rule – with even small numbers of sensitive products sharply reducing the cuts in average tariffs.
The draft agreement sharply reduces the use of the Special Safeguard (SSG) which currently allows countries that converted non-tariff barriers into tariffs by ‘tariffication’ in the Uruguay Round (mostly developed countries) to impose duties above their Uruguay Round bindings. There is agreement to include a new Special Safeguard Mechanism (SSM) for developing countries with import duties triggered by increases in import volumes or declines in import prices. Hertel, Martin, and Leister (Reference Hertel, Martin and Leister2010) show that automatic application of the quantity-based SSM would increase the volatility of domestic prices, while the price-based measure would increase the volatility of world prices, but duties seem unlikely to be raised above bound levels very frequently. Because of uncertainty about its precise parameters and the extent to which the options to impose duties will be used, we have not included this measure in our analysis in this paper.
Non-agricultural market access
The draft modalities for NAMA (WTO, 2008b) also involve a tariff formula with exceptions. The formula is applied on base rates equal to existing bound tariffs or to the average applied MFN rate in November 2001 plus 25% for currently unbound tariff lines. The tariff formula in this case is the highly non-linear Swiss formula, which reduces the highest tariffs by the most. The Swiss formula requires tariffs in ad valorem terms, and all tariffs are to be converted into ad valorem terms and bound in those terms.
The Swiss formula is:

where t 1 is the tariff after application of the formula, t 0 is the tariff rate before application of the formula, and a i is a coefficient for group i.
The coefficient a i in equation (1) would be 8 for industrial countries, with no flexibility for individual products. For developing countries, the coefficient is to be based on a sliding-scale with a coefficient of 20, 22, or 25, depending upon the extent of flexibility chosen. Countries choosing a i=20 could keep 6.5% of tariffs unbound or not cut these tariffs as long as they do not cover more than 7.5% of imports; or to make half-of-formula cuts in 14% of lines on products covering no more than 16% of imports. With a i=22, 5/5% of lines/imports would be allowed no cuts, or up to 10/10% of lines/imports allowed half-of-formula cuts. With a i=25 no flexibilities would be available.
Least-developed-countries (LDCs) are not required to use the Swiss Formula, but are expected to increase their binding coverage. Countries with binding coverage below 35%Footnote 5 are exempt from formula cuts but required to bind – at an average tariff of 30% or lower – 75% of tariffs if their binding coverage is currently below 15%, or 80% otherwise.
Small and vulnerable economies (SVEs) face different disciplines. Those with average bound tariffs of 50% or higher must bind at an average not exceeding 30%. Those with an average bound tariff between 30% and 50% must bind at an average of 27% or less. Those with average bound tariffs between 20% and 30% are to bind at an average of 18% or less. Those with an average bound tariff below 20% must either cut 95% of their tariffs by 5% or more, or bind at an average rate equal to that arising from these cuts.Footnote 6
RAMs receive a grace period of three years and an implementation period of three years. In contrast with the case of agriculture, they do not receive smaller cuts in tariffs. However, very recent acceded members benefit from tariff reduction exemption. The NAMA proposal includes provision for sectoral initiatives, for which participation is not mandatory, but agreement is to be reached when 90% of world trade is included. In most cases, it is proposed to move to zero tariffs on these products.
Specifying cuts in tariffs
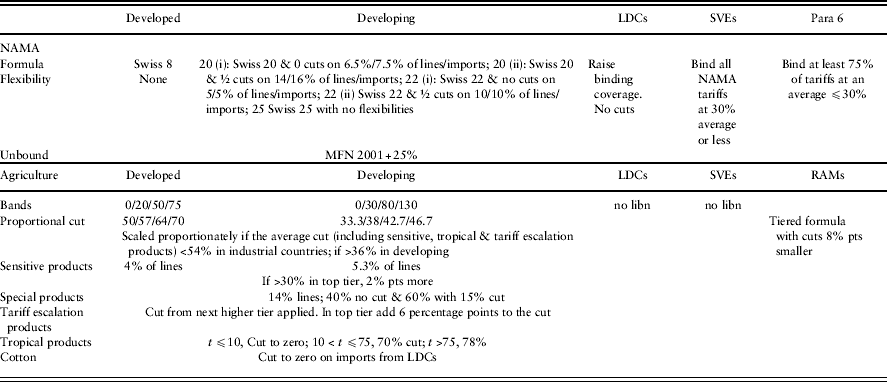
To provide a preliminary assessment of the implications of the modalities for the applied protection, we use the MAcMapHS6 version 2.1 database (Boumellassa, Laborde, and Mitaritonna, Reference Boumellassa, Laborde and Mitaritonna2009) for 2004 together with a set of bound tariff rates for which ad valorem equivalents have been calculated on the same basis. We first cut the bound tariff rates using the approaches considered in the modalities, and then assess their implications for applied rates. Where the draft agreements involve a range, we generally use the mid-point. The specific choices of parameters used are set out in Table 2. In this analysis, we use the conventional assumption that applied rates are not reduced unless the new bound rate falls below the baseline applied rate,Footnote 7 assumed to be the applied rate in the tariff baseline which is which is for 2004 – MAcMapHS6 v2.1 dataset – with several key updates. We take into account some internationally binding commitments to reform that will affect the tariffs that will in 2025 in the absence of an agreement. The adjustments to the baseline tariff include WTO commitments taken in the accession process by a range of countries, including China and Ukraine. In addition, the Japanese GSP for LDCs has been updated based on 2007 improvements in terms of product coverage. Due to its importance, the effects of the EU sugar reform on EU applied tariffs are also included in the baseline (Bureau and Gohin, 2006).
The tariff reduction formulas and the flexibilities are intertwined in that countries are frequently willing to consider more ambitious formulas when they have the flexibility to make smaller cuts for some products (see Jean, Laborde, and Martin, Reference Jean, Laborde and Martin2011). A major problem for negotiators in this situation is that the ‘price’ paid for the flexibilities – in terms of efficiency and market access – is difficult to evaluate. We make a distinction between the cuts without flexibility and those resulting from the formula plus flexibility to allow for an estimate of the implications of the flexibilities, as long as it is recognized that agreement on the particular formulas was almost certainly contingent on the presence of flexibilities.
In some cases, such as NAMA reforms in the industrial countries, the formula can simply be applied to the bound tariffs using the coefficients in Table 2. In most cases, however, it was necessary to take account of the flexibility options before the cuts to applied rates could be determined. In many other cases, the selection of products to be accorded flexibility was a multi-stage process. For agriculture, we assumed that developing countries would use special products – with their smaller tariff cut requirements – for the products with the strongest political support; then sensitive products.Footnote 8 In the NAMA flexibilities, it was necessary to examine the full range of choices available before the regime involving the least political cost could be identified.
Summary of key elements of the tariff cuts used in the analysis
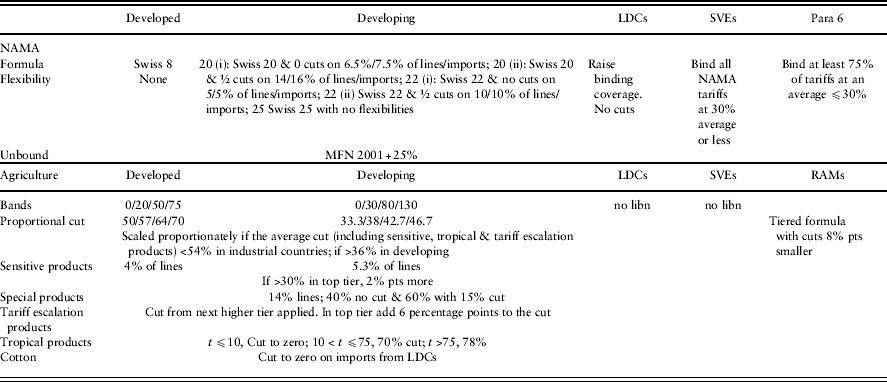
Notes: Members self-select developing or developed-country status. Members likely to select developed-country status include the 27 members of the European Union, plus Australia, Canada, Iceland, New Zealand, Norway, Switzerland, and the United States of America. The Republic of Korea is a developing country for agriculture; a developed country for NAMA. LDCs are identified in the UN list of least developed countries (LDCs). Economies treated as small and vulnerable (SVE) for NAMA were: Antigua & Barbuda, Barbados, Belize, Bolivia, Botswana, Brunei Darussalam, Cameroon, Cuba, Dominica, Dominican Republic, Ecuador, El Salvador, Fiji, Gabon, Georgia, Ghana, Grenada, Guatemala, Guyana, Honduras, Jamaica, Jordan, Kenya, Macau, Mauritius, Mongolia, Namibia, Nicaragua, Panama, Papua New Guinea, Paraguay, Saint Kitts and Nevis, Saint Lucia, Saint Vincent and the Grenadines, Sri Lanka, Trinidad and Tobago, Uruguay, and Zimbabwe. For SVE treatment in agriculture, add Congo, Côte d'Ivoire, Nigeria. Paragraph 6 economies (those with less than 35% of tariffs bound) were identified as: Cameroon; Congo, Cuba, Ghana, Kenya, Macau, China; Mauritius; Nigeria; Sri Lanka; Suriname; Zimbabwe. Members treated as RAMs are: China, Croatia, Ecuador, Georgia (NAMA only) Jordan, Mongolia, Oman, Panama, and Chinese Taipei. Members treated as VRAMs (no cuts) in agriculture are: Albania, Armenia, Georgia, Kyrgyz Republic, Moldova, Former Yugoslav Republic of Macedonia, Saudi Arabia, Tonga, Ukraine, Vietnam. The Special Product percentages used are higher than in the December 2008 modalities because of the ‘serious objections’ of some developing countries.
In agriculture, we could not explicitly represent the TRQ increases which are associated with sensitive product designation in the industrial countries. We anticipate that most users of TRQs will use the option to reduce the formula cut by two-thirds and expand quotas by 4% of domestic consumption. In light of the finding by de Gorter and Kliauga (Reference de Gorter, Kliauga, Anderson and Martin2006: 155) that TRQ expansion would have about one-third the impact of tariff cuts, we treated sensitive products as reducing the formula tariff cut by one-third.
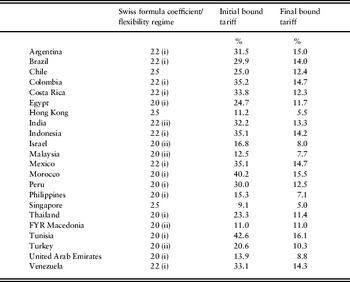
The NAMA flexibility regime for each developing country was selected from the options listed in Table 2 using techniques detailed in Jean, Laborde, and Martin (Reference Jean, Laborde and Martin2010b). The Grossman–Helpman political costs associated with each of the five available regimes was evaluated subject to the constraints identified in Table 2. The lowest-political-cost option chosen is shown in Table 3 for each of the 22 developing countries using the Swiss formula, with estimates of the initial and final bound tariffs for these countries. An interesting feature is the wide range of likely choices of regime. For members with low and uniform tariffs, such as Chile, Hong Kong, and Singapore, a choice of the highest coefficient with no flexibilities is likely to yield the lowest political ‘pain’. For countries with higher and less uniform applied tariffs, the choice is less obvious. Using our methodology, which takes into account the value of trade and the squared reduction in the price of each good, we find that 12 countries are likely to opt for the lowest coefficient, 20. Of these, most would likely choose half-formula cuts on no more than 14% of tariff lines and 16% of trade. An additional seven members opt for a coefficient of 22, with all but one of these electing for no cuts on up to 5% of tariff lines and 5% of trade.
Choice of NAMA coefficient and flexibility regime by developing countries

Note: See Table 2 and the text for the Swiss formula coefficient and flexibility regimes.
Implications for average applied tariffs
In this section, we consider the implications of the formulas and scenarios discussed above for weighted-average tariffs levied and faced by developed and developing countries under the agricultural and non-agricultural proposals. As shown by Anderson and Neary (Reference Anderson and Neary2007) and evaluated for agricultural sensitive products in Jean, Laborde, and Martin (Reference Jean, Laborde and Martin2011), this standard measure of tariff reduction is incomplete as a measure of market access and of economic welfare. However, it provides an initial, and widely understood, initial indication of the potential economic effects – something that is not obtainable through reliance only on changes in bound tariff rates. We first consider the tariffs levied by countries, and then the tariffs they face on their exports.
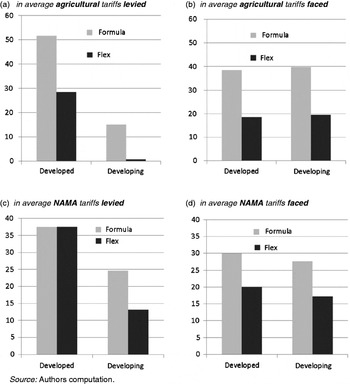
A key question for negotiators is the extent to which the tariff-cutting rules and exceptions affect the size of the tariff cuts they must undertake – which are strongly related to the political ‘pain’ associated with the negotiations – and the reductions in the barriers they face abroad – which help determine the political ‘gain’ associated with the negotiations. For agriculture, these two aspects of the negotiations are summarized for two key groups: (i) the high-income countries, and (ii) developing countries, other than LDCs, for whom the required tariff cuts are set to zero – in Figures 1(a) and 1(b). For non-agricultural products, similar estimates are provided in Figures 1(c) and 1(d). In these graphs, we use the widely cited percentage cut in the tariff from its initial level – a useful measure of the progress towards open trade achieved under the negotiations. More details to help identify the sources of these outcomes, and the critically important results for individual countries, are given in the appendix.
Percentage cuts in applied tariffs

Figure 1(a) shows that the tariff formulas in the draft agreement would – without any flexibility – result in more than a 50% cut in the agricultural tariffs levied by the developed countries. For developing countries, the resulting cut would be much smaller, at 15%. The large difference reflects two key influences, the smaller cuts in developing-country bound tariffs, and the larger gaps between bound and applied rates (binding overhang) in many developing countries that reduce the extent to which cuts in bound tariffs reduce applied rates. The inclusion of flexibilities reduces the cuts in applied rates in the industrial countries, but still results in a substantial cut in the average applied rate. In the developing countries, by contrast, the inclusion of flexibilities reduces the cut in average applied rates to 0.8% of the initial tariff rate. Clearly, the fact that cuts in applied rates in developing countries are lower than in the industrial countries is primarily due to the differences in the formula and binding overhang, rather than to flexibilities, but the flexibilities reduce the impact further.
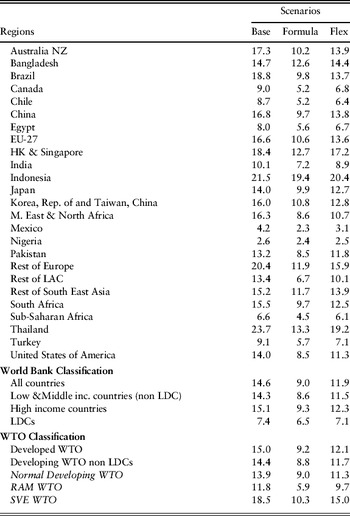
When we turn to the agricultural tariffs faced in Figure 1(b), we see that the cuts in average applied tariffs would be enormous in the absence of flexibilities – close to 40% for both industrial and developing countries. For both groups of countries, these benefits are more than halved by including the flexibilities. However, for both groups of countries, the result is a substantial overall cut in tariffs faced, with the agricultural tariffs faced by high-income countries falling by 18.5% of their initial level, while those facing developing countries are cut by 19.6% of their initial level.
For non-agricultural products, the proposed Swiss formula cuts NAMA tariffs by an average of 38% in the industrial countries, and by 25% in developing countries (Figure 1(c)). Because the industrial countries have no flexibilities, tariffs in these countries are cut by the full 38%. After considering the flexibilities, the cut in average NAMA tariffs in developing countries is 13%. Turning to the tariffs faced measure in Figure 1(d), we see that, without flexibilities, the tariffs facing industrial countries would fall by 30% while, with flexibilities, the resulting cut would be 20%. For developing countries, the formulas would result in a cut of 27.6% in average tariffs faced, and this cut shrinks to 17.2% once the flexibilities are taken into account. However, the outcomes for individual countries differ considerably, as is evident from the more detailed tables in the Appendix.
Real income impacts of reform
In assessing the welfare impacts of reform, we take into account both the efficiency gains resulting from changes in the volumes of goods transacted across trade (and domestic) distortions, and the terms-of-trade changes that result from reforms by all participants. The benchmark against which monetary values of reform are evaluated is the global economy projected forward from the 2004 benchmark database to the size and structure of the 2025 global economy at 2004 prices. To solve the model, we aggregate the critically important trade and tariff data from over 5,000 tariff lines to the 25 sectors at which the model is solved. A key innovation relative to other studies of the impacts of the Doha Agenda is our use of an optimal aggregation approach originally developed by Bach and Martin (Reference Bach and Martin2001) for individual countries and extended to global models by Anderson (Reference Anderson2009). As shown by Laborde, Martin, and van der Mensbrugghe (Reference Laborde, Martin and van der Mensbrugghe2011), this approach deals with two inherent problems of the usual fixed-weighted-average approach to tariff aggregation: (i) the progressive increases in the quantity weights on products being liberalized within each product group, and (ii) the omission, in partial liberalization scenarios, of increases in tariff revenues resulting from increases in the import volumes of goods being partially liberalized. For expenditures on imported goods, and hence the determination of import quantities, we use an optimal expenditure aggregator. For tariff revenues, we use a weighted average with the quantity weights adjusting in response to changes in the relative prices of different imported goods. Our approach remains conservative in not considering the potential gains resulting from sources such as increases in the variety of consumer goods and intermediate goods imported, and increases in productivity resulting from learning by doing.
An important step in implementing this approach is to specify the extent to which imports of products at the finest level of aggregation respond to changes in prices resulting from tariff changes. There are no measures of the exact elasticities we require. However, the available estimates of closely related parameters allow us to identify a broad range of between two and five for the elasticity of substitution between products defined at the six-digit level used in the construction of our estimates (see Laborde, Martin, and van der Mensbrugghe, Reference Laborde, Martin and van der Mensbrugghe2011 for a discussion).
The analysis was undertaken using the linkage model for comparability at the level of aggregation used in Anderson, Martin, and van der Mensbrugghe (Reference Anderson, Martin, van der Mensbrugghe, Anderson and Martin2006). The estimated real income gains associated with liberalization were first estimated using the traditional estimation procedure based on weighted-average tariffs. These estimates were then compared with results using optimally weighted estimates of distortions obtained using an elasticity of substitution of two. The implications of the Doha simulations were also investigated using an elasticity of substitution of five. The results for these scenarios are presented in Table 4.
Welfare implications of Doha liberalization, $bn in 2025 at 2004 prices

Source: LINKAGE model simulations relative to the 2025 world economy.
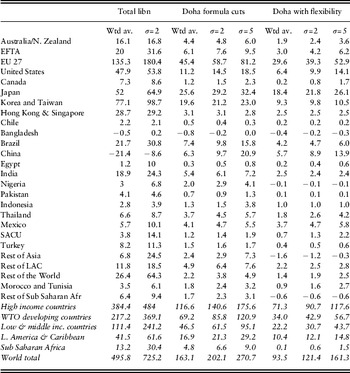
Table 4 contains many interesting results about the implications of the negotiations for welfare. A first is that the formulas used in the negotiations – without exceptions – would potentially result in substantial real income gains. With the weighted-average tariff measures, the gains from applying the tariff reduction formulas for agriculture and non-agriculture would result in gains roughly one-third as large as those from full liberalization. For low- and middle-income countries as a group, the gains would be a larger share of the total potential gains – a little over 40%. When the flexibilities are introduced, the benefits to the world as a whole decline sharply, from $163 billion to $93 billion in this case. The estimated gains to developing countries decline by more than half, to $22 billion.
As pointed out in van der Mensbrugghe (Reference van der Mensbrugghe and Newfarmer2006), there are many pitfalls in comparing estimated welfare gains from Doha scenarios given differences such as those in the experiments conducted, and improvements in the baseline tariff data. However, once attention turns to reasonably comparable experiments and models, the results do seem to be reasonably comparable. Bouët and Laborde (2010) use the mirage model to consider a very similar liberalization scenario for agricultural and non-agricultural trade, and estimate real income gains in the same year (2025) of $69 billion, as against the $93.5 billion reported above. The two main contributing factors to the differences between these results are the lower elasticities of substitution between domestic and imported goods in mirage and, in the case of agriculture, the greater ability to reallocate land among agriculture uses in the linkage model. Anderson, Martin, and van der Mensbrugghe (Reference Anderson, Martin, van der Mensbrugghe, Anderson and Martin2006: 370) consider different experiments, with slightly deeper cuts in agricultural tariffs, but only a stylized 50% cut in non-agricultural tariffs. Their estimated impact of $96 billion without exceptions is smaller than the $163 billion reported above, but this is presented in 2001 dollars and relative to a 2015 world economy that was only around three quarters of the size of the 2025 economy used in our analysis.
Another recent study of the Doha Agenda by Hufbauer, Schott, and Wong (Reference Hufbauer, Schott and Wong2010: 11) estimates a gain of $63 billion in 2010 dollars for the ‘on-the-table’ proposals (including flexibilities) for liberalization of agriculture and non-agriculture. This result is broadly comparable with our estimate of $93 billion in 2025, an outcome that reflects two offsetting differences in methodology. On the one hand, the Hufbauer, Schott, and Wong study uses a partial equilibrium modeling framework that would typically result in lower estimates than a comparable general equilibrium analysis. On the other hand, it uses a highest tariff rule for selection of sensitive products that reduces the estimated adverse impacts of the flexibilities in agriculture (Jean, Laborde, and Martin, Reference Jean, Laborde and Martin2011).
When we address the aggregation problem, the welfare gains from liberalization rise. With an elasticity of substitution of two, the welfare gains from full liberalization rise by 50% to $725 billion per year. The gains from application of the formula without exceptions rise by a quarter, from $163 billion to $202 billion. The gains to developing countries rise by roughly a third, from $46.5 billion to $61.5 billion. When we turn to an elasticity of substitution of five, the gains to the high-income countries are roughly 50% above their estimate using the weighted-average methodology. For developing countries, they are more than twice as high, at $95.1 billion per year.
When we consider Doha liberalization with exceptions selected in a way that takes into account the goals of policy makers, the estimated gains are considerably smaller than when using the formulas without exceptions. This is most striking with the weighted-average approach where the global gains with exceptions are $93.5 billion per year, and the gains to developing countries are $22 billion. When the aggregation problems are addressed using an elasticity of substitution of two, the gains to the world rise to $121.4 billion and the gains to developing countries from $22 billion to $30.7 billion. Moving to an elasticity of substitution of five, the global gains are estimated at $161 billion, with a little over a quarter of these gains ($43.7 billion) accruing to developing countries.
Concluding comments
In this initial assessment, we first considered the features of the current draft modalities. On the basis of our reading of these texts, and predictions of the likely implications of flexibilities, we assessed the consequences for applied tariffs. Finally, we considered the implications of reform for economic welfare.
When considering the tariffs levied by individual countries, we found that the formulas discussed in the modalities would – in the absence of flexibilities – result in substantial reductions in applied tariffs in the industrial countries. In agriculture, the reduction in WTO developed-country tariffs would be by a factor of two, from 15.4% to 7.0%. While they may be needed to secure an agreement, the sensitive product provisions appear to result in a substantially smaller cut in these tariffs, and result in a final tariff of 10.4%. In NAMA, initial average tariffs in the industrial countries are low, although they include peak tariffs on products of particular interest to developing countries. The formula results in a cut from 1.7% to 1.0%, with no flexibilities allowed.
In developing countries, the cut in applied agricultural tariffs implied by the formula is much smaller, with the average falling from 13.7% to 11.2%. When flexibilities for particular country groups and for special and sensitive products are included, the average post-cut tariff is 13.6%. NAMA tariffs decline from 4.8% to 3.6% when the formula is applied without flexibilities. When flexibilities are factored in, the cut is from 4.8% to 4.2%.
In terms of tariffs faced, most countries would see significant reductions in the agricultural tariffs they face if the formulas were implemented without exceptions. Worldwide, the average agricultural tariff would fall from 14.6% to 9.2%. Allowing for exceptions increases the final tariff to 12.1%. Most of this increase is accounted for by the sensitive product flexibilities for industrial countries, rather than by the more comprehensive flexibilities allowed to developing countries – these flexibilities have more impact because they are implemented in a context of deeper formula cuts. Most countries see reasonably significant changes in the tariffs they face, with the smallest reductions in countries such as LDCs that benefit from preferences in the industrial countries, and see small tariff reductions in their developing-country partners. Therefore, the initiative within the Doha Agenda to provide Duty-Free and Quota Free market access is potentially quite important as a means to deliver real market access gains for these countries.
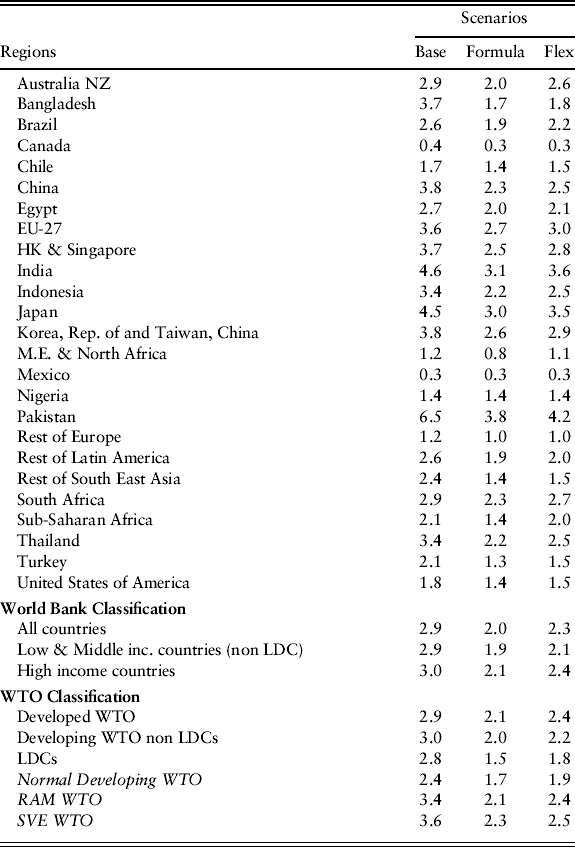
In NAMA, the average tariff levels are considerably lower. If the formulas were implemented without exceptions, most countries would see substantial reductions in the tariffs they face, with the world-wide average tariff falling from 2.9% to 2.0%. In this case, flexibilities are confined to developing countries, and result in the final tariff of 2.1% without flexibilities and 2.4% when they are factored in. A number of developing countries, such as Pakistan and Sri Lanka, face much larger initial tariffs and experience much larger than average reductions in the barriers they face even when the effects of the flexibilities are taken into account.
Considering agriculture and non-agriculture together, the applied tariffs facing developing countries would fall by around 36% – from 3.8% – if the formulas were implemented without exceptions. The final tariff rises to 2.9% once flexibilities are introduced, for an overall reduction of 24%. The gain to the industrial countries is broadly similar. These final percentage reductions in applied rates are in the same order of magnitude as the 36% reductions sought in tariff bindings during the Uruguay Round but are of potentially greater impact because they are associated with reductions in tariff peaks and in the uncertainty about market access opportunities not measured in these averages. The key question is whether these gains in market access will be sufficient to outweigh the political pain associated with reductions in countries’ own protection.
We estimate that the potential global welfare gains from an agreement using the tariff-reduction formulas under discussion would be roughly a third of those from full liberalization. These gains are very sharply reduced – to under a fifth of the total potential gains – once the exceptions to the formulas are introduced. The reduction associated with the flexibilities is particularly marked for the developing countries, whose gains decline to only $22 billion per year when using conventional trade-weighted-average measures. When we take account of the aggregation problem that has led to under-estimation of the welfare gains in earlier studies of this type, the estimated welfare gains from all liberalization scenarios are substantially higher. The global gains from Doha-type reform – even with exceptions – rise to $160 billion per year under the most price-responsive case considered. The gains to developing countries increase particularly strongly in this case, from $22 billion to $44 billion per year.
Appendix: Details of the tariff cuts in the analysis
In this appendix, we consider the implications of the tariff formulas for the weighted-average tariffs levied and faced by each country and/or composite region used in the analysis.
Tariffs levied
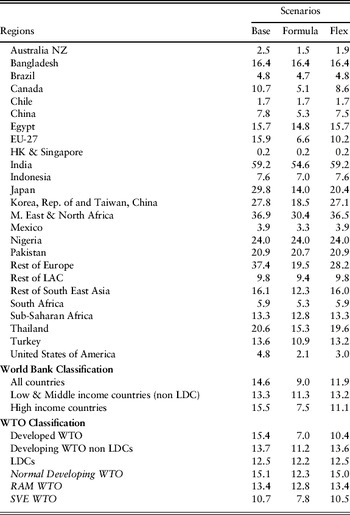
In Table A.1, we see that the formulas applied without exceptions (Formula) would result in a decline from 14.6% to 9% in average applied agricultural tariffs worldwide. In the WTO developed countries, the result is a cut of over 50% in applied rates, from 15.4% to 7.0%. In WTO developing countries other than the LDCs, the reduction is from 13.7% to 11.2%, a cut which is smaller than in the industrial countries partly because of key features of the formula – the smaller cuts and higher tier boundaries laid out in Table 1 – and greater binding overhang in many developing countries.
Without exceptions, the cut in the EU 27 applied agricultural tariff is from 15.9% to 6.6% – a cut of almost 60% of its initial value. In the United States, the corresponding cut is from 4.8% to 2.1% – a reduction of 56% from its initial value. The cut in Japan's average applied agricultural tariff is almost 16 percentage points, from 29.8% to 14% – a reduction of over 50% from its initial level. The impact of the basic developing-country formula on applied rates differs considerably depending upon the initial level of binding overhang. In India, the formula would reduce average tariffs by almost 8% of their initial level, while, in China, the reduction would be from 7.8% to 5.3%, a cut of 32%. By contrast, in many former GATT Contracting Parties, such as Brazil and Nigeria, binding overhang means that the full formula, without exceptions, would result in very small cuts in average applied rates.
The flexibilities for countries and commodities included in the Flex scenario more than halve the worldwide cut in tariffs, from 5.6% under the Formula to 2.7%. Interestingly, it is in the high-income countries that the tariff cut is reduced the most – with the tariff cut after flexibilities declining from 8 percentage points to 4.4 percentage points. Given the much smaller cuts required by the developing-country formula, the flexibilities have a smaller impact on the size of the tariff cut required than for the industrial countries. In low- and middle-income, non-LDC countries, the flexibilities reduce the cut from 2 to 0.1 percentage points.
The country groups based on World Bank and WTO definitions frequently have different average outcomes. The group of countries classified as ‘developed’ at the WTOFootnote 9 has larger tariff cuts than the high-income countries as defined by the World Bank, because some high-income countries, such as the Republic of Korea in agriculture, may choose developing-country status at the WTO to reduce the cuts in their tariffs.
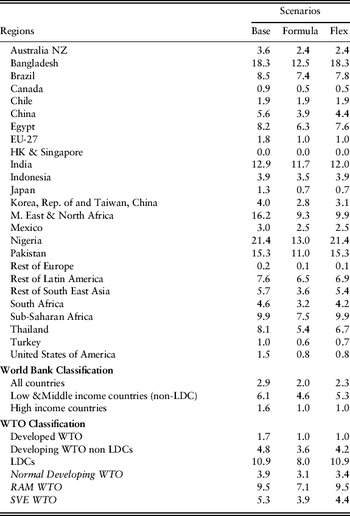
Looking at the results for NAMA in Table A.2, the cut in world average tariffs if the formulas were applied without exceptionsFootnote 10 is from 2.9% to 2.0%. In the high-income countries, the reduction is from 1.6% to 1.0%. In non-LDC low- and middle-income countries, the reduction is estimated to be from 6.1% to 4.6%, a cut of four-tenths of the original tariff. In some developing countries, such as Bangladesh, Pakistan, and Thailand, application of the formula alone would appear to result in substantial cuts in average tariffs. When we consider the group of countries that would apply the standard developing-country formula – that is a group excluding LDCs, RAMs, and SVEs- the reduction in tariffs is from 3.9% to 3.1%, a cut of 0.8 percentage points.
Implementing the exceptions is found to reduce the size of the cut for developing countries as a group by 0.3 percentage points, as well as to allow countries the flexibility to choose a pattern of tariffs more consistent with their policy preferences.
Average tariffs levied on WTO agricultural products by scenario, %

Average tariffs levied on WTO non-agricultural products by scenario,%

Tariffs Faced
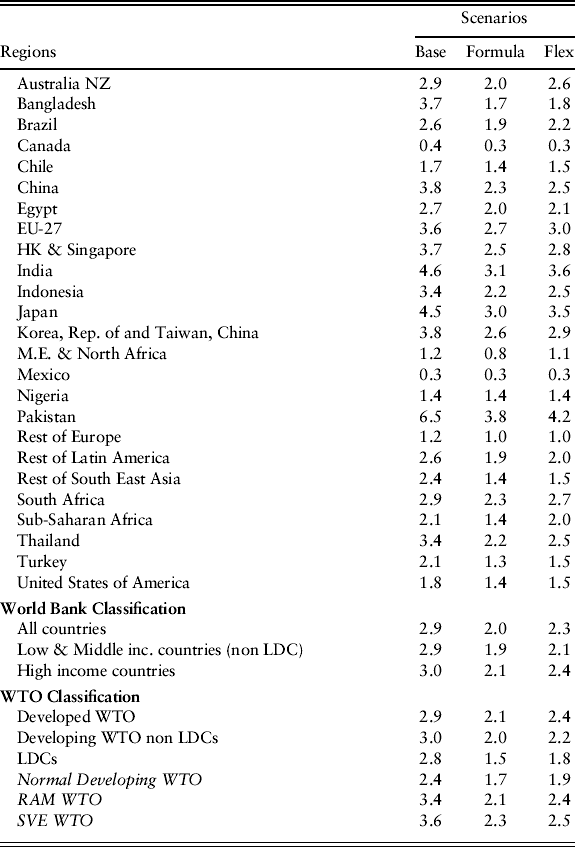
Tables A.3 and A.4 show some quite substantial reductions in the tariffs facing WTO members. Table A.3 shows that the average tariff facing agricultural exporters would decline by more than one-third – from 14.6 to 9.0% – through application of the formula without exceptions (Formula). The reduction in the tariff facing industrial countries is quite similar to that facing developing countries – 5.8 percentage points in the former and 5.7 in the latter. Even in the LDCs, for whom preference erosion diminishes the gains from market access, the average tariff barrier faced falls from 7.4% to 6.5%. Under this scenario, the RAMs and SVEs would benefit from particularly large reductions in the unusually high tariff barriers they face. In some specific cases, such as Australia, Brazil, China, Pakistan and Thailand the benefits from reductions in tariffs faced would be even larger. For Thailand, the reduction in agricultural tariffs faced would be over 10 percentage points.
In Scenario Flex, where flexibilities are incorporated, the reductions in tariffs are much smaller, with the reduction in global agricultural tariffs declining from a potential 5.6 under the Formula alone to 2.7 percentage points. Part of this reduction in the tariff cut comes from the sensitive and Special Product flexibilities used by developing countries. The ‘pain’ in terms of lost market access is spread between the industrial and developing countries, with the average tariff facing both the high income countries and developing countries rising by 2.9 percentage points.
In NAMA, the average barrier falls from 2.9% to 2.0% for the world as a whole when the formulas are implemented without exceptions. For the high income countries, this reduction is 0.9 percentage points, from 3.0 to 2.1%, while the reduction for non LDC developing countries as a group is 1%. For LDCs, which face tariff peaks despite preferences, the reduction in the tariff they face is larger, at 1.3 percentage points. Pakistan benefits from a particularly large reduction in the average tariff it faces from 6.5% to 3.8%.
Partly because the industrial countries have no flexibilities, and partly because the flexibilities for developing countries are subject to meaningful disciplines, the flexibilities in NAMA do less damage to market access than in the case of agriculture. For the high-income countries, the tariff after application of the formula increases from 2.2% to 2.4%, but remains below its original 3.0%. For developing countries, the corresponding increase is from 1.9% to 2.1%, which remains well below its initial level of 2.9%.
The cuts facing particular countries sometimes change in very different ways. While the reductions in the average NAMA tariff facing the United States are modest – at 0.3 percentage points or 17% of the initial tariff faced – this is not primarily because of the flexibilities. Even without the flexibilities, the cut was only 0.4 percentage points. This suggests that the cuts are small largely because of the prevalence of low tariffs, which are subject to smaller cuts under the Swiss formula. For Bangladesh, which faces some very high tariffs on products such as clothing, by contrast, the average tariff faced is cut by more than half its initial level even after allowing for the flexibilities.
Average tariffs facing exports of agricultural products, %

Average tariffs facing exporters of non-agricultural goods, %