Introduction
The measured hardness of a metal crystal depends on both the intrinsic and extrinsic length scales concerned [Reference Greer and De Hosson1, Reference Bushby and Dunstan2, Reference Pharr and Oliver3]. The intrinsic length scale of a material is governed by the size of the features within its microstructure. Extrinsic length scales arise from the specific nature of the conditions used for the hardness test. In cantilever beam tests and pillar compression tests, the extrinsic length scale is typically the dimensions of the specimen itself. In hardness measurements, the extrinsic length scale is typically the indentation depth or the radius of the indenter. For flat punch indentations, it is a mixture of both [Reference Campbell and Gill4]. The indentation size effect (ISE) is an experimentally observed phenomenon, in which the measured hardness of a material is found to increase as the extrinsic length scale decreases. Nix and Gao [Reference Nix and Gao5] first proposed a model to explain this behavior based on forest hardening due to the presence of geometrically necessary dislocations (GNDs). These are dislocations that are required to accommodate the plastic strain gradients within a crystal. The shear yield stress is assumed to be
 $${\tau _{\rm{Y}}} = {\beta _{\rm{D}}}Gb\sqrt \rho \quad ,$$
where G is the shear modulus of the material, b is the magnitude of the Burgers vector, and βD is a dimensionless parameter, which represents the strengthening contribution due to dislocation hardening. The total dislocation density, ρ = ρS + ρG, is assumed to be the sum of a constant statistically stored dislocation (SSD) population of density ρS, and a locally evolving population of GNDs, ρG, derived from the plastic strain gradient. The size-dependent hardness of the material is then expressed as follows:
 $$H = 3\sqrt 3 {\tau _{\rm{Y}}} = {H_0}\sqrt {1 + {{{\rho _{\rm{G}}}} \over {{\rho _{\rm{S}}}}}} \quad ,$$
where  ${H_0} = 3\sqrt 3 {\beta _{\rm{D}}}Gb\sqrt {{\rho _{\rm{S}}}}$ is the macroscopic hardness. GNDs are required to form the numerous surface steps of height b that accommodate the shape of the plastic indent. The number of surface steps (and hence GNDs) is readily determined from the slope of the indenter profile if the contribution from elastic deformation is ignored.
Nix and Gao [Reference Nix and Gao5] derived a model for the ISE for a self-similar (pointed) indenter. Assuming a conical shape with internal angle θ to the horizontal, the GND density is found to be  ${\rho _{\rm{G}}} = {{3\;{{\tan }^2}\;\theta } \over {2bh}}$. Equation (2) then gives the widely adopted expression:
 $$H = {H_0}\sqrt {1 + {{{h^*}} \over h}} \quad ,$$
where h is the indentation depth and  ${h^*} = {{3\;{{\tan }^2}\;\theta } \over {2b{\rho _{\rm{S}}}}}$ depends on the SSD density [Reference Nix and Gao5]. This analysis was later extended to spherical indenters by Swadener et al. [Reference Swadener, George and Pharr6] for which an entirely different scaling behavior is predicted. For a spherical indenter of radius R, the GND density
 ${\rho _{\rm{G}}} = {1 \over {bR}}$ is independent of the indentation depth, such that Eq. (2) becomes
 $$H = {H_0}\sqrt {1 + {{{R^*}} \over R}} \quad ,$$
where  ${R^*} = {1 \over {b{\rho _{\rm{S}}}}}$.
Equations (3) and (4) have been successfully adopted to model the ISE in many material systems [Reference Pharr, Herbert and Gao7]. However, there are a few major shortcomings of this approach. The intrinsic material length scale due to dislocation spacing is included, but the effects of other material length scales, such as grain size, precipitate size, and solid solution element spacing are not. Equation (4) assumes the existence of a constant dense population of SSDs with which the GNDs interact but which is commonly not observed. The hardness is also unphysically predicted to be infinite as the extrinsic length scale tends to zero. These issues are addressed in the following analysis. Section “Intrinsic material length scales and plasticity” introduces the concept of intrinsic length-scale plasticity beyond just forest hardening. Intrinsic and extrinsic length scale enabled hardness models are then derived based on this concept in “A hardness model with intrinsic and extrinsic length scales” section. These are shown to reduce to Eqs. (3) and (4) in the limit, where the only strengthening mechanism is forest hardening as expected. The models are used to analyze hardness data from the literature in “Validation against published results” section in a variety of different cases, with the final case demonstrating how the effective intrinsic length scale of a material can be extracted from a series of spherical indentation tests across different indentation depths and indenter sizes.
Intrinsic material length scales and plasticity
Dislocation lines moving within a crystal structure are hindered by microstructural obstacles. These obstacles can be roughly classified by their dimensionality: solute atoms (0D), dislocations (1D), grain boundaries (2D), and precipitates (3D) [Reference Ehrler, Dunstan, Zhu, Hou, P’ng and Bushby8, Reference Gladman9, Reference Morris10, Reference Zhu, Bushby and Dunstan11]. For a dislocation to overcome an obstacle and “escape,” it requires a critical shear stress, τc, known as the Orowan stress [Reference Zhu, Bushby and Dunstan11] equivalent to
 $${\tau _{\rm{c}}} = \beta {{Gb} \over L}\quad ,$$
where L is the distance between the obstacles and β is a mechanism-dependent strengthening factor [Reference Ehrler, Dunstan, Zhu, Hou, P’ng and Bushby8, Reference Zhu, Bushby and Dunstan11, Reference Ehrler, Hou, Zhu, P’ng, Walker, Bushby and Dunstan12, Reference Greer and Nix13, Reference Lefebvre, Devincre and Hoc14, Reference Dunstan, Ehrler, Bossis, Joly, P’ng and Bushby15]. The intrinsic material length scales of a crystal are divided into two categories. Three of the obstacle types, dislocations, solute atoms and precipitates, are classed as bypassable. This is because dislocations can get past them if the stress is high enough. As grain boundaries completely contain a dislocation, they are considered to be not bypassable. Note that the Hall–Petch relationship can be classically derived in two different ways: one through the assumption of forest hardening of grains, which assumes dislocations remain within a grain and multiply to accommodate the applied shear strain, and one which looks at the critical stress required to be produced by a pile-up of dislocations at a grain boundary to promote slip in an adjacent grain [Reference Morris10]. This paper adopts the former approach, consistent with the assumption of boundaries as non-bypassable objects, although this assumption it is not considered critical to this derivation, as both approaches give the same inverse root grain size dependency. Forest (or Taylor) hardening depends on the average spacing between dislocations,  ${L_{\rm{D}}} = {1 \over {\sqrt \rho }}$, where ρ is the dislocation density. This is assumed to be the only material length scale that changes during plastic deformation and leads directly to Eq. (1). Solid solution strengthening depends on the average spacing between solute atoms. This is taken to be
 ${L_{\rm{S}}} = {1 \over {{c^n}}}$, where c is the solute strengthening element concentration and n can be either
 ${1 \over 2}$ for dilute concentrations or
 ${2 \over 3}$ for higher concentrations [Reference Morris10, Reference Jones and Ashby16, Reference Labusch17]. Precipitation hardening depends on the mean spacing between precipitates. If these are assumed to be spherical, then it is reasonable to assume that
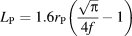 ${L_{\rm{P}}} = 1.6{r_{\rm{P}}}\left( {{{\sqrt \pi } \over {4f}} - 1} \right)$, where r p is the mean radius of the precipitate and f is the volume fraction of precipitates [Reference Atkinson, Gill, Shirzadi and Jackson18]. The contributions from these three stress hardening mechanisms are combined by taking the average effective spacing between the whole field of obstacles, L τ, such that the total shear yield stress is
 $${\tau _{\rm{Y}}} = {\tau _0} + {{Gb} \over {{L_\tau }}}\quad ,$$
where the additional intrinsic (friction) strength of the crystal, τ0, has been introduced. If the width of the obstacles is ignored, the average spacing between them is inversely proportional to their number density. The total number density of obstacles is therefore proportional to  $L_\tau ^{ - 1} = L_{\rm{D}}^{ - 1} + L_{\rm{S}}^{ - 1} + L_{\rm{P}}^{ - 1}$ [Reference Ehrler, Hou, Zhu, P’ng, Walker, Bushby and Dunstan12]. Each type of obstacle has a different level of effectiveness in blocking dislocation movement. Therefore, in practice, each mechanism is weighted accordingly such that the effective length scale is actually taken to be
 $${1 \over {{L_\tau }}} = {{{\beta _{\rm{D}}}} \over {{L_{\rm{D}}}}} + {{{\beta _{\rm{S}}}} \over {{L_{\rm{S}}}}} + {{{\beta _{\rm{P}}}} \over {{L_{\rm{P}}}}}\quad ,$$
where βS = 0.01–0.05, βD = 0.1–0.3, and βP = 0.5–0.8 are the estimated range of values for the strengthening factors for solid solution strengthening, forest hardening, and precipitate hardening, respectively [Reference Morris10]. The actual value of βi depends on the properties of the material, the distribution of obstacles, and the size of the obstacle, e.g., βP will be reduced if the precipitate size is too small to prevent precipitates being “by-passed” by cutting. Other methods than (7) have been proposed for combining strengthening contributions, principally root mean squared approaches when the length scales are similar [Reference Queyreau, Monnet and Devincre19].
The contribution from grain size strengthening is still to be introduced. The grain diameter, d, does not appear directly in (7) because grain boundaries are not bypassable obstacles in the Orowan sense. This hardening contribution to (6) must therefore be associated with the dislocation spacing as this is the only length scale that can change during deformation. This will be considered in “A hardness model with intrinsic and extrinsic length scales” section.
A hardness model with intrinsic and extrinsic length scales
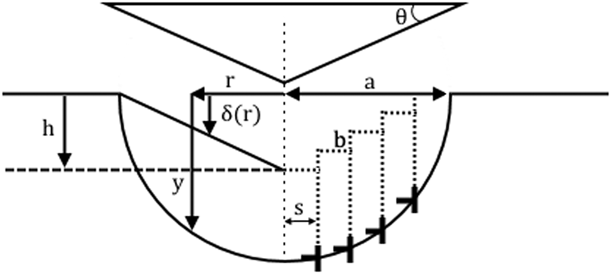
The hardness model is initially developed for an indenter of general shape and then later explicitly derived for the two cases of self-similar and spherical indenters. The surface profile of the plastic indent is assumed to be commensurate with that of the indenter itself. The indent profile is assumed to be axisymmetric and defined by the indentation depth function, δ(r), a function of the horizontal radial distance r, as shown in Fig. 1. For the conceptual purposes of this derivation, it is assumed that GNDs are injected downward from the surface beneath the indenter during deformation [Reference Rester, Motz and Pippan20]. GNDs are necessary to create the atomic steps that form the plastic indent profile. In practice, GNDs may nucleate below the surface and move upward to form the steps, but this does greatly affect the conclusions of the model. Following Nix and Gao [Reference Nix and Gao5], the plastic zone beneath the indenter is assumed to be a hemisphere whose radius is the contact radius of the indenter, a, defined by δ(a) = 0. A number of authors have shown that the radius of the plastic region is in fact larger than the contact radius. Durst et al. [Reference Durst, Backes and Göken21], for instance, amended Nix–Gao using the assumption that the plastic zone radius is related to the contact radius a pz = f aa, where the scaling factor can be in the range of f a = 0.5–3.5. The profile of the indentation defines the distance, s, between surface steps of height b to be
 $${1 \over {s\left( r \right)}} = - {1 \over b}{{{\rm{d}}\delta } \over {{\rm{d}}r}}\quad .$$
The residual indentation profile in a substrate due a self-similar (conical) indenter after indentation and retraction.

A circular surface step of height b at radius r will generate a GND with a line length of l = 2πr. This is assumed to travel to the perimeter of the plastic zone, to a depth below the original reference surface y. For a hemispherical plastic zone of radius a, we have r 2 + y 2 = a 2. The dislocation line density due to a single GND at radius r can be described by the following equation:
 $${\rho _{\rm{G}}}\left( r \right) = {l \over V} = {1 \over {s\left( r \right)y\left( r \right)}}\quad ,$$
where each of the dislocation line loops of length l injected from the surface are contained within a thin hollow cylinder of radius r, thickness s, and depth y, such that the volume is V = 2πrsy. The average dislocation density is taken to be
 $${\bar{\rho }_{\rm{G}}} = {1 \over {\bar{s}\bar{y}}}\quad ,$$
where  $\bar{y}$ is the average depth of the hemispherical plastic zone,
 $$\bar{y} = {1 \over {\pi {a^2}}}\int_0^a {2\pi ry{\rm{d}}r} = {{2a} \over 3}\quad ,$$
given rdr = −ydy, and the average step spacing  $\bar{s}$ is determined from the indenter profile.
Utilization of Eq. (10) generates the standard Nix–Gao models for single crystalline pure metals as expected. Here, we make two adaptations to account for the nanoindentation response of polycrystalline alloys. First, it is assumed that GNDs cannot freely travel from the surface to a depth y in the presence of obstacles. As a dislocation of length l moves through an array of obstacles, it is assumed that an additional dislocation length αl will be created. If the obstacles are an average (vertical) distance  $\bar{L}$ apart, then the volume they occupy is
 $2\pi rs\bar{L}$. These will be SSDs, such that the average SSD density will become
 $${\bar{\rho }_{\rm{S}}} = {\alpha \over {\bar{s}\bar{L}}}\quad .$$
For a combination of different obstacles, we follow the same process as (7) and write the effective intrinsic length scale due to strain hardening as follows:
 $${1 \over L} = {{2{\alpha _{\rm{G}}}} \over d} + {{{\alpha _{\rm{D}}}} \over {{L_{\rm{D}}}}} + {{{\alpha _{\rm{s}}}} \over {{L_{\rm{S}}}}} + {{{\alpha _{\rm{P}}}} \over {{L_{\rm{P}}}}}\quad .$$
The first term on the right hand side contributes to grain size strengthening and assumes that the mean free path of a dislocation within a grain is equivalent to its radius,  ${1 \over 2}d$. Note that, when combined with (15), the strengthening effect of grain boundaries conforms to the Hall–Petch relationship,
 ${1 \over {\sqrt d }}$. It is assumed that dislocations cannot cross grain boundaries and that a new dislocation must be generated to further accommodate the deformation. For this reason, we expect that αg ≈ 1, although we note that the mean length of a random cut through a spherical grain of diameter d is
 ${{2d} \over 3}$ [as in Eq. (11)], suggesting values of αG up to 1.5 are not physically unreasonable. The effectiveness of the other obstacles in contributing to strain hardening is expected to follow the order predicted for the stress hardening factors, βi, such that αG > αP > αD > αs. A first initial estimate of αi ≈ βi would appear to be reasonable, although small obstacles such as solute atoms can be by-passed without significant dislocation multiplication (through the motion of jogs), suggesting that αs ≪ βS. Also, dislocation multiplication due to movement past precipitates is likely to be related to the particle size. Overall, we have
 $$\rho = {\bar{\rho }_{\rm{G}}} + {\bar{\rho }_{\rm{S}}} = {\rho _{{\rm{s0}}}} + {1 \over {\bar{s}}}\left( {{3 \over {2a}} + {1 \over L}} \right)\quad ,$$
where ρs0 is the initial SSD density in the material and a and L are the extrinsic and intrinsic length scales, respectively. The indenter shape defines  $\bar{s}$ and will be determined later.
From (2) and (14), we can therefore write
 $$H = {H_{{\rm{SP0}}}} + {H_{\rm{D}}}\sqrt {1 + {1 \over {{\rho _{{\rm{s0}}}}\bar{s}}}\left( {{3 \over {2a}} + {1 \over L}} \right)} \quad ,$$
where  ${H_{\rm{D}}} = 3\sqrt 3 Gb{\beta _{\rm{D}}}\sqrt {{\rho _{{\rm{s0}}}}}$ is the hardness contribution from dislocation (forest) hardening and
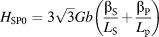 ${H_{{\rm{SP0}}}} = 3\sqrt 3 Gb\left( {{{{\beta _{\rm{S}}}} \over {{L_{\rm{S}}}}} + {{{\beta _{\rm{P}}}} \over {{L_{\rm{p}}}}}} \right)$ is the contribution from the intrinsic strength of the crystal and solute and precipitate hardening.
Before proceeding further, it is worth noting the Nix–Gao model (3) and (4), as well as (15), predict that the dislocation density tends toward infinity as the contact area tends to zero. This is not physically reasonable. Here, we avoid this problem by restricting the maximum dislocation density that can occur in a crystal to a fixed value, ρmax. An upper bound of the estimates for this value must be  ${\rho _{{\rm{max}}}} \ll {1 \over {{b^2}}} = 16 \times {10^{18}}\;{{\rm{m}}^{ - 2}}$ for b = 0.25 nm, as this represents the (impossible) scenario of a dislocation at every atomic site. Hence, it is typically assumed here that ρmax = 1015–1016 m−2 is the expected range. If we have two lengths, x and y, then we can approximate the maximum of these two values using
 $\max \left( {x,\;y} \right) \approx {\left( {{x^n} + {y^n}} \right)^{{1 \over n}}}$ for n > 1, where the approximation becomes exact as n → ∞. Here, we replace the dislocation spacing
 ${L_{\rm{D}}} = {1 \over {\sqrt \rho }}$ by
 $${L_{\rm{D}}} = \max \left( {{1 \over {\sqrt \rho }},\;{1 \over {\sqrt {{\rho _{\max }}} }}} \right) \approx \sqrt {{1 \over \rho } + {1 \over {{\rho _{\max }}}}} \quad ,$$
where we have taken n = 2 as a weaker approximation of the maximum value to allow for statistical variations. Huang et al. [Reference Huang, Zhang, Hwang, Nix, Pharr and Feng22] proposed a two-stage model, which effectively took a sharp maximum, i.e., n = ∞. The forest hardening term, ρ/ρs0, is therefore replaced in (2) by 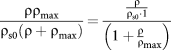 ${{\rho {\rho _{\max }}} \over {{\rho _{{\rm{s0}}}}\left( {\rho + {\rho _{\max }}} \right)}} = {{{\rho \over {{\rho _{{\rm{s0}}}} \cdot 1}}} \over {\left( {1 + {{{\rho \over \rho }}_{\max }}} \right)}}$. With (14) and assuming that ρs0 ≪ ρmax, we can therefore modify (15) to account for very small indentation effects:
 $$H = {H_{{\rm{SP0}}}} + {H_{\rm{D}}}\sqrt {1 + {{{1 \over {{\rho _{{\rm{s0}}}}\bar{s}}}\left( {{3 \over {2a}} + {1 \over L}} \right)} \over {1 + {1 \over {{\rho _{\max }}\bar{s}}}\left( {{3 \over {2a}} + {1 \over L}} \right)}}} \quad .$$
Equation (17) is now evaluated for two different types of indenter profile, self-similar and spherical.
(i) Self-similar indenters.
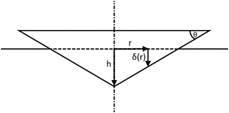
In this case, the indenter is assumed to be conical in shape, although this method is relevant to the analysis of any pointed indenter with a constant slope. The geometry is shown in Fig. 2 and is defined by the function δ(r) = h − r tan θ, where h is the maximum indentation depth, θ is the indenter angle, and r is the radial distance from the axis of symmetry of the indenter.
Idealized profile of a self-similar (conical) indent after indentation to a depth h into the surface.
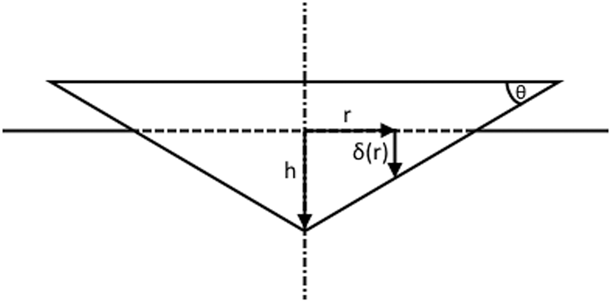
Equation (8) yields
 $${1 \over s} = {{\tan \;\theta } \over b} = {1 \over {\bar{s}}}\quad .$$
Noting that  ${h \over a} = \tan \;\theta$ means that substituting (18) into (17) gives the full expression for the ISE for a self-similar indenter as
 $$H = {H_{{\rm{SP0}}}} + {H_{\rm{D}}}\sqrt {1 + {{{{{h^*}} \over h} + {{{L^*}} \over L}} \over {1 + {{{h_0}} \over h} + {{{L_0}} \over L}}}} \quad ,$$
where  ${h^*} = {{3\;{{\tan }^2}\;\theta } \over {2b{\rho _{{\rm{s0}}}}}}$ is the Nix–Gao parameter as usual,
 ${h_0} = {{{\rho _{{\rm{s0}}}}} \over {{\rho _{\max }}}}{h^*}$ is another fitting parameter, and the two other lengths are simply related to these two parameters by
 ${L^*} = {2 \over {3\;\tan \;\theta }}{h^*}$ and
 ${L_0} = {2 \over {3\;\tan \;\theta }}{h_0}$.
It is worth noting at this stage that (19) can be rewritten as follows:
 $$H = {H_{{\rm{SP0}}}} + {\hat{H}_{\rm{D}}}\sqrt {1 + {{{{\hat{h}}^*}} \over {h + {{\hat{h}}_0}}}} \quad ,$$
where  ${\hat{H}_{\rm{D}}} = {H_{\rm{D}}}\sqrt {{f \over e}}$,
 ${\hat{h}^*} = e{h^*} + \left( {e - f} \right){h_0}$, and
 ${\hat{h}_0} = f{h_0}$ with
 $e = {L \over {L + {L^*}}}$ and
 $f = {L \over {L + {L_0}}}$. If the intrinsic material length scale L and the indenter angle θ are constant across all tests to be analyzed, then (19) can be written in the same form as (20) with the length scale removed (i.e., L → ∞). This indicates that self-similar indenters cannot be used to uniquely differentiate the intrinsic length scale L from the hardness of a material under these test conditions.
(ii) Spherical indenters.
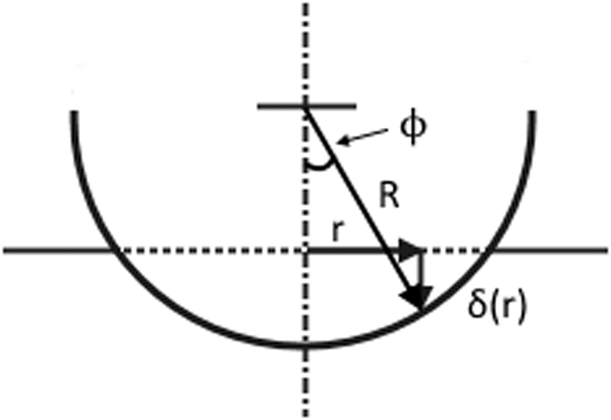
Figure 3 shows the geometry for a spherical indenter of radius R. The indenter contact radius is defined by  $a = \sqrt {2Rh - {h^2}} \approx \sqrt {2Rh}$, assuming that the indentation depth h ≪ R.
Geometry for a spherical indent.

Equation (8) yields
 $${1 \over s} = {r \over {b\sqrt {{R^2} - {r^2}} }} \approx {r \over {bR}}\quad ,$$
giving an average surface step spacing of
 $${1 \over {\bar{s}}} = {1 \over {\pi {a^2}}}\int_0^a {2\pi r \cdot {r \over {bR}}} = {{2a} \over {3bR}}\quad .$$
Using (22) in Eq. (17) then provides the full expression for the hardness measured by spherical indenters:
 $$H = {H_{{\rm{SP0}}}} + {H_{\rm{D}}}\sqrt {1 + {{{{{R^*}} \over R}\left( {1 + {{2a} \over {3L}}} \right)} \over {1 + {{{R_0}} \over R}\left( {1 + {{2a} \over {3L}}} \right)}}} \quad ,$$
where  ${R^*} = {1 \over {b{\rho _{{\rm{s0}}}}}}$ is the usual Nix–Gao parameter and
 ${R_0} = {1 \over {b{\rho _{\max }}}}$.
Validation against published results
In this section, the predictions of the proposed models are tested against data from the literature. The full expressions for the hardness of polycrystalline alloy samples are given in Eqs. (20) and (23) for self-similar and spherical indenters, respectively. These equations are simple enough to give practical and physical interpretation of many features of hardness test results. However, (20) and (23) can also generally be simplified for a given situation, where a particular mechanism dominates. A number of such subcases are considered in this section. Unlike the basic Nix–Gao equations, the proposed hardness functions do not typically allow for a selection of plotting axes that allow for a simple linear fit to the data. Hence, nonlinear regression analysis is performed using the Excel Solver function to find the best fit of the model parameters to the data.
Hardness of single crystals with intrinsic strength for a self-similar indenter
The Nix–Gao model for self-similar indenters (3) has been very successful in interpreting experimental hardness data, particularly for single crystalline metals. This model assumes that there is a population of SSDs of density ρs0 in the crystal, which the GNDs, generated by the plastic indentation process, interact with. However, the preexisting dislocation density in these samples (typically annealed) is low. Here, the consequences of assuming that the SSD dislocation population is small (ρs0 ≈ 0) are examined in this context. In this case, (20) can be simplified to
 $$H = {H_{{\rm{SP0}}}} + {A \over {\sqrt h }}\quad ,$$
where 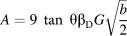 $A = 9\;\tan \;\theta {\beta _{\rm{D}}}G\sqrt {{b \over 2}}$ and
 ${H_{{\rm{SP0}}}} = 3\sqrt 3 {\tau _0}$. For a pure metal, the intrinsic material length scale is very large (L → ∞), and it is assumed that GND saturation is not reached (ρmax → ∞). Figure 4 compares the best fit of the standard Nix–Gao model (3) and Eq. (24) with single crystal copper data, where the grain size was large compared with the indent. It is interesting to note that (24) provides a slightly better fit to the data than (3) and that the principal difference between the two models is in the macroindentation regime [near the origin in Fig. 4(b)], where (24) extrapolates to a lower macroscale hardness than (3).
Comparing a forest hardening model (3) against an intrinsic hardening model (24) with hardness ISE data for annealed single crystalline copper [Reference McElhaney, Vlassak and Nix23]. (a) H versus h, and (b) H 2 versus  ${1 \over h}$.
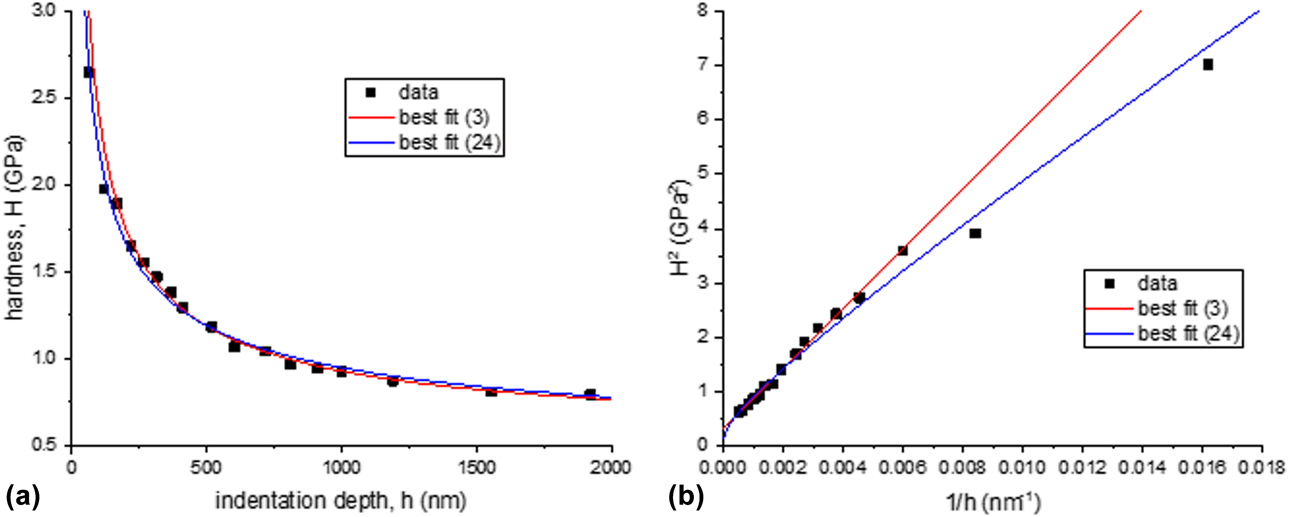
Best fits are obtained for (3) with h* = 1.78 μm and H 0 = 0.56 GPa. Given the definitions of these parameters in (3), and taking G = 48 GPa, b = 0.25 nm, and θ = 25°, then yields ρs0 = 7 × 10¹⁴ m−2 and βD = 0.33. This is a high dislocation density, comparable to that found in a cold-worked sample [Reference Sousa, Sordi and Brandão24]. Typically, the dislocation densities found using (3) are high and often close to the maximum value expected ρmax. This is investigated further in “Hardness of single crystals with a maximum dislocation density for a self-similar indenter” section.
Best fits for (24) give H SP0 = 0.365 GPa and A = 18.5 GPa nm1/2 which predict that τ0 = 70 MPa and βD = 0.26 for the value for the intrinsic strength. The intrinsic strength is typically of the order of 1–3 MPa, so this fitting value is unphysically large. In practice, it is expected that both the intrinsic strength and the SSD population contribute to the hardening of materials. The conclusion shows that (3) and (24) are quite similar for typical hardness tests, although the physical constants the fitting parameters relate to are quite different. It is difficult to say if one approach is more valid than another on this basis. For the remainder of this analysis, only one of the (almost indistinguishable) curves will be shown, but the physical parameters relating to each fit will be quoted.
Hardness of single crystals with a maximum dislocation density for a self-similar indenter
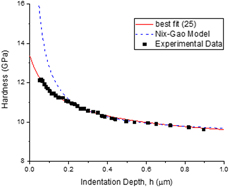
Figure 5(a) shows H versus h data for electropolished polycrystalline iridium with a grain size of 30 μm using a Berkovich indenter [Reference Pharr, Herbert and Gao7]. This is compared in Fig. 5(b) with the Nix–Gao Eq. (3), which predicts that a plot of H 2 versus  ${1 \over h}$ should be linear. It can be seen that this model works for larger scale indents (to the left) but fails at smaller test scales (on the right). Equation (20) is simplified to just include the effect of a maximum dislocation density ρmax, so that
 $$H = {H_{\rm{D}}}\sqrt {1 + {{{h^*}} \over {h + {h_0}}}} \quad ,$$
where we take L → ∞ again for a pure metal and follow Nix–Gao in ignoring strengthening effects not due to forest hardening (H SP0 = 0). This is identical in form to (20) indicating that, for self-similar indenters, (25) also applies to polycrystals as well as single crystals. The best fit of (25) in Fig. 5 shows that it captures the essential features of the material response much better than Eq. (3).
Hardness data as a function of indentation depth for iridium [Reference Pharr, Herbert and Gao7] for a Berkovich indenter comparing predictions of Eqs. (3) and (25). (a) H versus h, and (b) H 2 versus  ${1 \over h}$.

The Nix–Gao Eq. (3) gives H 0 = 2.2 GPa and h* = 3.48 μm, yielding predictions of ρs0 = 3.75 × 10¹⁴ m−2 and βD = 0.42 assuming G = 208 GPa for iridium.
Equation (25) is best fitted by H D = 2.47 GPa, h* = 1.97 μm, and h 0 = 150 nm. This yields a prediction of ρs0 = 6.6 × 10¹⁴ m−2, which is about 8% of the maximum value of ρmax = 8.75 × 10¹⁵ m−2.
To extend the comparison of “Hardness of single crystals with intrinsic strength for a self-similar indenter” section, if we assume that the initial strength is not due to forest hardening (ρs0 = 0), then (20) gives
 $$H = {H_{{\rm{SP0}}}} + {A \over {\sqrt {h + {{\tilde{h}}_0}} }}\quad ,$$
where  ${\tilde{h}_0} = {{3\;{{\tan }^2}\;\theta } \over {2b{\rho _{\max }}}}$. Equation (26) is best fitted when H SP0 = 1.83 GPa, A = 2.43 GPa nm1/2, and
 ${\tilde{h}_0} = 93\;{\rm{nm}}$. It is not shown in Fig. 5 as it is very close to the curve of (25). The theory then predicts that τ0 = 352 MPa, βD = 0.25, and ρmax = 1.40 × 10¹⁶ m−2.
An additional set of test data for single crystal MgO obtained using a Berkovich indenter, shown in Fig. 6, also supports this conclusion. Nix–Gao (3) gives H 0 = 9.3 GPa and h* = 90 nm, yielding predictions of ρs0 = 1.5 × 10¹⁶ m−2 and βD = 0.38 assuming G = 155 GPa for MgO. This indicative SSD density is very close to the maximum possible density expected.
Hardness data as a function of indentation depth for MgO [Reference Feng and Nix25] for a Berkovich indenter comparing predictions of Eqs. (1) and (25) for H versus h.

Equation (25) is best fitted by H D = 9.0 GPa, h* = 180 nm, and h 0 = 160 nm. This yields a prediction of ρs0 = 0.75 × 10¹⁶ m−2 with ρmax = 0.84 × 10¹⁶ m−2, suggesting that the initial SSD density is almost at the maximum dislocation density, a situation which is most unlikely.
Equation (26) is best fitted when H SP0 = 8.2 GPa, A = 1.45 GPa nm1/2, and  ${\tilde{h}_0} = 80\;{\rm{nm}}$. The theory predicts that τ0 = 1.58 GPa and ρmax = 1.6 × 10¹⁶ m−2. While the intrinsic strength is very high, the maximum dislocation density is physically reasonable without requiring an excessive residual SSD density. In practice, the macroscopic hardness will arise from a combination of SSDs and other strengthening mechanisms. This would require using all terms in Eq. (20), but as the two effects are hard to differentiate, a best fit between either of the two cases presented here is valid.
Hardness of polycrystals using a spherical indenter
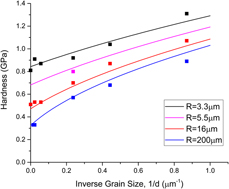
Hou et al. [Reference Hou, Bushby and Jennett26] have published hardness data for the spherical indentation of copper with different grain sizes. In this case, the intrinsic material length scale (grain size) is known but varies from sample to sample. Here, we model these data taking the minimum number of degrees-of-freedom required to capture the response, such that intrinsic strengthening (H SP0 = 0) and GND saturation (R 0 = 0) are ignored. In this case the full expression for spherical indentation hardness (23) can be simplified to
 $$H = {H_{\rm{D}}}\sqrt {1 + {{{R^*}} \over R}\left( {1 + {{2a} \over {3L}}} \right)} \quad .$$
Figure 7 shows the results of the best fit. The four curves are defined by (27) for a single set of parameters by minimizing the mean square error with the data across all four different indenter sizes simultaneously. In this case, the hardness is measured at a fixed strain of  ${a \over R} = 0.25$ and the intrinsic material length scale is taken to be
 ${1 \over L} = {{2{\alpha _{\rm{G}}}} \over d}$, where d is the measured grain size. An important feature of these hardness measurements is that the indent is positioned within the center of a grain. If the positioning is random, then the grain size can influence the hardness even if the indentation depth is very much less than d. The best fit parameters are H D = 309 MPa, R* = 21.3 μm, and αG = 1.41. It can be seen from Fig. 7 that (27) fits the data well. The value of αG ≈ 1 in line with expectation, given the variation in grain shape and the approximations with the model and the microstructural measurements. The values predict that ρs0 = 1.88 × 10¹⁴ m−2 and βD = 0.36. An equally good fit (not shown) can be achieved assuming intrinsic strengthening such that
 $$H = {H_{{\rm{SP0}}}} + \tilde{A}\sqrt {{1 \over R}\left( {1 + {{2a} \over {3L}}} \right)\quad ,}$$
where  $\tilde{A} = 3\sqrt 3 {\beta _{\rm{F}}}G\sqrt b$. The best fit is obtained when H SP0 = 0.18 GPa, A = 1.21 GPa µm1/2, and the intrinsic length scale factor αG = 1.45, similar to before. This predicts that τ0 = 35 MPa and βD = 0.31.
Hardness data for four differently sized spherical indenters as a function of the grain size in polycrystalline copper [Reference Hou, Bushby and Jennett26] compared with a fit from (27). The strain is fixed such that  ${a \over R} = 0.25$.

Hardness of a polycrystalline alloy with a maximum dislocation density using a spherical indenter
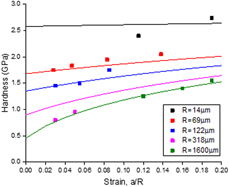
Swadener et al. [Reference Swadener, George and Pharr6] published data on indentation of a polycrystalline iridium alloy using a range of small indenter sizes. Unlike “Hardness of polycrystals using a spherical indenter” section, the intrinsic material length scale in this case is the same for all indents. This is therefore now a fitting parameter to be determined and compared with microstructural observations. For the analysis of these data, we initially ignore strengthening mechanisms in (23) to write
 $$H = {H_0}\sqrt {1 + {{{{{R^*}} \over R}\left( {1 + {{2a} \over {3L}}} \right)} \over {1 + {{{R_0}} \over R}\left( {1 + {{2a} \over {3L}}} \right)}}} \quad .$$
The best simultaneous fit for the suite of five curves for different indenter radii is shown in Fig. 8. This is achieved for H 0 = 0.21 GPa, R* = 6.0 mm, R 0 = 26 μm, and L = 12.5 μm. These values predict that ρs0 = 6.7 × 10¹¹ m−2, ρmax = 1.5 × 10¹⁴ m−2, and βD = 0.95. The latter is a larger value than expected as is the value of R*. This may be due to increased scatter in the hardness measurements for very small spherical indenter radii.
Hardness versus strain for polycrystalline iridium alloy [Reference Pharr, Herbert and Gao7] for a wide range of spherical indenter radii compared with a fit of Eq. (29).

The grain radius was measured by Swadener et al. [Reference Swadener, George and Pharr6] as  ${1 \over 2}d = 15\;{\rm{\mu m}}$. This compares very favorably with the predicted intrinsic material length scale of L = 12.5 μm. The iridium is also alloyed with 0.3% W. This indicates a solid solution strengthening spacing of L S = 5 nm. The two length scales can be combined through (13), such that
 ${1 \over L} = {{2{\alpha _{\rm{G}}}} \over d} + {{{\alpha _{\rm{s}}}} \over {{L_{\rm{S}}}}}$. It is not possible to separate the contribution from each mechanism, but this suggests values of αG < 1.2 and αs < 4 × 10⁻⁴, both of which are realistic.
Conclusion
Equations (20) and (23) have been derived for the interpretation of hardness measurements in polycrystalline alloys. These also propose a model for the extreme ISE at very small extrinsic length scales. Validation against data from the literature is very encouraging. It has been demonstrated that a good estimate of the internal material length scale can be extracted from hardness tests using spherical indenters of different radii. It is anticipated that this will be useful to experimentalists in the physical interpretation of data.
Acknowledgments
This work was performed as part of a EURAMET joint research project (StrengthABLE) with funding from the European Community’s Seventh Framework Programme, ERA-NET Plus, under Grant Agreement No. 217257.