

In many low- and middle-income countries, citizens do not have equal access to basic resources, such as clean water, electricity, or housing. Increasing access to these local public resources is important for improving citizens’ quality of life. For politicians, this suggests that helping to provide local public goods can be an effective strategy for signaling political competence and improving future vote shares. Yet in order for politicians to receive electoral rewards for providing public goods, citizens need to know which politician provides these essential resources. In practice, and particularly in decentralized environments, identifying which politicians provide resources is an exceptionally difficult task (Devarajan et al. Reference Devarajan, Khemani, Shah and Ahmad2009; Gélineau and Remmer Reference Gélineau and Remmer2006).
How, then, do national politicians benefit from providing local public goods? In strong party environments, national politicians will often overcome voters’ uncertainty about who deserves credit for local goods by directing resources toward areas governed by copartisans (Ames Reference Ames1994; Brollo and Nannicini Reference Brollo and Nannicini2012). Copartisanship makes it possible for politicians at different levels of government to share credit—that is, to receive credit for the same local good—because voters will reward the political party (Ames Reference Ames1994). However, is this type of credit sharing possible in weakly institutionalized party environments? When politics is more personalistic, how do voters determine who deserves credit for local public goods? These questions are particularly important to scholars of Latin America, where political parties are often personalistic.
Understanding which politician receives credit for local public goods—and whether credit sharing is possible—has important implications for political accountability. When citizens can identify which politicians are responsible for providing public goods, voting can serve as a referendum on politician performance. However, when citizens cannot identify who is responsible for public goods, politicians may prioritize their own interests over citizen preferences (Baumann et al. Reference Baumann, Ecker and Gross2020; Fox and Jordan Reference Fox and Jordan2011; Lago-Peñas and Lago-Peñas Reference Lago-Peñas and Lago-Peñas2010; León and Orriols Reference León and Orriols2016).
Most existing theories of how credit attribution can help increase political accountability focus on political parties. Parties can play a variety of roles, including advertising what the political party has accomplished to help citizens assign credit across levels of government (Ames Reference Ames1994; Auerbach and Thachil Reference Auerbach and Thachil2020; Ribeiro and Borges Reference Ribeiro and Borges2020). For national politicians, providing local public goods to copartisans can help foster cooperation, improve service delivery, and shape voter expectations (Bohlken Reference Bohlken2018; Schneider Reference Schneider2020). However, we do not know whether the benefits of credit sharing occur in more personalistic political systems.
Given the importance of credit attribution for electoral accountability, how citizens assign credit for local public goods is crucial. This analysis focuses on how citizens assign credit for visible public goods, such as local infrastructure, that can be readily observed in a citizen’s daily life without any publicity. I argue that when considering infrastructure projects, there is an asymmetry in how citizens respond to credit-claiming behavior. Citizens tend to attribute credit to local politicians because they are both more geographically proximate to voters and salient political actors. As a result, there is a ceiling effect, in which local politicians cannot increase the proportion of citizens who attribute credit to them by claiming credit. However, national politicians are unlikely to receive credit from citizens unless they engage in credit claiming.
Moreover, I argue that the asymmetry in how citizens respond to credit-claiming behavior affects their perceptions of how politicians will perform during elections. My argument implies that credit claiming is not zero sum. In other words, if a national politician claims credit for providing local goods, citizens are not less likely to attribute credit to local politicians. If my theory is supported, then credit sharing is possible in weakly institutionalized party environments.
To test this theory, I use a vignette experiment on a nationally representative survey of two thousand citizens in Colombia. Colombia is an ideal test of the theory because it has a large number of fragmented political parties. In this context, individual political actors are often more important to citizens than the parties they represent. In the vignette experiment, I vary what information citizens have about who may have provided local public goods. I then ask questions about who the respondents believe is responsible for providing the local goods and how the presence of the good may affect the future vote shares of the national or local politicians.
I find consistent support for my theory; respondents are more likely to attribute credit to national politicians and anticipate the vote share of national politicians improving if the national politician claims credit. However, credit claiming by neither the local nor the national politician has an effect on how citizens evaluate local politicians. Crucially, I find that the largest positive effects for national politicians occur when the national and local politicians share credit, providing additional support to the idea that shared credit is possible regardless of political party.
Dual Accountability and the Problem of Credit
The driving force behind many decentralization reforms is the desire to bring governments closer to citizens. Advocates of these reforms argue that making governments more proximate to voters increases government efficiency, responsiveness, and political accountability (Escobar-Lemmon and Ross Reference Escobar-Lemmon and Ross2014; Faguet Reference Faguet2004; Faguet et al. Reference Faguet, Fox and Pöschl2015; Hooghe and Marks Reference Hooghe and Marks2009). However, an unintended consequence of these reforms is that they introduce uncertainty about who does what; citizens struggle to identify who is responsible for different political sectors, the economy, or the projects that affect their daily lives (Devarajan et al. Reference Devarajan, Khemani, Shah and Ahmad2009; Gélineau and Remmer Reference Gélineau and Remmer2006). This uncertainty actually reduces a citizen’s ability to hold politicians accountable (Baumann et al. Reference Baumann, Ecker and Gross2020). Without clarity of responsibility, the correct level of government is unlikely to be rewarded or punished through retrospective voting (Lago-Peñas and Lago-Peñas Reference Lago-Peñas and Lago-Peñas2010; León and Orriols Reference León and Orriols2016).
The consequences of unclear attribution of responsibility are far reaching. Low-performing politicians benefit from citizen uncertainty because they can avoid blame for poor performance (Fox and Jordan Reference Fox and Jordan2011; Martin and Raffler Reference Martin and Raffler2021). However, high-performing politicians are less likely to benefit from retrospective voting. To receive electoral rewards for positive outcomes, it is important for politicians to receive credit for their work (Cruz and Schneider Reference Cruz and Schneider2017).
One way that politicians work to ensure they receive credit for their good performance is by targeting benefits toward copartisans (Ames Reference Ames1994; Brollo and Nannicini Reference Brollo and Nannicini2012). In doing so, these politicians anticipate a partisan coattail effect in which the political party is rewarded at the polls. This strategy for credit sharing is effective only when the parties have strong brands (Feierherd Reference Feierherd2020). In these cases, credit sharing can happen, but it is limited to members of the same political party.
In the absence of strong party brands, politicians can redirect benefits. For example, Bueno (Reference Bueno2018) finds that in Brazil, where party systems are weakly institutionalized, discretionary funds will be given to nonstate organizations rather than unaligned mayors. In doing so, politicians can reduce the risk of credit hijacking by rival politicians. In other words, national politicians select their redistribution method to align with how they can get credit from citizens. Likewise, politicians will focus on public goods where it is easy to attribute credit. For example, Harding and Stasavage (Reference Harding and Stasavage2014) find that national politicians will abolish school fees—a policy change that can easily be attributed to their behavior—rather than improve education by increasing the number of teachers in the classroom or resources targeted toward individual schools.
Politicians also need to decide how to claim credit. Different credit-claiming strategies are likely to reach different groups of potential voters. For example, in Brazil, local politicians often attend the lotteries for the Minha Casa Minha Vida program while national politicians post about lotteries on social media. These strategies target different audiences (Bueno Reference Bueno2021).
Despite the value that politicians place on receiving credit, it is unclear to what extent receiving credit translates into increased vote share during elections. Proponents of decentralization reforms anticipate that voters will practice dual accountability, a practice in which voters attribute responsibility to actors at the relevant level of government. If this were the case, then voters would always consider which politician provided local benefits when deciding how to vote in future elections.
However, even when citizens can properly identify which level of government is responsible for local conditions, they are unlikely to practice dual accountability (Johns Reference Johns2011; Rodden and Wibbels Reference Rodden and Wibbels2010). Rodden and Wibbels (Reference Rodden and Wibbels2010) analyze four federal systems: the United States, Canada, Germany, and Argentina. In these contexts, divisions of power are fairly well defined, and political party networks play a role in voter decisions. They find that partisanship, not dual accountability, explains how politicians at different levels of government are evaluated. On the other hand, Johns (Reference Johns2011) finds that in Canada and Scotland, respondents can identify what level of government performs different tasks, but this knowledge does not play a role in voting behavior. These findings suggest that it is unlikely that dual accountability can occur in decentralized, rather than federal, states.
Concerns about whether receiving credit improves vote share are further complicated by the external factors shaping voting behaviors. First, whether a citizen credits or blames a politician for their performance is often shaped by their own partisanship (Marsh and Tilley Reference Marsh and Tilley2010). Thus, knowledge does not necessarily align with voting decisions. Moreover, providing additional information about politicians’ performance influences how voters evaluate politicians only when they believe other citizens also care (Adida et al. Reference Adida, Gottlieb, Kramon and McClendon2020). While politicians are concerned about receiving credit, there is still uncertainty about whether this matters for retrospective voting.
This study builds on these literatures to explore how politicians benefit from credit claiming in weakly institutionalized party systems. When a politician seeks credit for their performance in a local area, what tangible credit-claiming behavior is most likely to be effective? I argue that only national politicians can receive credit for their work at the local level through credit claiming. Credit claiming has no effect on how citizens evaluate local politicians because local politicians are already associated with local goods provision.
Citizen Behavior in Credit Attribution and Vote Choice
To analyze how political actors are rewarded for the provision of locally targeted goods, this study addresses two questions. First, do citizens know who is responsible for local public goods? Second, does their knowledge about who is responsible actually matter when they vote in elections? If citizens do not know who is responsible, then any reward that a politician receives from providing goods may be a reward for performance more broadly. Likewise, if properly attributing credit does not matter for vote choice, then the actors who provide local public goods are not receiving direct political benefits for doing so.
I argue that citizens’ knowledge of who does what is incredibly limited in the absence of strong party brands, since parties invest fewer resources in providing information to voters and politicians are less likely to benefit from a shared party label. When this is coupled with the problem of dual accountability, citizens are unlikely to know precisely who provides local public goods. Moreover, citizens will often receive competing messages about how local projects are funded and implemented. As an informational shortcut, citizens will focus on project visibility (Johannessen Reference Johannessen2019). Citizens will make decisions based on local projects that they are likely to observe in their daily life. In other words, if a person can see construction or road work during their daily activities, they will use this project to make decisions. There is considerable variation in project visibility. In larger or more populous municipalities, there is a nonuniform distribution of who will witness any given infrastructure project. Despite this variation, the idea is that people make decisions based on what they can observe. If improvements cannot be easily witnessed, then they are less likely to serve as informational shortcuts on performance.
Thus, my theory is applicable to infrastructure projects where the stages of project development can be witnessed. When infrastructure is built, people can observe progress during construction from the first land clearings through the finished structure. As a result, infrastructure projects are informational shortcuts for assessing politicians’ ability to deliver local goods. These are more universal signals than the quality of services because citizens can observe changes in infrastructure without engaging with the related service. In other words, citizens can witness the construction of a new medical clinic regardless of whether they ever need to use that clinic’s medical services. This also differs from social policy, in which new public goods may be provided that are obvious to recipients but local politicians will need to use credit claiming to advertise the program to the nontarget population (Bueno Reference Bueno2021). This study focuses exclusively on visible infrastructure projects, since they can be observed by the entire population.
Citizens tend to attribute credit to local politicians, which helps these politicians benefit from local infrastructure projects. This occurs because local politicians are often salient figures in the community. In low- and middle-income countries, it is common for local politicians to have close ties to many citizens. Politicians may use these close ties to increase citizen dependence on the politician’s staying in office. This is evident in relational clientelism, which Nichter defines as “ongoing exchange relationships that extend beyond election campaigns”(Reference Nichter2018, 5). This type of clientelist strategy is particularly salient in middle-income countries and among political parties with organizational reach and incumbency (Yildirim and Kitschelt Reference Yildirim and Kitschelt2019). One way it may be used is through the process of mayors favoring their donors when providing contracts (Gulzar et al. Reference Gulzar, Rueda and Ruiz2021). When local politicians engage in relational clientelism to maintain their power over time, citizens who benefit from ongoing interactions may attribute credit to the same politicians for local improvements.
Moreover, local politicians are often instrumental in attracting money from national politicians. For example, in Zambia, unelected local chiefs with deep community ties are key to mobilizing citizens for coproduced local goods (Baldwin Reference Baldwin2019). When there is political decentralization, citizens have selected their local representation. This means the local politicians become the symbols of the municipality and are more likely to be in the forefront of voters’ minds.
Local politicians are also more geographically proximate to voters. Particularly in small, rural municipalities, citizens have the greatest access to local politicians. Visiting municipal offices or contacting local representatives is often more feasible than accessing national-level representation. As a result, citizens are more likely to draw associations between local conditions and the politicians they have access to.
The evidence that local politicians benefit from all local improvements—regardless of their actual role in improving conditions—is far reaching. When considering questions of social policy, for example, local politicians benefit from policies that improve the lives of their constituents. Studies of conditional cash transfer (CCT) programs in both Brazil and Mexico have found that in areas where there are more recipients of CCT benefits, the mayor’s party is more likely to be reelected. This is true regardless of whether this is the same party that implemented the CCT programs (De La O Reference De La and Ana2013; Rodríguez-Chamussy Reference Rodríguez-Chamussy2015; Zucco Reference Zucco2013). The local incumbent can benefit because of the tangible changes in recipients’ lives. Where there is a high concentration of CCT recipients, the local politician receives credit because of the positive effects in their municipality.
When considering infrastructure projects, it is possible for citizens across the socioeconomic spectrum to witness progress. Therefore, we should expect that the benefits mayors receive from social policy implementation should be even more strongly realized by more observable, and often popular, local infrastructure improvements. Due to their local salience and geographic proximity to voters, local politicians are likely to receive credit for local-level improvements.
I argue that the credit preference toward local politicians occurs regardless of the local politician’s actual role in improving local conditions. The logic of this is based on both the visibility of the project and the scope of the project. Projects that occur within municipal boundaries, such as road maintenance and school, clinic, and water facility construction, are likely to benefit local politicians because they are fully concentrated at the local level. On the other hand, more ambiguous infrastructure projects, such as roads connecting municipalities or water treatment facilities that serve multiple municipalities and cross municipal borders, may not be as readily associated with mayors.
However, national politicians do not benefit from the same salience and proximity to voters. While national-level politicians are also elected, they are responding to a much larger constituency than local politicians. Therefore, voters are less likely to associate national politicians with spearheading infrastructure projects that are clearly defined by geographic boundaries. Similarly, they are not as likely to be present in a municipality, since their responsibilities require them to spend time across multiple municipalities. As a result, they need to rely on a large range of potential credit-claiming strategies, from relatively costless social media posts to press releases to costly decisions to attend inauguration ceremonies unveiling new projects. These strategies are likely to vary in their effectiveness, the audience reached, and the way that national politicians’ credit claiming agrees with—or differs from—credit claiming by local-level politicians. This study focuses specifically on costly credit claiming that occurs by attending ribbon-cutting ceremonies for municipal-level projects.
I argue that national-level politicians are unlikely to receive credit for local-level improvements in their jurisdiction when those projects are fully contained in a single municipality. This occurs because voters will connect observable local projects to the most salient and geographically proximate politician—the mayor. Thus, when infrastructure projects occur within clearly defined municipal boundaries, national politicians need to engage in more credit-claiming behavior than local politicians to overcome voters’ existing credit attribution tendencies. This leads to my first hypothesis:
Hypothesis 1 When national politicians claim credit for local goods, citizens are more likely to attribute credit to the national government than if national politicians do not claim credit.
I further argue that credit claiming by the national politician does not override citizens’ tendency to attribute credit to local politicians. National politicians do not gain credit at the expense of local politicians. Instead, the national politician’s decision to claim credit is seen as an additional actor who provided the good.
Hypothesis 1a When national politicians claim credit for local goods, citizens are equally likely to attribute credit to local politicians as when the national politician does not claim credit.
Furthermore, the existing tendency to credit the local politician creates a ceiling effect, in which the local politician does not receive an added benefit from claiming credit for themself. That is, engaging in credit-claiming behaviors—whether costless statements or costly ceremonies—does not increase the credit that local politicians receive.
Hypothesis 1b When local politicians claim credit for local goods, citizens are equally likely to attribute credit to local politicians as when the local politician does not claim credit.
Combined, these hypotheses suggest that national politicians will receive credit for their work only in communities where they explicitly seek credit. This is true even in personalistic systems where national politicians may have large followings based on their mass appeal rather than their programmatic policies. The same is not true of local politicians, who will benefit from being intrinsically linked to all local projects. National politicians, therefore, have the most to gain from credit attribution.
But while the national politicians value receiving credit from citizens as a way to demonstrate their competence, it is unclear whether this credit translates into electoral returns. Even if citizens have the necessary information to practice dual accountability, they may choose not to, instead using other heuristics to determine their ultimate vote choice.
The existing literature shows that in the context of strong party brands, credit sharing will lead to increased electoral returns for multiple politicians, due to partisan coattail effects. In instances where there are strong party brands, voters will identify a party as responsible for local improvements and reward it across levels of government. The coattail effect can benefit politicians at every level of government—even helping presidential candidates where there is a strong local party system and local candidates who share a political party with popular national politicians (Ames Reference Ames1994). Thus, credit sharing is a function of copartisanship. This suggests that voters will vote along party lines rather than practicing dual accountability and separating politicians across levels of government. However, the same cannot be said when there is more party fragmentation. In these instances, coattail effects are less likely to be effective (Ribeiro and Borges Reference Ribeiro and Borges2020).
Since partisan coattail effects are less effective in weak party contexts, citizens may be more inclined to use information about who is responsible for different goods and policies to practice dual accountability. However, I argue that citizens are still unlikely to separate politicians across levels of government. Instead, credit sharing can persist, even across party lines. If two politicians simultaneously claim credit, citizens may see this as a sign that politicians have cooperated, rather than interpreting it as competing information in which only one politician can be accurate. This is because, in the absence of the informational shortcuts that strong party brands provide, citizens are basing their decisions on individual politician behavior. This trend is particularly likely when national and subnational party systems are divorced, such that party alliances change in different contexts (Milanese and Albarracín Reference Milanese and Albarracín2022). Moreover, credit sharing may be an intentional strategy. For example, national politicians may choose to share credit with local politicians in order to benefit from the local politician’s credibility.
This suggests that multiple politicians can see increased electoral returns from the same local project. This is neither the result of a shared party platform (Feierherd Reference Feierherd2020) nor a consequence of a wide-reaching social policy (Zucco Reference Zucco2013). Rather, it occurs because citizens update their beliefs about responsibility for local goods based only on signals from the national, as opposed to the local, government.
Citizens are likely to connect politicians to projects using both information about local conditions and the visibility of politicians associated with local projects. National politicians, because they respond to relatively large jurisdictions, face logistical challenges maintaining a regular visible presence in any given municipality. As a result, these politicians are less likely to be immediately connected to local improvements. To overcome this challenge, national politicians need to give citizens clear information about the role they play in local politics. In the absence of this information, national politicians are unlikely to reap electoral benefits for their involvement in local improvements. However, if national politicians can visibly connect themselves with the projects and thereby receive credit, they can anticipate higher electoral returns. This leads to the second hypothesis.
Hypothesis 2 When voters receive additional information about a national politician’s involvement in local projects, this information will improve the national politician’s anticipated vote share.
The same asymmetry that occurs for credit attribution also translates into future electoral returns: credit will help the national politician but will not change voters’ tendency to credit local politicians. As a result, additional information about the national politician is unlikely to change the anticipated electoral rewards of local politicians. This suggests an important refinement to hypothesis 2:
Hypothesis 2a When voters receive additional information about a national politician’s involvement in local projects, this information will have no effect on a local politician’s anticipated vote share.
Taken together, hypotheses 2 and 2a suggest important implications for how citizens attribute credit. First, credit can be shared across levels of government, even in weakly institutionalized party systems. This is possible because citizens will consider both the visibility of a politician and clear, explicit credit-claiming behavior. However, not all credit-claiming behavior is equal: when a politician is already linked to a project—by nature of their geographic proximity—credit claiming is less effective than when the politician needs to exert effort in order to connect themself to a project. As a result, local politicians are not affected by additional information, which will only benefit national politicians. Second, local politicians are unlikely to be harmed by credit-sharing behavior.Footnote 1
Experimental Design
To test these arguments about how citizens respond to credit claiming by local and national politicians, I conducted a national survey of more than two thousand citizens in Colombia with an embedded vignette experiment. Colombia was chosen as the location for the survey for several reasons. First, Colombia has a unitary government, but the country has undergone extensive decentralization reforms since its 1991 Constitution. As a result, citizens in Colombia are asked to differentiate between national and local political systems. In Colombia’s decentralized political system, mayors have a lot of political importance and a good deal of autonomy. Yet despite this autonomy, Colombia has complicated rules for fiscal transfers from the national to the local government that cause within-country variance in the extent to which mayors can behave autonomously in fiscal manners. This variation is essential for understanding how voters process credit claiming in a complex information environment. While credit claiming is probably more important in some municipalities than others, a national survey of Colombia that includes urban and rural municipalities with varying levels of fiscal autonomy in 29 of Colombia’s 32 departments offers an opportunity to view the average effects of credit-claiming behavior in this type of decentralized context.
Second, party systems in Colombia are both weak and personalistic; citizens often associate more with individual politicians than with parties, making it difficult for politicians to benefit from partisan coattail effects. Instead, they rely on rich interpersonal networks for credit claiming. This creates situations in which we can see politicians both competing for credit and embracing shared credit across party lines.
An important component of this is Colombia’s rich history of clientelism. Historically, clientelism was central to elections and reinforced the strength of landowners in rural areas (Eaton and Chambers-Ju Reference Eaton, Chambers-Ju, Brun and Diamond2014; Ocampo Reference Ocampo2014). These legacies remain today. In rural areas, powerful landowners maintain influence over local election outcomes. Moreover, decentralization reforms have only given mayors more control over resources that can be used for clientelism (Ocampo Reference Ocampo2014). As an assistant to a mayor in Valle de Cauca explained (July 2016), mayors continue to provide additional jobs and contracts to their allies to maintain political support because it is the best way to keep political networks mobilized. However, Colombian citizens have also sought changes to the existing clientelist practices, leading to a context in which citizens expect patronage networks but do not want to be swayed by the resulting benefits (Eaton and Chambers-Ju Reference Eaton, Chambers-Ju, Brun and Diamond2014).
The ongoing importance of patron-client networks complicates politicians’ relationship to credit claiming. Both mayors and national politicians need to engage in credit claiming, and politicians at both levels have the resources to control their own patron-client networks. As a result, we see considerable variation in how local politicians engage in credit claiming versus credit sharing. In the Antioquia Department, one former mayor interviewed expressed the conviction that they would never share credit with a national politician because every local improvement was their own (July 2018a). However, another mayor in a similar department expressed the opposite sentiment, explaining that they would always invite national politicians to the municipality and embraced shared credit claiming as a more honest representation of what they did for the municipality (July 2018b).
The survey was administered online by Netquest, a survey firm with a strong presence in Colombia, from November 12 to November 19, 2018.Footnote 2 The survey ran after the national-level elections that occurred in May 2018, and a year before the 2019 local-level elections. This timing was selected because it was between elections, so respondents were unlikely to be influenced by current campaign and credit-claiming dynamics.
Respondents ranged in age from 18 to 72, and the average respondent was 34 years old. The survey sampled citizens across all six of Colombia’s household strata, an indicator of the quality of their living conditions. There was also a range of respondents with different levels of education and employment. The survey included two components: a pretreatment question block designed to elicit information about how citizens attribute credit without any additional information, and the vignette treatment, which exposed citizens to one of four credit-claiming conditions and asked about who was responsible for local projects and how local projects might influence future vote shares (see table 1).Footnote 3
Sample Demographics

Pretreatment
The first group of questions was designed to determine citizens’ beliefs about who deserved credit for a variety of public works, without any additional information. Respondents were first asked who was responsible for one of the following public works in their municipality: road maintenance, water and sewage, school infrastructure, hospital and clinic infrastructure, parks, or electricity. This created a baseline understanding of how people assumed politicians’ responsibilities are allocated that could be used to evaluate their later responses. Respondents were asked both who was responsible for funding the local project and who iwas responsible for implementing the local project, allowing them to differentiate between financial and implementational responsibility.
When asked about who deserved credit for financing local public goods across all treatments, the plurality of respondents, 32 percent, attributed credit to the mayor and 8 percent attributed credit to Congress. The remainder attributed credit to the president, the governor, the department assembly, or the town council. When asked about who implemented the same local public goods, the results were remarkably similar: the plurality, 31 percent, said the mayor, 9 percent said congress, and the remainder selected another elected official.
Next, respondents were shown two of the aforementioned six public works categories. They were asked to select all political actors who might see improved electoral returns because of a new project in each of the two categories. They could select as many politicians as they wished from among the mayor, the town council, the governor, the department assembly, the president, and Congress. This question highlights how citizens map new projects onto electoral expectations without any information regarding credit attribution. The responses from these two sets of questions allowed for conducting within-subject analysis to see whether citizens with varying initial beliefs responded differently when exposed to the treatments.
Vignette Experiment
The vignette specifically asked about one of three salient public works: school infrastructure, clinic infrastructure, or road infrastructure. This subset of possible public works was chosen because they are important projects across municipalities with different demographics. Moreover, during the pilot survey, these were the most common responses when citizens were asked what areas needed improvement in their municipality.Footnote 4 As a result, these are projects that citizens are more likely to take an interest in and benefit from. The respondents were exposed to the following text:
Suppose there is a new (school, clinic, road) in your municipality. [information treatment]
Notably, by using the word new, the question focuses on the construction of a building, rather than education or health policy or service delivery, which are less easily observed by citizens in their daily lives. Moreover, the treatment ends with the phrase in your municipality in order to indicate that this is a local project that citizens may encounter, rather than a department-level or national initiative in which their ability to observe the project is less likely and ties to the local government are more tenuous. No more specific information about the project was provided, so that citizens could imagine where that project might occur. This accounts for geographic variation in how likely citizens are to observe potential new schools, clinics, or roads. The vignette experiment had four possible information treatments:
1. The control, in which citizens were not exposed to any new information about credit. The vignette ended after respondents were told there was a new school, clinic, or road in their municipality. This treatment mimics the real-world treatment, in which citizens neither are given information about how local projects are funded, nor do they witness visible credit-claiming behavior. Instead, they see only the new infrastructure project.
2. The mayor credit-claiming treatment, in which citizens were told, “The mayor attends an inauguration ceremony.” In this condition, the citizen receives information suggesting that the mayor has visibly claimed credit and may be responsible for the local good.Footnote 5
3. The shared credit treatment, in which citizens were told, “The mayor and a representative from the Chamber of Representatives attend an inauguration ceremony.” In this treatment, the respondent receives information suggesting that both politicians can claim credit for the project. This shared credit condition suggests that the politicians have worked together and are not engaging in competing claims.
4. The representative credit-claiming condition, in which citizens were told “The representative attends an inauguration ceremony.” In this treatment, the respondent receives information suggesting that the representative has independently claimed credit.
Notably, credit claiming always occurs through an inauguration ceremony. This event was selected because it is the costliest form of credit claiming for a mayor or national politician to participate in. These ceremonies require funds, logistical planning, and, in the case of national-level politicians, a commitment to travel to a municipality. As a result, if any form of credit claiming matters, that effect is most likely to be observed through an inauguration ceremony where politicians are physically present. This limits the scope of the study to one type of credit claiming that is overt, costly, and well advertised. I expect that the magnitude of the effects would be smaller when politicians engage in less costly forms of credit claiming, such as social media posts, because this is a noisier signal. Moreover, I expect that the audience of credit claiming through other mechanisms will lead to considerable variation in who responds to credit claiming.
The treatments focus only on the mayor and the national representative. This is because they are both politicians with the potential to influence local politics. Mayors are the highest-profile political actor in each municipality. In Colombia, mayors have a fair amount of autonomy over local politics and hold a coveted office. Therefore they are the actor that citizens are most likely to associate with municipal-level infrastructure and policy. On the other hand, national legislators have a strong regional interest: they continue to travel back to their departments throughout their time in office and value networks with local politicians. Moreover, a common form of redistribution is cupos indicativos, also known as jam. In these transfers, legislators use their contacts in different national ministries to acquire the funding for an infrastructure project in specific municipalities. While this survey does not specifically highlight the use of jam, it is regularly reported on, and citizens know that redistribution via jam occurs through national-level legislators (La Silla Vacía Reference Vacía2018). In fact, attracting jam is a key function for Colombian mayors.
The vignette was followed by two questions: Who financed the project? and Who deserves the most credit for the project? These two questions are separated to capture the possibility that a citizen knows that local projects tend to be funded by one level of government but believes that a different level of government is most responsible for bringing the project to the municipality. For example, in more than 60 semistructured interviews with experts, local politicians, and national-level politicians in Antioquia Department, Valle de Cauca Department, and Bogotá, local-level politicians placed strong emphasis on the difference between funding and implementing projects. When these politicians discussed their own credit-claiming behavior, they often explained that they were responsible for bringing the funds into the municipality to make the project possible.Footnote 6 In addition to the mayor or the representative, citizens could select the governor or president, two salient politicians whom citizens have extensive knowledge of.
In the second stage of the experiment, respondents were randomly asked about either the mayor or the national representative. Whether respondents were asked about the mayor or the national representative occurred independently of the initial treatment. This stage focused on how additional information regarding visible credit claiming affected a respondent’s expectations about the politician’s future vote share. The respondent was asked, “How will the new [school, clinic, or road] affect the votes of the [mayor or representative] the next time they run for office?” Respondents could select from a five-point scale ranging from the candidate receiving a lot fewer votes to a lot more votes. This question achieves two goals. First, by randomizing who receives votes independent of the information condition the respondent is exposed to, it gathers information about how people evaluate the votes of candidates who may not have claimed credit.
Second, by asking about vote share in the abstract rather than individual vote choice, the question reduces potential concerns respondents may have about revealing their own vote preferences and instead captures how voters believe that new projects affect a politician’s vote share more broadly. Moreover, while expected vote share does not capture actual voting behavior, it does provide important insights about whether goods are viewed as political carrots among the populace. While asking about individual vote choice can be confounded by other features, such as support for the current politicians, asking about vote choice in the abstract forces respondents to focus on how they believe other citizens evaluate new infrastructure projects during elections, rather than their own loyalties to personalistic candidates.
Credit Claiming and Responsibility
After being exposed to the initial treatment, respondents were asked, “Who deserves the most credit for bringing the new public work into the municipality?” This question establishes whether citizens’ perceptions of who provides goods to a municipality change when a politician claims credit by attending an inauguration ceremony. While the survey design asks about three different types of local public works—schools, clinics, and roads—the results are pooled for the analysis.Footnote 7
Three separate types of analysis were performed. The first created a binary treatment variable for whether the mayor attended an inauguration and a separate binary variable for whether the representative attended an inauguration. The binary variables treat the shared credit treatment as equivalent to both the mayor credit-claiming and representative credit-claiming treatments. This is useful for establishing whether the physical presence of the actor affects credit attribution. The second analysis compared how the survey respondents responded to each individual treatment compared to the control treatment, in which no additional information was provided. This allowed for explicitly testing what type of information was most likely to influence how citizens attributed credit.Footnote 8 Third, a within-subject analysis was based on how citizens attributed credit for financing and implementing projects during the pretreatment question block to elucidate which groups might be most likely to change how they attributed credit.
Binary Treatments
The representative credit treatment and the shared credit treatment were combined into a single variable: Representative attends. This variable captures whether the representative was present at an inauguration ceremony for a new good. If my hypothesis is supported, I expect that the representative attending will increase the proportion of respondents who attribute credit to the representative and will have no effect on the proportion of respondents who attribute credit to the mayor. I find support for this hypothesis.
Using a difference of means test comparing all respondents who were exposed to the Representative attends treatment and the respondents who were not exposed to it, the analysis finds that the percentage of respondents who credit the mayor is unchanged (p > 0.1). However, the difference of means when considering whether respondents attribute credit to the representative is both statistically and substantively significant (p < 0.01). When the representative does not attend, only 5.86 percent of respondents attribute credit to the representative. When the representative attends, this increases by about 4 percent, with 9.84 percent of respondents attributing credit to the representative. This is a meaningful change in a context in which citizens are unlikely to credit the representative with local goods in their municipality. As seen in figures 1a and 1b, the mayor is not harmed by the representative’s attendance, but the representative is much more likely to receive credit.
Differences of Means when the Representative or Mayor Attends. (a) Crediting the Mayor when the Representative Attends. (b) Crediting the Representative when the Representative Attends. (c) Crediting the Mayor when the Mayor Attends. (d) Crediting the Representative when the Mayor Attends

I argue that the reason only the representative’s attendance affects whether respondents attribute credit to the representative is that the mayor is more intrinsically linked to local projects, due to their proximity and local autonomy. Therefore, representatives have to exert effort to overcome a voter’s natural inclination to favor the mayor.
The difference of means test was repeated based on whether the respondents were exposed to a Mayor attends treatment. The test found the expected null results. When the mayor does not attend an inauguration ceremony, 65.54 percent of respondents will attribute credit to a mayor, while when a mayor does attend the ceremony, 66.97 percent of respondents will attribute credit to the mayor. Likewise, when the mayor does not attend, 7.13 percent of respondents credit the representative, and when the mayor attends, 8.56 percent of respondents credit the representative. As seen in figures 1c and 1d, these differences are not significant.Footnote 9
Comparing All Four Treatments
While this binary analysis provides preliminary support for the hypothesis that only visible credit attribution by the national government will affect how citizens attribute credit, it was repeated to compare the three possible treatments: the mayor claims credit, the representative claims credit, and the politicians share credit, against the control, in which the respondent receives no information about credit-claiming behavior. If my hypothesis is supported, then none of the experimental treatments should be statistically significant when determining whether the respondent attributes credit to the mayor. As seen in figure 2, this is indeed the case.
Odds Ratio for Attributing Credit Across All Treatments

On the other hand, I expect that visible credit attribution by the national politician will increase the likelihood that citizens will attribute credit to the national politician. I find support for this hypothesis. Comparing all four conditions shows that respondents are more likely to attribute credit to the national representative when they are exposed to the shared credit condition. In the control group, only 6.05 percent of respondents attributed credit to the representative. When exposed to the shared credit treatment, this number almost doubled, to 11.45 percent of respondents.Footnote 10 This large increase in credit attribution can be seen in figure 2, which shows the odds ratio for credit attribution across treatments rather than the raw numbers.Footnote 11
However, being exposed to the representative alone does not have a significant effect on credit attribution; while a higher percentage of respondents attributed credit in the representative treatment than the control treatment (8.23 percent vs. 6.05 percent), this difference was not statistically significant. This suggests that the national politician is more likely to receive credit in a shared condition, without any consequences to the mayor. This provides compelling evidence that shared credit is mutually beneficial, even in weakly institutionalized party systems. One reason for this may be that personalistic mayors add credibility to credit claiming by the national politician. This provides further support to my argument that the mayor is the key actor in determining how citizens attribute credit.
The key finding is that mayors do not benefit from credit claiming. While I argue that this is a function of the mayor’s proximity to voters and the relative importance placed on mayors in the Colombian political system, an alternative explanation could be that mayors are seen as more likely always to claim credit. However, this is refuted by interview data with mayors throughout the Antioquia and Valle de Cauca Departments. While many mayors did talk about their desire to make sure they communicated with their citizens what they personally provided, many others discussed this practice as a waste of time, since they could not serve consecutive terms. They explained that credit claiming had limited short-term benefits. A third group of mayors chose not to claim credit because of a desire to strengthen relationships with politicians at additional levels of government. As one mayor from a rural municipality outside of Medellín (October 2018) explained, she always discusses the role of national-level politicians because it is better for her future career. Therefore we cannot assume that mayors are seen as responsible because they are inherently more likely to claim credit.
Within-Subject Analysis
The last analysis evaluated whether the respondent’s preexisting beliefs about which politician deserved credit for local goods affected their response to the treatment conditions. This analysis serves two purposes. First, it is an important validity check to ensure that the results are driven by the fact that so few respondents attribute credit to the representative, absent additional information. Second, it confirms that the expected null results for mayoral credit attribution do not occur because a large proportion of respondents always attribute credit to the mayor.
The pretreatment questions asked how respondents attributed credit in one of six different areas. They considered two separate forms of credit: who respondents believed was responsible for financing different local goods, and who was responsible for implementing different local goods. Separating two different roles in providing resources to a municipality allows for testing whether the attribution of responsibility changes based preexisting beliefs with respect to both financial and implementational responsibility for local public goods. This is particularly important in the Colombian context because of the jam system and the mayors being seen as politicians who attract municipal funds. The within-subject analysis was limited to respondents who were asked about schools, hospitals, or road maintenance to keep the pretreatment questions consistent with the goods in the vignette experiment. This left a sample size of 1,013 respondents.
The survey included four questions about prior attribution. First, respondents were asked who was primarily responsible for funding the good. Then they were asked who else might be responsible for funding the good. These two questions were then repeated to ask who implemented the local good. For each question, the response options were the president, the congress, the departmental legislature, the governor, the mayor, or the town council. For the analysis, these choices were condensed into three groups: those who assigned primary responsibility to congress, the mayor, or other.Footnote 12
Financing Local Public Goods
In the Colombian system, schools, clinics, and roads are usually financed using transfers from the national government. This is particularly true in smaller, more rural municipalities. Despite this arrangement, 24.28 percent of respondents saw the mayor as primarily responsible, while 10.07 percent saw Congress as primarily responsible for financing local goods.
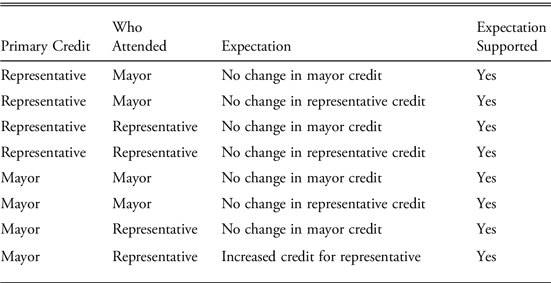
First, let us consider the small (N = 102) sample of respondents who saw the representative as primarily responsible. If the mayor attends the inauguration, I do not expect that this group will be more likely to attribute credit to the mayor or less likely to attribute credit to the representative. Moreover, when the representative attends the inauguration, I expect that the respondents will be equally likely to attribute credit to the mayor. Furthermore, since this group is already likely to view the representative as responsible, I do not expect them to update their expectations about the representative when the representative attends. As seen in table 2, I find all expected null results.Footnote 13
Within-Subject Analysis Expectations and Results

Next is the sample of respondents (N = 246) who saw the mayor as primarily responsible for financing local goods. I do not anticipate that this group will change their expectations about whether the mayor or representative should receive credit if the mayor attends. Likewise, I do not expect this group to change their expectations about whether the mayor receives credit if the representative attends a ceremony. However, this group should be more likely to attribute credit to the representative who attends an inauguration ceremony. I find support for this expectation: when the representative attends an inauguration, the percentage of respondents who attribute credit to the representative triples. When the representative does not attend the inauguration, only 3.1 percent of respondents attribute credit to the representative. However, when the representative did attend, this number increases to 9.4 percent and is significant at p < 0.01.Footnote 14
Implementing Local Public Goods
While public goods are usually financed by the national government, local governments are responsible for implementing new infrastructure projects and service delivery. However, citizens do not seem to differentiate financing and implementing goods. Among those who were asked about schools, hospitals, or clinics in the pretest, 27.15 percent of respondents correctly identified the mayor as primarily responsible for implementing local goods, while 9.38 percent of respondents saw Congress as primarily responsible for implementing the same goods.Footnote 15
The results by subgroup are largely consistent. When the mayor attended an inauguration, it had no effect on any of the group’s likelihood to attribute credit to the mayor or the representative. As in attributing credit for financing local goods, there was a difference in results when the representative attended. When the representative attended, those who saw the representative as primarily responsible did not change their beliefs about who deserved credit for a local good. However, among those who saw the mayor as primarily responsible for implementing local goods, the percentage of respondents who attributed credit to the representative increased from 5.3 percent to 12.1 percent of respondents, a significant increase at p < 0.05.
Credit Claiming and Vote Share
While there is consistent evidence that respondents are more likely to attribute credit to a representative who claims credit, it is unclear to what extent this increase in credit translates into improved electoral performance. I expect that when voters witness credit claiming by a national politician, they are more likely to expect that the national politician’s vote share will increase but that there will be no effect on the expectations regarding the mayor’s vote share. However, this expectation has an important caveat. Elections are large events in which voters are likely to consider multiple issues, including the personalistic appeal of politicians. Thus, while the survey attempts to draw a direct connection by asking to what extent the new local good will influence future vote share in the aggregate, conceptual slippage is still likely when respondents do not fully isolate the experimental treatment.
To assess changes in vote share, a simple trichotomized measure was created for both the mayor’s vote share and the representative’s vote share. In both cases, when the respondent anticipated the vote share decreasing, the new variable was coded –1, when the respondent said there would be no vote change it is coded 0, and when the respondent anticipated the politician receiving more votes, the new variable was coded 1.Footnote 16
As in the foregoing analysis, three separate analyses were performed. The first was a basic test of whether the representative attending changed whether the respondent anticipated the mayor’s or representative’s vote shares changing. The second considered how all three possible treatments compared to the control treatment, in which no additional information about credit claiming was provided. Third, a within-subject analysis was based on the pretreatment question, “Which of the following actors is likely to see their vote share improve based on a new public good?” The within-subject treatment considered three groups—all respondents who believed the mayor’s vote share would improve, all respondents who believed the representative’s vote share would improve, and the subset of respondents who believed that both the mayor’s and the representative’s vote shares would improve.
Binary Treatments
In line with the hypotheses, when the representative attends an inauguration ceremony, the respondents will not change their perception of the mayor’s future vote share. When the representative does not attend the inauguration, the average response of those asked about the mayor’s vote share is 0.71 (on a scale from –1 to 1). When the representative attends, the mean response is 0.72. This indicates that most respondents anticipate that the mayor’s vote share will improve, regardless of whether the representative claims credit.
However, this finding changes when considering the expected change in vote share for the representative. When the representative does not attend, the average response of those asked about the representative was 0.43, but when the representative attends, this increases to 0.56. This difference is significant at p < 0.01. On average, respondents are more likely to anticipate an improved vote share regardless of attendance, but the proportion who see the vote share improving increases when the representative attends. These results can be seen in figure 3.
Differences of Means for Vote Share Improving when the Representative Attends. (a) Difference of Means for the Mayor’s Vote Share Improving. (b) Difference of Means for Representative’s Vote Share Improving

Comparing All Four Treatments
The above analysis supports the hypothesis that when the national politician claims credit, respondents are more likely to think that the representative’s vote share will improve and that the national politician claiming credit will have no effect on the mayor’s vote share. When considering credit claiming, this result was driven by credit sharing. A new question to explore is whether credit sharing explains the increase in respondents who anticipate the representative’s vote share improving. Unfortunately, with 999 respondents asked about crediting the mayor and 989 asked about crediting the representative, the samples for each treatment are underpowered. Therefore I consider trends in data as well as statistical significance.
I anticipate that regardless of what treatment respondents were exposed to, their beliefs about whether the mayor’s vote share will improve will be unlikely to change. As seen in figure 4, this hypothesis is supported: none of the treatments have a significant effect on the mayor’s vote share. Instead, the error bars for each odds ratio estimate cross 1, indicating equal odds across the treatment and control groups.
Odds Ratio for Improved Vote Share Across Treatments

I expect that when respondents are asked about the representative’s vote share, those who saw the representative attend will be more likely to anticipate the representative’s vote share improving. This has more ambiguous results: when using an ordered logit regression to estimate coefficients, the results show that the Representative treatment is significant at p < 0.1. This suggests that the change may be driven by the representative claiming credit for themself rather than by credit sharing. Furthermore, I find the expected positive coefficients for the shared credit treatment.
Further exploration of the results using a one-way ANOVA analysis shows that the four possible treatments are different at p < 0.05. To understand what drives the differences, a series of paired t-tests was conducted and found that the difference of means between the Mayor treatment and the Representative treatment and the means between the Mayor treatment and the Shared credit treatment are both significant at p < 0.05. When the mayor attends the inauguration, the mean response is 0.40, but when credit is shared, the mean increases to 0.54. If the representative attends alone, the mean response is 0.57. The variation across all four groups is shown in figure 5. The effect of the representative attending, therefore, occurs not when there is a change from no credit claiming to credit claiming by the representative, but rather when there is a movement from credit claiming by the mayor to credit sharing or credit claiming by the representative.Footnote 17
Mean Response to Changes in the Representative’s Vote Share Across Treatments

Within-Subject Analysis
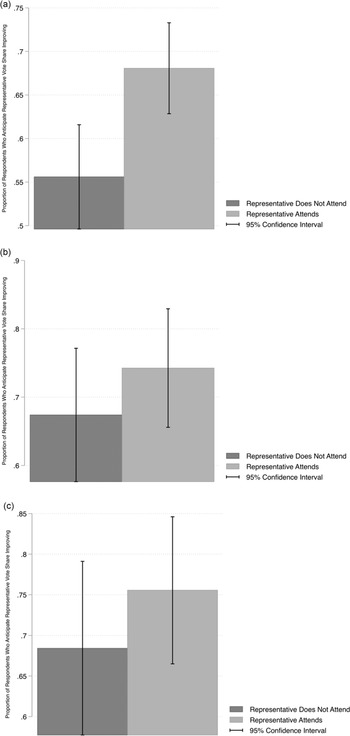
In order to evaluate which respondents drive the above results, the sample was redued to consider only respondents who were asked about new schools, new clinics/hospitals, or road improvements during the pretreatment question block. The reduced sample contained 1,507 respondents. This sample was divided into three categories: respondents who believed that local goods would help the mayor, those who believed that local goods would help the representative, and those who believed that local goods would help both politicians. The analysis tested how the representative attending an inauguration, either in the representative treatment or the shared credit treatment, changed the responses for each group. Using this technique, we can better understand who is most likely to anticipate changes in vote share. To make these results directly comparable, the dichotomous version of the posttreatment question about vote share was used, coded 1 when the respondent thought the vote share would improve and 0 otherwise.
Before the experiment, 77.37 percent of respondents believed that new projects were likely to improve the mayor’s vote share. Conversely, only 25.55 percent of respondents believed that new projects were likely to increase the representative’s vote share. Moreover, only 22.36 percent of respondents believed that projects would benefit both the mayor and representative. This percentage suggests that most, but not all, respondents who anticipated improvements in the representative’s vote share also anticipated improvements in the mayor’s vote share.
As expected, all three groups were consistent in their evaluation of whether the mayor’s future vote share would improve, regardless of their treatment. When considering whether respondents anticipated the representative’s vote improving, those who said the mayor’s vote share would improve during the pretreatment block were more likely to anticipate the representative’s vote share improving when the respondent attended. When the representative did not attend, only 55.60 percent of respondents believed the representative’s vote share would improve. When the representative attended, this increased to 68.06 percent of respondents (p < 0.01).Footnote 18 Neither of the groups that already anticipated the representative’s vote share improving saw an effect when the representative attended This suggests that the effect was strongest among those who were unlikely to anticipate the representative benefiting from local projects. The results can be seen in figure 6.
Differences of Means for the Representative’s Vote Share Improving when the Representative Attends. (a) Respondents Who Believed the Mayor’s Vote Share Would Improve. (b) Respondents Who Believed the Representative’s Vote Share Would Improve. (c) Respondents Who Believed Both Politicians’ Vote Shares Would Improve

Conclusions
This article provides important insights about when credit claiming is an effective way to change citizen perceptions and improve politician vote share. It finds support for the theory that citizens’ responses to credit claiming are asymmetric, due to their tendency toward local politicians. Local-level politicians have a ceiling effect, in which additional credit-claiming behavior has no effect on outcomes. Moreover, local-level politicians are not harmed by national politicians’ credit claiming. However, credit claiming, and in particular credit sharing, is an effective tool for national politicians looking to receive credit for local-level projects. This finding suggests that politicians who divert funds in an attempt to avoid “credit hijacking” by unaligned politicians (Bueno Reference Bueno2018) may be engaging in an unnecessary precaution. These findings suggest that credit attribution is not zero sum, and citizens are unlikely to reward one politician at the expense of another politician.
Moreover, these results support the common assumption that there is a connection between credit claiming and anticipated voter returns. Just as in credit claiming, the effect on voter returns is asymmetric. Mayors have a ceiling effect in which credit-claiming behavior does not improve anticipated future vote shares, but credit claiming by the representative does improve anticipated vote shares for the national politician. This leads to two major conclusions. First, this finding suggests that there is, in fact, a relationship between credit claiming and whether voters reward politicians for projects. In personalistic party systems, this suggests that engaging in popular programmatic politics will still further a politician’s success, if they receive credit.
Second, credit sharing is both possible and beneficial, even in weakly institutionalized party systems. This raises questions about why local-level politicians often do not share credit. If credit sharing is low cost, then sharing credit is a sign that the local politician is willing to help the national politician improve their vote share. However, further research should explore motivations for choosing not to share credit, as well as the effects of competing credit claims, with the politicians coordinating across levels of government. This additional research can help elucidate why mayoral credit claiming seems to be the largest barrier to national politicians’ receiving electoral rewards from local improvements.
Moreover, these results are driven by the respondents who were least likely to attribute credit to the national politician. When considering credit attribution, the respondents who were likely to attribute credit to the mayor during the pretreatment question block were the group who saw the largest increase in respondents who would attribute credit to the representative should the representative attend. Likewise, when considering anticipated improvements in vote share, respondents who believed the mayor’s vote share would improve as a result of local projects were the group who saw the largest increase in the proportion of respondents who believed the representative’s vote share would improve should a representative claim credit. Since the results are driven by the group that would, on the surface, be most skeptical when rewarding the national politician, the increases in credit attribution and beliefs that the vote share would improve show that citizens are willing to move beyond their assumptions concerning local goods.
For example, if a citizen assumed that mayors provided all local goods and should be rewarded for this action, these results show that this citizen is willing to adjust their beliefs. If a representative claims credit, the same citizen will be willing to acknowledge the role that a national politician played in providing a local good. Moreover, this citizen’s beliefs will not only change in the short term; the citizen will also anticipate an increased vote share for the national politician. These results provide support for the common assumption that credit attribution matters when voters cast their ballots.
It is worth noting that, when considering credit attribution, the positive effect of credit claiming by the national politician on receiving credit from respondents was strongest for the shared credit treatment, not the treatment in which the representative claims credit. Citizens are more likely to attribute credit to a national politician when that politician’s claims are corroborated by the local politicians. Since citizens are already likely to attribute credit to mayors, having the mayor implicitly endorse the national politician’s role in providing local goods by appearing beside them sends a strong signal of the national politician’s responsibility for providing goods. However, there is little compelling evidence that the same is true when considering anticipated electoral rewards. Future research will explore when credit sharing is likely to provide larger benefits to national politicians than credit claiming.