Introduction
Self-rated health (SRH) is an important and widely used summary measure representing an individual's perspective of his own health based on a simple general question. Though it is considered a ‘subjective’ indicator it is recommended by the World Health Organization (WHO) and the European Commission for health monitoring and, over the past two decades, it has been consistently used to compute measures such as healthy life expectancy (Robine et al., Reference Robine and Jagger2003). In fact, SRH exhibits a strong association with morbidity while it has proved a strong predictor of mortality, even when controlling for objective health indicators (Idler & Kasl, Reference Idler and Kasl1991; Idler & Benyamini, Reference Idler and Benyamini1997; Van Doorslaer & Gerdtham, Reference Van Doorslaer and Gerdtham2003; Verropoulou, Reference Verropoulou2014). Hence, it seems to encompass additional health information, over and above these ‘objective’ health indicators.
Self-rated health exhibits a strong socioeconomic gradient both among the general population and among older adults (Griffin et al., Reference Griffin, Fuhrer, Stansfeld and Marmot2002; Huismann et al., Reference Huismann, Kunst and Mackenbach2004; Jϋrges, Reference Jϋrges2007; Mackenbach et al., Reference Mackenbach, Meerding and Kunst2007; Verropoulou, Reference Verropoulou2009). Read et al. (Reference Read, Grundy and Foverskov2015), for instance, conducting a systematic review of studies about the association of socioeconomic position (SEP) with subjective health among older Europeans, found that lower SEP was related to poorer health; the associations differentiated by sex, while they were weaker when social support and health-related behaviours were adjusted for, suggesting that these factors confound the relationship between SEP and subjective health. Apart from concurrent SEP, early-life socioeconomic conditions seem to have an effect on later-life health. Due to the scarcity of life course studies, findings are usually based on retrospective material and show significant but modest associations between a disadvantaged background in childhood and a higher risk of obesity, smoking, drinking, cardiovascular diseases, common mental disorders, depression, worse SRH, poor physical and psychosocial functioning and greater all-cause mortality (Poulton et al., Reference Poulton, Caspi, Milne, Thomson, Taylor, Sears and Moffitt2002; McKenzie & Carter, Reference McKenzie and Carter2009; Cohen et al., Reference Cohen, Janicki-Deverts, Chen and Matthews2010; Drakopoulos et al., Reference Drakopoulos, Lakioti and Theodosiou2010). Evidence of the importance of early-life conditions on health at older ages (chronic diseases, cognition and longevity) has also been produced by several population-based and community studies in low- and middle-income countries (McEniry, Reference McEniry2013).
Though several studies have examined the associations of SEP with health using either concurrent material or retrospective information, few have investigated the relative contribution of both earlier and later-life socioeconomic circumstances to the SRH of older persons (Nicholson et al., Reference Nicholson, Boback, Murphy, Rose and Marmot2005; Hyde et al., Reference Hyde, Jakub, Melchior, Van Ort and Weyers2006; Havari & Peracchi, Reference Havari and Perrachi2011; Lindström et al., Reference Lindström, Hansen and Rosvall2012). A main result emerging from such analyses is that both earlier and later-life SEP are significant predictors of older adult health. Adverse childhood circumstances have a direct negative effect and an indirect one; the latter operates often via lower educational attainment, which affects employment, income and wealth in adulthood, and which, in their turn, may have an unfavourable impact on health (Case et al., Reference Case, Fetig and Paxson2005; Luo & Waite, Reference Luo and Waite2005; McKenzie et al., Reference McKenzie, Carter, Blakely and Ivory2011).
Measures of socioeconomic position
Socioeconomic position (SEP) is a concept reflecting an individual's place in the social hierarchy, often built around education, occupation, income and financial resources. In fact, different measures may represent SEP in the various stages of the life cycle. In childhood it is thought of as the family socioeconomic conditions or the context that the child is born into and brought up in, including material circumstances, household income, parental occupation, education, social class or having experienced economic distress and financial hardship. Many analyses consider paternal occupation, which represents material resources (Hyde et al., Reference Hyde, Jakub, Melchior, Van Ort and Weyers2006; McKenzie & Carter, Reference McKenzie and Carter2009; McKenzie et al., Reference McKenzie, Carter, Blakely and Ivory2011) and parental educational attainment (Luo & Waite, Reference Luo and Waite2005). Further, proxies may be used, such as the number of books a child had access to, which reflects the socio-cultural background of the parental household and the educational attainment of parents; Cavapozzi et al. (Reference Cavapozzi, Garrouste and Paccagnela2011), for instance, found a strong positive association between number of books and parental educational attainment. Adverse socioeconomic circumstances in childhood can also be established through having experienced extreme events such as hunger, which may affect health in adulthood directly or indirectly, through education and income (Nicolson et al., Reference Nicholson, Boback, Murphy, Rose and Marmot2005; Havari & Peracchi, 2012). Finally, other analyses have employed composite measures expressing childhood economic stress (Lindström et al., Reference Lindström, Hansen and Rosvall2012).
In adulthood, educational attainment is a crucial indicator that shapes future occupational opportunities and earning potential while also providing knowledge and life skills that allow better-educated persons to gain more ready access to information and resources that promote health (Adler & Neuman, Reference Adler and Neuman2002). Income is often linked to educational attainment but also to occupation. It represents an important measure of access to material goods and services that may influence health (Shavers, Reference Shavers2007; Cavapozzi et al., Reference Cavapozzi, Paccagnela and Weber2008). However, it refers to a specific year and may not be representative of economic resources among retired and older persons (Grundy & Holt, Reference Grundy and Holt2001). Occupation is also linked to material resources and financial well-being at a specific point in time but is not as volatile as income; however, among retired persons it may not be of great consequence (Grundy & Holt, Reference Grundy and Holt2001). On the other hand, wealth (based on assets, bank accounts, stock, mutual bonds, mortgages, debts etc.) represents the accumulation of resources over the life course and can be considered one of the key indicators of well-being among older people in Europe, reflecting their ability to meet emergencies and to absorb economic shocks (Christelis et al., Reference Christelis, Jappeli and Padula2005). This latter measure is more strongly linked to social class than income, especially after the age of 65 (Shavers, Reference Shavers2007; Numela, Reference Numela2008). Finally, general questions are often included in surveys asking respondents whether they face financial difficulties or hardship; for instance, a question on whether ‘the household makes ends meet’ can be considered as a measure of standard of living or as a subjective poverty index (Browning & Madsen Reference Browning and Madsen2005; Lyberaki & Tinios, Reference Lyberaki and Tinios2008; Adena & Myck, Reference Adena and Myck2013).
Aims of the study
The main aim of the study was to examine the relative effects of childhood and adulthood SEP on the SRH of older adults while controlling for a large number of confounders related to health and concurrent and past circumstances. In this way, the importance of childhood socioeconomic conditions have been assessed, net of their possible associations with childhood health. Further, the role of education and of the other adulthood SEP indicators as mediators between childhood SEP and later-life SRH should emerge. Taking into account the confounding effect of current health indicators allows a more accurate evaluation of the importance of socioeconomic circumstances on SRH which, otherwise, would be overestimated (Benyamini et al., Reference Benyamini, Boyko, Blumstein and Lerner-Geva2014; Dubikaytis et al., Reference Dubikaytis, Härkänen, Regushevskaya, Hemminki, Haavio-Mannila and Laanpere2014). The analysis distinguished between men and women since the importance of several SEP indicators in later-life differentiates between the sexes (Nicolson et al., Reference Nicholson, Boback, Murphy, Rose and Marmot2005; Luo & Waite, Reference Luo and Waite2005). Focusing on the mechanisms underlying health inequalities among older populations is not only informative but also essential since this group is growing at a rapid rate, especially in Europe, and represents a vulnerable segment of the population both in terms of health and of being subjected to adverse socioeconomic conditions.
In the absence of complete data across the life course the aims of the study were achieved through use of retrospective and cross-sectional material and a combination of indicators, some of which reflect the accumulation of life course social disadvantage. Although retrospective SEP measures have limitations such as lack of clarity about which aspect of childhood socioeconomic environment they represent, while they encompass a greater potential for bias in measurement due to misreporting and memory errors, they present a useful opportunity to empirically examine theoretical life course models when complete data across the life course are lacking (McKenzie & Carter, Reference McKenzie and Carter2009).
Methods
Data
The Survey of Health, Ageing and Retirement in Europe (SHARE) is a multidisciplinary and cross-national panel database of micro data on health, socioeconomic and demographic characteristics, social and family networks, etc., concerning individuals aged 50 or higher from several European countries (Börsch-Supan et al., Reference Börsch-Supan, Brandt, Hunkler, Kneip, Korbmacher and Malter2013). The response rates in SHARE Wave 1 were above average compared with other European surveys (Börsch-Supan & Jϋrges, Reference Börsch-Supan and Jϋrges2005). Individual retention with regard to the longitudinal part of the sample was about 73% for the second wave and 77% for the third wave (Börsch-Supan et al., Reference Börsch-Supan, Brandt, Hunkler, Kneip, Korbmacher and Malter2013). Details about the entire SHARE project are available at www.share-project.org. A detailed description of the methodology and data quality has been presented elsewhere (Börsch-Supan & Jϋrges, Reference Börsch-Supan and Jϋrges2005; Börsch-Supan et al., Reference Börsch-Supan, Brugiavini, Jϋrges, Kapteyn, Mackenbach, Siegrist and Weber2008, Reference Börsch-Supan, Brandt, Hunkler, Kneip, Korbmacher and Malter2013; Schröder, Reference Schröder2011; Malter & Börsch-Supan, Reference Malter and Börsch-Supan2013).
In the present analysis, cross-sectional data from the second wave of the survey, carried out in 2006/07, were used, combined with retrospective information from the third wave (SHARELIFE), carried out in 2008/09. In SHARELIFE a ‘Life History Calendar’ was employed to help recollection of events, similar to the one used in the English Longitudinal Study of Ageing (ELSA) (Garrouste & Paccagnella, Reference Garrouste and Paccagnella2011). The sample used included all respondents participating in both the second and the third waves with no missing information for the variables of interest, i.e. 20,829 individuals from thirteen countries covering Northern, Central, Western, Southern and Eastern Europe (Austria, Belgium, Denmark, France, Germany, Greece, Italy, the Netherlands, Spain, Sweden, Switzerland, the Czech Republic and Poland).
Dependent variable
The outcome variable is SRH in binary form, comparing respondents reporting ‘less than very good health’ (i.e. good, fair or poor) with those with ‘excellent/very good health’ (reference category). This categorization was introduced in the data by the SHARE team; it is widely used, thus allowing comparability with the findings of other studies. Further, as there are country-specific differences in reporting, using a dichotomized version reduces any possible bias (Jürges, Reference Jϋrges2007).
Independent variables
Socioeconomic position in adulthood and later life
Socioeconomic position (SEP) in adulthood is represented by educational attainment, i.e. the highest qualification obtained based on the UNESCO 1997 International Standard Classification of Education coding (ISCED-97: http://www.uis.unesco.org). The variable used in the analyses has three categories: ‘None or low level’ (none/pre-primary and lower secondary education; ISCED 0-2), ‘Intermediate level’ (upper secondary and post-secondary non-tertiary education; ISCED 3-4) and ‘High level’ (first and second stage of tertiary; ISCED 5-6). Socioeconomic position in later life is represented by four variables based on cross-sectional data: household net wealth, household net income, employment status and ‘making household ends meet’. Household net wealth is a summary indicator of all resources that are available to household members; it is the sum of income from all sources after taxation in the year preceding the interview. To avoid loss of information and for efficacy, missing data in the aforementioned two variables were substituted by imputed values by a SHARE team of specialists (see Christelis, Reference Christelis2013). In the present analysis, wealth and income were first converted to Euros and then adjusted for differences in the purchasing power of money across countries using the appropriate OECD purchasing power parity ratios provided in the datasets, thus ensuring cross-country comparability. In order to reduce the effects of extreme values and of imputation inaccuracies, median values were computed by country and binary variables were introduced in the analysis comparing persons below the median with those above. Employment status has three groups: retired, employed and non-employed (i.e. unemployed, sick/disabled and homemakers). This last category differentiates by sex, including mostly homemakers among females and unemployed, sick and disabled among males. Finally, a variable on whether the household makes ends meet ‘easily’ (fairly easily/easily) or ‘with difficulty’ (some difficulty/great difficulty) in the year preceding the survey was included in the models.
Socioeconomic position in childhood
This is represented by three variables: occupation of the main breadwinner when the respondents were 10 years old, the number of books they had access to at age 10 (excluding magazines, newspapers and school books) and whether they had experienced a period of hunger when aged 0–15 years. Occupation of the main breadwinner is a three-category variable including non-manual occupations (legislator/senior official, manager/professional/technician, associate professional/clerk/service worker/shop worker or market sales worker/member of armed forces), manual occupations (skilled agricultural or fishery worker/craft or related trades worker/plant or machine operator or assembler/elementary occupation) and ‘no main breadwinner’. ‘Number of books’ is also a three-category variable including: none or very few books (0–10), enough to fill one shelf/ bookcase (11–100 books) and enough to fill two or more bookcases (101+). Finally, ‘having experienced a period of hunger’ is a binary variable (yes/no).
Confounders
Most of the confounders refer to current circumstances; these include demographic characteristics, social participation and trust, health indicators and risky health behaviours. More specifically, age in years was included in the models. Marital status compares married and partnered persons with those living alone. Country of residence was included to control for cross-country differences in the reporting of SRH. Social participation was derived from respondents reporting if they had participated in voluntary/political/community/religious organizations or had done any charity work in the month preceding the interview; the relevant variable compares persons who did not participate in any activity with those who did. Respondents also replied to a question about whether ‘most people can be trusted’, rating their answer from zero to ten; the respective variable is binary: low trust (score 0–5) or high trust (score 6–10).
‘Objective’ health indicators were also included in the analysis as these may have a confounding effect on the estimated associations of socioeconomic variables with SRH since health status has a reciprocal relationship with socioeconomic status and ‘objective’ health indicators have a strong association with self-rated health (Benyamini et al., Reference Benyamini, Boyko, Blumstein and Lerner-Geva2014; Dubikaytis et al., Reference Dubikaytis, Härkänen, Regushevskaya, Hemminki, Haavio-Mannila and Laanpere2014). Indeed, preliminary analysis confirmed that associations of SEP with SRH were exaggerated if objective health indicators were omitted from the analysis. Health indicators represent physical health, mental health and cognitive function. Physical health includes indicators of suffering from at least two diagnosed chronic conditions out of a list of seventeen (i.e. heart attack/myocardial infraction, hypertension, high blood cholesterol, stroke/cerebral vascular disease, diabetes, chronic lung disease, asthma, arthritis, osteoporosis, cancer/malignant tumour, stomach/duodenal ulcer, Parkinson’s disease, cataracts, fractures, Alzheimer’s disease/dementia, benign tumour) and from at least two symptoms out of a list of twelve (pain in the back/joints, heart trouble/angina, chest pain during exercise, breathlessness, persistent cough, swollen legs, sleeping problems, falling down, dizziness, faints/blackouts, stomach/intestine problems, incontinence/involuntary loss of urine, fatigue). Functional limitations are represented by a binary indicator comparing persons with no mobility difficulties with those with at least one, based on seven tasks related to mobility, arm and fine motor function (i.e. walking 100 metres, sitting for 2 hours, getting up from a chair, climbing several flights of stairs, climbing one flight of stairs, stooping or kneeling, reaching or extending the arms above shoulder level, pulling or pushing large objects, carrying a heavy bag of groceries, picking up a small coin from a table). Activity restrictions include two indicators comparing persons with no limitation with those with at least one; the first one is based on six basic activities of daily living (ADLs: dressing, walking across a room, bathing/showering, eating/cutting up food, getting in/out of bed, using the toilet); the second is based on seven instrumental activities of daily living (IADLs: using a map, preparing a hot meal, shopping for groceries, making telephone calls, taking medications, doing work around the house/garden, managing money). Mental health is measured by the EURO-D scale, formed by twelve items: depression, pessimism, suicidality, guilt, sleep, interest, irritability, appetite, fatigue, concentration, enjoyment, tearfulness. The variable in the models compares persons with at least three depressive symptoms (i.e. experiencing depression) with those with fewer. Cognitive function is measured by a numeracy score; the binary variable used in the analysis compares persons with ‘less than good’ skills with those with ‘good’ skills.
Behavioural risk factors include: physical inactivity, a binary indicator comparing persons who never did any rigorous or moderate activities with those who did; smoking, a three-category variable comparing persons who never smoked and those who stopped smoking with current smokers; and body mass index (BMI) in three categories: normal weight (BMI below 24.9 kg/m2, including a tiny proportion of underweight persons), overweight (BMI 25–29.9) and obese (BMI 30+).
Finally, there are some confounders referring to childhood circumstances. These include SRH at ages 0–15 grouped into two categories (excellent/very good and less than very good), an indicator of whether during childhood the respondent’s parents ‘drank heavily’, whether the respondent received regularly health care from a doctor, nurse or a health care centre and the respondent’s ‘relative position in mathematics’ at age 10 compared with their peers at school (three categories: much better/better, about the same, worse/much worse, which includes also persons who did attend school). The latter variable is considered a ‘reflective’ indicator of intelligence, which has proved, along with educational attainment, to be a mediator between childhood SEP and mid-life health (Hagger-Johnson et al., Reference Hagger-Johnson, Batty, Deary and Von Stumm2011).
Statistical analysis
Binary logistic regression models were applied and robust standard errors were estimated in order to adjust for clustering at household level, as there are persons in the sample who reside in the same household thus sharing socioeconomic characteristics (i.e. household income, household wealth, making ends meet in the household, etc.). Three different models were run: in Model 1 the association of adulthood and concurrent SEP indicators with SRH was examined; in Model 2 the effects of childhood SEP on SRH were considered; in Model 3, simultaneous inclusion of both childhood and concurrent SEP allowed the evaluation of the relative importance of each set of indicators and, at the same time, the assessment of the mediating role of current SEP. All three models controlled for all the above-mentioned confounders; hence, the estimated effects and associations were net of childhood and later-life health status. Further, these models were run separately by sex as a consequence of certain current SEP indicators, for instance income and educational attainment, differentiating between men and women (Luo & Waite, Reference Luo and Waite2005; Nicolson et al., Reference Nicholson, Boback, Murphy, Rose and Marmot2005). Calculations were carried out using STATA Version 13. The comprehensive model, which included all the covariates, was tested for multicollinearity using the STATA procedure ‘collin’; the Variance Inflation Factor (VIF) among males ranged from 1.01 to 1.47 and that for females ranged from 1.02 to 1.49, which are well below 10, which is considered the cut-off point indicative of multicollinearity.
Results
Descriptive statistics
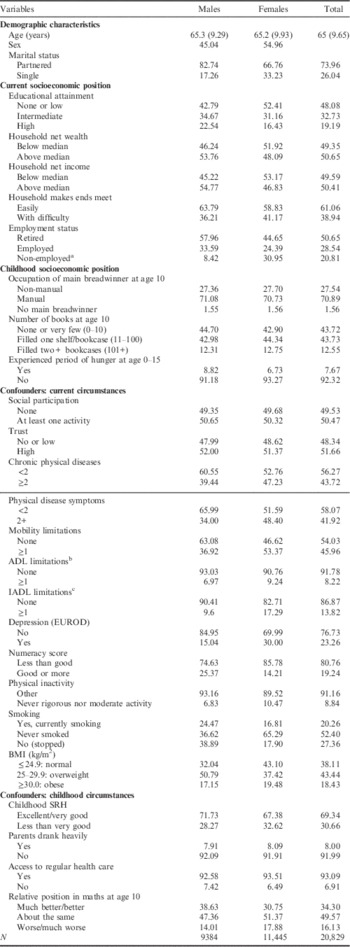
Table 1 shows the descriptive statistics for the variables included in the models. The sample includes 20,829 respondents: 45.0% men and 55.0% women. The mean age of the sample is roughly 65 years, and is nearly identical for both sexes. About three-quarters are partnered, this proportion being substantially higher among men. With respect to current socioeconomic characteristics, a high proportion (48.1%) has ‘none or low’ educational attainment whereas 19.2% has ‘high’ attainment; 61.1% ‘make ends meet’ easily at the household level and 28.5% are employed as opposed to 50.6% being retired. Women tend to be more disadvantaged compared with men by all these indices: they have lower educational attainment, lower income, lower net wealth and tend to live in households that ‘make ends meet’ with greater difficulty. As for employment, men include higher proportions of retired and employed persons whereas more women report themselves as ‘non-employed’ (i.e. homemakers). As for childhood socioeconomic circumstances, 70.9% of the sample lived at age 10 in a household where the main breadwinner was a manual worker, 43.7% had access to very few books (less than 10) as opposed to only 12.5% having access to 100 books or more, whereas 7.7% experienced at least one period of hunger at ages 0–15. Women, in slightly higher proportions than men, had access to more books whereas slightly fewer experienced a ‘period of hunger’.
Descriptive statistics: (means (SDs) and percentages) of the independent variables used in the models

a Non-employed included unemployed, sick, disabled and homemakers.
b ADL: activities of daily living.
c IADL: instrumental activities of daily living.
Regarding the remaining characteristics of the sample, about half of the respondents participated in social activities in the year preceding the interview, and 51.7% trust in others; these proportions are very similar by sex. As far as health is concerned, 43.7% of the sample report at least two chronic diseases, 41.9% at least two symptoms, 46.0% at least one functional limitation, 8.2% at least one ADL limitation, 13.8% at least one IADL limitation, 23.3% report suffering from depression and 80.8% score ‘less than good’ for numeracy skills test. For all health indicators women exhibit greater morbidity that men. Further, 8.8% of the respondents never do any rigorous or moderate activity, 20.3% are currently smokers, 43.4% are overweight and 18.4% are obese. Women report physical inactivity in greater proportions than men but fewer of them are overweight or smokers. Regarding childhood health, 69.3% report having had excellent or very good SRH; proportions are somewhat higher among men. Eight per cent of the sample state that their parents drank heavily when they were children, and 93.1% had access to regular health care. These proportions are very similar for both sexes. Finally, only 16.1% of the sample considered themselves inferior to their peers in mathematics at age 10; the proportions are higher among women.
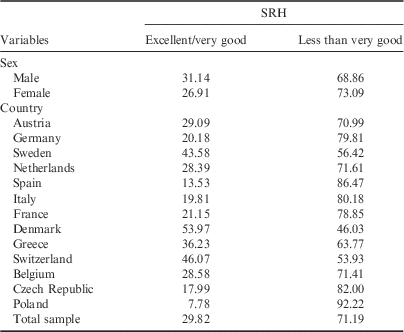
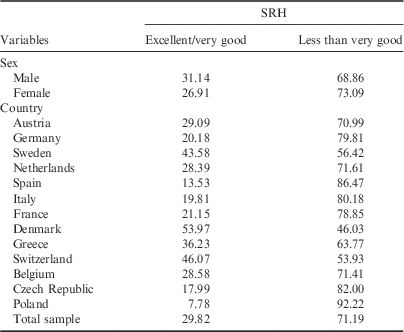
As far as the dependent variable of the analysis is concerned (Table 2), for the overall sample 28.8% of individuals report having excellent or very good SRH; that proportion is higher among men – 31.1%, compared with 26.9% among women. Quite substantial differences, however, can be observed across countries; the Danish seem to experience the best SRH (about 54.0% having at least very good SRH), followed by the Swiss (46.1%) and the Swedish (43.6%). At the opposite end of the scale are the Czechs (only 18.0% report at least very good SRH), the Spanish (13.5%) and the Polish (7.8%).
Percentage distribution of respondent’s self-reported health (SRH) by sex and country of residence
Logistic regression analysis results
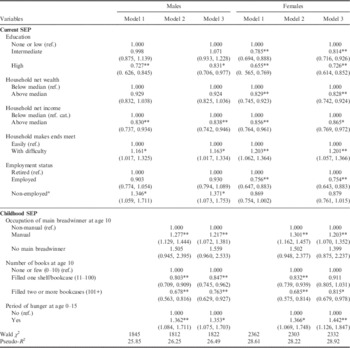
Table 3 shows Odds Ratios (ORs) and 95% Confidence Intervals (CI) for Models 1, 2 and 3 for men and women. The results of Model 1 for men indicate that, controlling for age, differences in reporting across countries, current health status (physical and mental health, functional limitations, activity restrictions, cognitive function), behavioural risk factors, social participation, childhood SRH and childhood circumstances (i.e. whether parents drank heavily and access to regular health care), several current socioeconomic indicators are significant. More specifically, males with higher educational attainment, those with income above the median and those who ‘make ends meet’ easily at household level have significantly higher chances of reporting better SRH. Similarly, Model 2 indicates that, independently of all the above-mentioned confounders, childhood SEP significantly predicts SRH among men. Hence, if the main breadwinner of the family at age 10 was in a manual occupation (OR 1.28; p<0.01) the respondent is more likely to report worse SRH; this also holds if the respondent had experienced a period of hunger at ages 0–15 (OR 1.36; p<0.01). By contrast, having access to a greater number of books has a significant protective effect. Considering all these factors in the same model (Model 3), household net income and ‘household makes ends meet easily’ remain significant. Educational attainment, on the other hand, is less significant showing that it is linked to childhood SEP. The importance of all childhood SEP indicators is also reduced slightly.
Odds Ratios (95% Confidence Interval) based on logistic regression: associations of current and childhood socioeconomic position with self-reported health (SRH) by sex (males=9384, females=11,445)

a Non-employed includes unemployed, sick, disabled and homemakers.
Robust standard errors clustered at household level. All models adjusted for demographic characteristics, social participation, current health, risky health behaviours, childhood circumstances and country of residence (Austria (ref.), Germany, Sweden, Netherlands, Spain, Italy, France, Denmark, Greece, Switzerland, Belgium, Czech Republic, Poland).
**p<0.01; *p<0.05.
Considering the three models for females (Table 3), significant differences can be observed compared with men. More specifically, in Model 1, all current SEP indicators are significant for women, including household net wealth above the median and being employed, which are non-significant for men. Further, educational attainment and ‘household makes ends meet easily’ seem more important among women, whereas among men income is the most significant predictor. Employment status seems to have a different effect by sex: employed men do not differentiate significantly from the retired whereas employed women have significantly lower chances of worse SRH compared with retired women (OR 0.76; p<0.01). Non-employment, including mainly unemployed/sick/disabled persons among men, is associated with significantly higher chances of worse SRH (OR 1.37; p<0.05) whereas among women that category, which includes mainly housewives, is non-significant. Considering childhood SEP (Model 2) for women, all indicators seem very significant, a finding that also holds for men. In the full model (Model 3) the combination of current and childhood SEP among women reduces slightly the importance of educational attainment and household net income. Further, the importance of the number of books at age 10 diminishes.
Regarding the confounding variables (results not shown), the findings highlight the importance of demographic factors, childhood health status, childhood circumstances, current health, risky health behaviours and of social participation and trust. Most of these factors have a significant effect on SRH though in some instances associations differentiate by sex. More specifically, increasing age is related to higher chances of worse SRH, but only among men, while being unpartnered is significantly advantageous among women. Worse childhood and concurrent health is linked to significantly worse SRH for both sexes, as are smoking, being overweight and physical inactivity. Social participation and trusting others, on the other hand, have a protective effect. Childhood adverse circumstances, i.e. lack of regular access to health care (among women) and having parents who drank heavily, also have a negative effect on later-life SRH, while a better position in mathematics compared with peers has a beneficial effect.
The pseudo-R 2 values displayed in Table 3 indicate that the amount of variance of the dependent variable explained by the independent ones changes only slightly between the different models. More specifically, among males concurrent SEP (Model 1, R 2 25.85) explains less of the variance in SRH than childhood SEP (Model 2, R 2 26.25); addition of both concurrent and childhood SEP in Model 3 increases pseudo-R 2 minutely, to 26.49. By contrast, among women concurrent SEP (Model 1, R 2 28.61) explains more of the variance in SRH than childhood SEP (Model 2, R 2 28.22); addition of both concurrent and childhood SEP in Model 3 increases pseudo-R 2 only by a tiny amount, to 28.92. Further, the pseudo-R 2 values of the models excluding all SEP variables (results not shown) stand at 25.41 for males and at 27.7 for females. Hence, demographic and health-related variables explain the greatest part of the variance in SRH and addition of SEP increases the explanatory power of the models by a small amount (4.2% for men and 4.4% for women).
Discussion
This study aimed to assess the relative effects of several childhood and concurrent socioeconomic position (SEP) indicators on the self-reported health (SRH) of older adults, while controlling for a substantial number of confounders. The analysis was carried out separately by sex using logistic regression models and was based on data from Wave 2 (cross-sectional information) and Wave 3 (retrospective material) of SHARE. The findings indicate that both current and childhood SEP, when considered separately, are very significant predictors of SRH, even after controlling for a wide range of current characteristics (i.e. demographic, physical and mental health, functional limitations and activity restrictions, cognitive function and social attributes) as well as for childhood health and environment (SRH, a proxy for intelligence, access to regular health care and whether parents drank heavily). Moreover, when all factors were included in a comprehensive model most childhood and several adult SEP indicators retained their significance implying that both types of socioeconomic circumstances have a strong and independent effect on SRH. However, the relative effect of childhood SEP on SRH is reduced quite substantially. More specifically, among males, the importance of having access to 11–100 books decreases by 22.3%, that of having access to 100+ books by 26.4%, that of ‘non-manual occupation of the main breadwinner’ by 21.7% and that of having experienced a period of hunger by 24.9%. Among women there are even more substantial decreases: ‘number of books at age 10’ becomes only marginally important and the relative effect of the ‘non-manual occupation of the main breadwinner’ decreases by 32.6%. By contrast, the importance of having experienced a period of hunger in childhood increases among women by 20.9%.
Inclusion of all the variables in the comprehensive model also affects the importance of educational attainment and concurrent SEP indicators. More specifically, educational attainment becomes less significant among males but the magnitude of the effect of the other concurrent SEP variables is affected only very slightly. Among females the relative importance of education declines by 13.5% for those at intermediate level and by 20.6% for those at high level. Further, the importance of household net income decreases slightly (by 6.2%). Among women household net wealth, employment and ‘household makes ends meet’ remain virtually unaffected among concurrent SEP measures; the latter is the least-affected indicator among men, too.
The substantial decline in the relative importance of childhood SEP in the comprehensive model signifies that its effect on SRH is mediated by adult SEP and, especially, educational attainment, the importance of which also declines in that model. Still, several childhood and concurrent SEP indicators remain strong predictors of SRH, displaying an independent and significant effect. These results are in accordance with other research, which suggests a strong and independent effect of both types of factors (Luo & Waite, Reference Luo and Waite2005; Nicolson et al., Reference Nicholson, Boback, Murphy, Rose and Marmot2005; Hyde et al., Reference Hyde, Jakub, Melchior, Van Ort and Weyers2006; Lindström et al., Reference Lindström, Hansen and Rosvall2012). However, Nicolson et al. (Reference Nicholson, Boback, Murphy, Rose and Marmot2005) and Hyde et al. (Reference Hyde, Jakub, Melchior, Van Ort and Weyers2006) found that concurrent SEP exhibits the strongest association in most instances, which, while in agreement with the present findings for women, contrasts with the findings for men. Further, there are analyses suggesting that educational attainment is a mediator between childhood SEP and adult SRH. For example, McKenzie et al. (Reference McKenzie, Carter, Blakely and Ivory2011) found that educational attainment largely explains the association of childhood SEP with SRH. Moreover, Luo & Waite (Reference Luo and Waite2005) showed that part of the effect of childhood SEP on the physical, mental and cognitive well-being of US Americans aged 50 or higher occur through childhood health, and another part through adult educational attainment. Finally, Nicholson et al. (Reference Nicholson, Boback, Murphy, Rose and Marmot2005) found that the SRH among Russians aged 50 or higher reflects social exposures accumulated over the life course; childhood deprivation (hunger) influences educational attainment, which, in turn, strongly influences current household income.
The present analysis also found differential effects of SEP indicators by sex. Among concurrent indicators only household net income and whether ‘household makes ends meet’ predict significantly SRH for men; by contrast, for women all current SEP indicators are significant. On the other hand, childhood SEP seems more important among men than among women. Hyde et al. (Reference Hyde, Jakub, Melchior, Van Ort and Weyers2006) also suggested that there are differences by sex in the association of childhood and adulthood SEP with SRH. Further, both Nicolson et al. (Reference Nicholson, Boback, Murphy, Rose and Marmot2005) and Luo and Waite (Reference Luo and Waite2005) concluded that adult income is very significant among men in predicting SRH, whereas educational attainment is important among women, a finding similar to the results of the present study.
One of the strongest childhood predictors of adult SRH emerging from the present study is hunger in childhood. It has been suggested that hunger has important negative effects on educational attainment but also on health outcomes both in childhood and adulthood (Kirkpatrick et al., Reference Kirkpatrick, McIntyre and Potestio2010; Havari & Peracchi, Reference Havari and Perrachi2011; Halmdienst & Winter-Ebmer, Reference Halmdienst and Winter-Ebmer2013). ‘Going to bed hungry’ was also found to be the strongest childhood SEP predictor of adult SRH among Russians aged 50 or higher (Nicholson et al., Reference Nicholson, Boback, Murphy, Rose and Marmot2005). In the present study the relative importance of ‘hunger’ decreases by 24.9% in the comprehensive model for males, suggesting that its effect on SRH is mediated through SEP in later life and especially educational attainment. By contrast, its importance among women increases, implying a strong independent effect that involves mechanisms directly affecting early and late adult health.
Finally, it is worth noting that, in spite of the strong effect that several SEP indicators exhibit on SRH, the study also shows that demographic and health-related factors explain the greatest part of variance in SRH. This was also observed by Benyamini et al. (Reference Benyamini, Boyko, Blumstein and Lerner-Geva2014) who, using OLS regression, found that whereas demographic characteristics and health explained about 48% of the variance in SRH, socioeconomic status added only 1% to the explanatory power of the model.
Limitations of the study
There are some limitations associated with the nature and reporting of the data, as well as with some methodological aspects of the analysis. First, reporting of SRH is known to be affected by cultural perceptions and may differentiate across countries and population sub-groups (Zimmer et al., Reference Zimmer, Natividad, Lin and Chayovan2000; Jürges, Reference Jϋrges2007; Vuorisalmi et al., Reference Vuorisalmi, Pietilä, Fohjolainen and Jylhä2008). However, harmonization of the questionnaires of SHARE, inclusion of appropriate controls in the models (i.e. country, age etc.), as well as use of a binary version of SRH as outcome, are likely to have eliminated this problem to a large extent. Further, although there is some controversy on the use of self-assessed measures, they are important tools for evaluating population health as they are available in most population surveys and extensive research has shown that they consistently predict objective health status and mortality (Idler & Benyamini, Reference Idler and Benyamini1997; Verropoulou, Reference Verropoulou2014).
Second, a further bias could be introduced by the self-reported nature of the data; robustness of the analysis relies upon accurate reporting on the part of the respondents. Use of binary variables in many instances (e.g. ADLs, IADLs, chronic conditions, mobility, symptoms, depression, income, wealth) and of broad categories (e.g. employment status, educational attainment), however, are likely to reduce such effects. Third, memory bias may also be a serious problem in the analysis of retrospective data. On the other hand, the well-structured questionnaire of SHARELIFE and the use of a 'Life History Calendar’ have minimized recall bias; Garrouste and Paccagnella (Reference Garrouste and Paccagnella2011) suggested that SHARELIFE data are strongly consistent.
Fourth, use of a large multinational dataset may conceal important differentiations across countries. However, as the interactions of all socioeconomic indicators by country were examined in the preliminary analysis but were found to be non-significant, it seems justified to conclude that childhood and adult SEP indicators have roughly a uniform effect across countries. Moreover, it has been shown that even between countries with very different socioeconomic levels (i.e. Russia as compared with Western Europe) social conditions throughout life influence SRH among persons aged 50 or higher in a similar way (Nicholson et al., Reference Nicholson, Boback, Murphy, Rose and Marmot2005). Finally, large datasets present several advantages, facilitating identification of important associations, allowing use of a greater number of confounders in the models and analysis to be carried out for different subgroups of the study population.
Conclusion
Despite these limitations, the study makes a contribution to the literature as it is one of the few that focuses on the relative importance of childhood versus later-life SEP on SRH among older adults while including in the analysis a broad range of SEP indicators for both periods and a substantial number of confounders, thus capturing more fully the influence of socioeconomic environment on SRH over the life course. The findings highlight: a) the importance of childhood socioeconomic conditions and the strong and direct effect they have on SRH among older adults, independently of childhood health and of adulthood SEP; b) the mediating role of educational attainment between childhood and later-life SEP; c) the significance of SEP indicators based on general questions such as ‘having experienced hunger during childhood’ and ‘making household ends meet in later life’; and d) the differential impact some SEP indicators have among men and women. Further, some unexpected findings came to light, especially regarding men: a) the greater importance of a ‘general’ later-life SEP indicator such as ‘making household ends meet’ compared with established indicators such as educational attainment and household wealth; and b) the greater significance of childhood compared with concurrent SEP indicators. The latter was not anticipated, given that the opposite was concluded in most other studies which, however, included only a limited number of SEP indicators and confounders (Luo & Waite, Reference Luo and Waite2005; Hyde et al., Reference Hyde, Jakub, Melchior, Van Ort and Weyers2006; Lindström et al., Reference Lindström, Hansen and Rosvall2012).
Further research would benefit from the use of longitudinal data and the application of techniques such as path models to enhance understanding of causal mechanisms and disentangle mediation of socioeconomic factors. Hunger in childhood, in particular, seems an important factor that deserves further exploration, as do SEP indicators based on general questions such as ‘household makes ends meet’. Finally, use of objectively measured biomarkers (e.g. blood pressure, waist circumference) as confounders related to health may provide more robust results.