Introduction
Getting a foot in the government's door is one of the core challenges for interest groups if they are to be successful in influencing public policy. While outside lobbying and media strategies are certainly important, direct access to policymakers seems to count most in influencing public policy (Kollman Reference Kollman1998; Bouwen Reference Bouwen2002; Beyers Reference Beyers2004; Binderkrantz Reference Binderkrantz2005, Reference Binderkrantz2008; Kriesi et al. Reference Kriesi, Tresch and Jochum2007; Baumgartner et al. Reference Baumgartner, Berry, Hojnacki, Kimball and Leech2009). Direct access is often assumed to be driven by a policymaker's demand for policy goods, such as expertise and political support. The main explanatory factor of interest group access is, accordingly, a group's capability to produce and supply these policy goods (Hansen Reference Hansen1991; Austen-Smith Reference Austen-Smith1995; Bouwen Reference Bouwen2002; Eising Reference Eising2007). A group's capability to do so is mostly conceptualised as a function of its resource endowment, measured by its budget, staff size or membership type. According to resource-based perspectives, the mechanism that explains access can be summarised as follows: a higher resource endowment helps to supply high-quality policy goods and enhances the likelihood of access.
This resource-based perspective focuses on individual traits of interest groups and tends to ignore the inter-organisational context in which interest groups usually operate. Many organised interests act through coalitions in order to seek influence (Sabatier Reference Sabatier1988; Zafonte and Sabatier Reference Zafonte and Sabatier1998; Hula Reference Hula1999; Beyers and Kerremans Reference Beyers and Kerremans2004; Kriesi et al. Reference Kriesi, Adam and Jochum2006). Further, organisations often lobby in flocks or jump on bandwagons when selecting the issues on which to spend political resources (Gray and Lowery Reference Gray and Lowery1998; Baumgartner and Leech Reference Baumgartner and Leech2001) and whether or not organisations are intentionally engaged in coalition formation, the side they represent, that is, whether they are in favour or against the prevailing status quo, seems an important explanatory factor for gaining access (Baumgartner et al. Reference Baumgartner, Berry, Hojnacki, Kimball and Leech2009). The propensity of interest groups to join coalitions suggests that the inter-organisational context, the ties that bind interest groups to each other, might be of an important value and may help groups to gain access to public officials. Hall and Deardorff's (Reference Hall and Deardorff2006) legislative subsidy mechanism that explains interest group access to members of US Congress explicitly considers political intelligence in addition to technical expertise as a crucial policy good. Political intelligence summarises the idea that interest groups
tend to be well positioned in issue networks or “lobbying enterprises” [and] thus individual lobbyists can provide information necessary to anticipate other players’ reactions, generate head counts, offer procedural advice and otherwise enable legislators to more fully approximate informed strategic actors in seeking policy “progress”. (Hall and Deardorff Reference Hall and Deardorff2006, 74)
This suggests that how interest groups are connected to other interest organisations enhances both the value and type of the policy goods they can supply. There are a few, mostly US-based, studies that examine systematically how the connectedness or the network position of interest groups actually affects their ability to gain access to the policy process (Carpenter et al. Reference Carpenter, Esterling and Lazer1998, Reference Carpenter and Esterling2003, Reference Carpenter and Esterling2004; Heaney Reference Heaney2004, Reference Heaney2006). The limited attention for the consequences of the positions interest groups occupy within their inter-organisational environment is surprising, given the fact that contemporary scholarship conceptualised governance as being featured by network constellations of interdependent actors with different capabilities and policy positions (Scharpf Reference Scharpf1997). Indeed, one of the important findings of the policy community literature was that policy networks involving both public officials and interest groups, to an important degree, shape policy outcomes (Atkinson and Coleman Reference Atkinson and Coleman1992; Rhodes and Marsh Reference Rhodes and Marsh1992; Maloney et al. Reference Maloney, Jordan and McLaughlin1994).
In this paper, we develop a perspective that explicitly incorporates how the connectedness of interest groups with their coalition environment affects the likelihood of direct access to policymakers. More concretely, we investigate how exchanges within and between political coalitions relate to the extent to which interest groups gain access. We argue that the position an interest group occupies in these networks adds significant leverage to resource-based explanations of interest group access. The first part of the paper develops this argument in more detail. We subsequently test our theoretical expectations with survey data of Dutch interest groups (n = 107) and policymakers (n = 28). The empirical analysis is based on a network analysis and examines how the position an interest group occupies within and between coalitions of Dutch interest groups shapes access to policymakers. Our analyses lead to the conclusion that the position interest groups occupy within and between coalitions offers an important explanation in addition to individual organisational characteristics. Importantly, we find that access to policymakers varies significantly between elected and non-elected officials. While interest organisations that occupy a central position within a coalition gain more access to politicians, interest groups that bridge different coalitions by developing information exchanges with distant acquaintances – so-called “weak ties” – seem to benefit in gaining access to bureaucrats.
An exchange perspective on interest group access
Interest group access to policymakers is often conceptualised as an exchange relation between public officials and organised interests in which the transmission of policy relevant information has a central place. Interest groups exchange technical expertise and political information about their constituencies’ support in return for access to the policy process, be it control over policy outcomes or monitoring information on the political process (Pappi and Hennig Reference Pappi and Henning1998, Reference Pappi and Henning1999; Sloof Reference Sloof1998; Crombez Reference Crombez2002; Hall and Deardorff Reference Hall and Deardorff2006; Henning Reference Henning2009). Policy officials are open to the policy goods interest groups supply, because they face limited capabilities in terms of time, resources and agenda space (Jones and Baumgartner Reference Jones and Baumgartner2005; Hall and Deardorff Reference Hall and Deardorff2006). Given these limited capabilities and the transaction costs associated with interactions with interest groups, policymakers cannot exchange resources for access with every individual interest group. A large number of organised interests will rarely if ever gain direct access to policymakers. Many groups gain indirect access through intermediate actors, and only a limited number of organised interests will enjoy regular access.
The transaction costs involved in political exchanges as well as the importance of having regular exchanges with policymakers means that interest groups aim to optimise their chance of gaining access by establishing an organisational format that helps them supply resources, in particular, specialised information and expertise. The ability to produce and supply such access goods is often explained by an organisation's resource endowment. Not surprisingly, then, organisational features such as material resources, staff size or the type of interests represented are often used as variables predicting the extent to which interest groups gain access to policymakers. However, such an organisational-level approach does not fully correspond with the reality of lobbying, and individual resource endowment is not the only explanation for why some interest groups secure access and others do not. Many studies demonstrate that interest groups are often involved in larger inter-organisational networks or advocacy coalitions and, additionally, tend to engage in coalitions as a means to exercise influence (Laumann and Knoke Reference Laumann and Knoke1987; Sabatier Reference Sabatier1988; Heinz et al. Reference Heinz, Laumann, Nelson and Salisbury1993; Hojnacki Reference Hojnacki1997; Mahoney Reference Mahoney1997; Gray and Lowery Reference Gray and Lowery1998; Zafonte and Sabatier Reference Zafonte and Sabatier1998; Hula Reference Hula1999; Beyers and Kerremans Reference Beyers and Kerremans2004; Heaney Reference Heaney2004, Reference Heaney2006; Kriesi et al. Reference Kriesi, Adam and Jochum2006; Leifeld and Schneider Reference Leifeld and Schneider2012). These studies on coalition formation not only identify different aspects of the policy environment or political opportunity structures as important indicators of the likelihood of coalition formation, but also suggest that establishing coalitions is fundamentally geared to achieve lobby success. Joining forces should, in the end, yield substantial benefits compared to individual lobbying and, mostly, these benefits refer to gaining direct access and the realisation of favourable policy outcomes. Yet, only a few studies explicitly examine the relation between coalition membership and access of individual interest groups to policymaking processes. Carpenter and colleagues offer the most detailed study on the effects of networks on actual policy access (Carpenter et al. Reference Carpenter, Esterling and Lazer1998). They demonstrate that organisations that are approached by a large number of acquaintances are more likely to gain access compared to those who lack such “weak ties”. Their main argument is that the information capacity of interest groups increases with the number of linkages to other organisations. It follows that the better an organisation is connected, the more it can gather relevant information and supply it to policymakers. The position an interest group occupies within and between coalitions thus adds an important explanatory factor to individual resource endowment to explain the quality of policy goods they can offer, and, hence, the likelihood of access.
The added value of social networks in obtaining access
To explain the added value of the network position of interest groups in gaining access, we build upon Granovetter's weak-tie argument (Reference Granovetter1973) and the application of Granovetter's insights by Carpenter and colleagues to explain interest group access to public agencies in US health care policymaking (Carpenter et al. Reference Carpenter, Esterling and Lazer1998, Reference Carpenter and Esterling2003, Reference Carpenter and Esterling2004). Granovetter mainly examined interpersonal networks and argued that the strength of interpersonal ties – a combination of the amount of invested time, emotional intensity, intimacy and reciprocal services – relates to the overall capacity of a network to diffuse knowledge, enhance social mobility or ensure social cohesion (Reference Granovetter1973, 1361). Strong ties refer to intensive connections between like-minded actors, while weak ties are more superficial ties with distant acquaintances. When we apply this concept to interest groups, close exchanges and collaboration between UEAPME (the European Association of Craft, Small and Medium-sized Enterprises) and Business Europe (the European association uniting the EU member states’ peak business organisations), two EU-level encompassing business associations, is a strong tie, while occasional exchanges between Business Europe and Greenpeace Europe, one of the major EU-level environmental NGOs, would count as a weak tie.
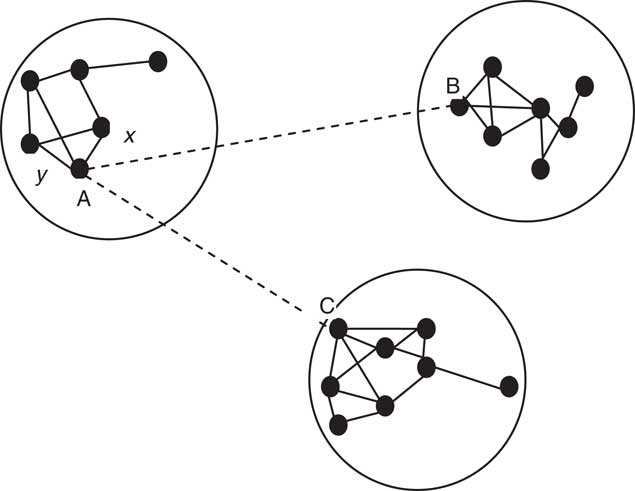
Weak ties are important in diffusion processes (i.e. the spread and availability of knowledge within a network), as they potentially build bridges between distant actors that would otherwise remain unconnected. This observation follows from a key notion of network theory, namely, the idea of transitivity. Transitivity means that when there are two strong ties within a set of three actors, it is likely that, the triad will be closed either by a strong or a weak tie. Consider actor A in Figure 1. Actor A is connected via a strong tie to both x and y, and transitivity implies that x and y will also be connected as a result of the two strong ties. The idea of transitivity implies that a strong tie is never the only connection between two actors (Granovetter Reference Granovetter1973, 1364). Consider Actor A in Figure 1 again. Information could flow to y in two ways, either directly or indirectly via x. Densely connected clusters, such as the three clusters in Figure 1, may contain redundant ties, as many, but not necessarily all, actors can be reached indirectly. It also follows that the sole connection between two actors is often a weak tie. Actor A is connected with B and C via such weak ties. Although these two weak ties do not belong to a fully connected triad, they are crucial, as they form a bridge between actors who each belong to densely connected and highly transitive clusters. In this sense, they form the only channel of exchange between these three coalitions, which makes them crucial for the exchange of information between the three coalitions.
Centrality and weak ties as key network positions.

The “strength of weak ties” implies that ties with distant acquaintances are of a larger informational value than strong ties that remain concentrated within closely knit social circles (Burt Reference Burt2004). That is, weak ties carry less redundant information and serve as bridges between distant cliques, groups or coalitions, as is shown in Figure 1, and help actors to gather information and connect expertise that is available in distant areas of a social system. For instance, the tie between UEAPME and Business Europe is unlikely to reveal new information, while occasional contact between Business Europe and Greenpeace Europe means that these organisations may come across unexpected information. Put another way, organisations building bridges with groups outside the coalition are more likely to hear new information. Meanwhile, those who depend predominantly on ties via their close friends or strong ties are more likely to hear the same story repeatedly.
If this argument holds, then interest groups that bridge distinct coalitions possess informational resources that render them attractive to policymakers and, therefore, being involved in these sort of networks will have a substantial positive impact on gaining access. Carpenter et al. (Reference Carpenter, Esterling and Lazer1998) provide a compelling test of this argument, showing that organisations with weak ties that connect distant players have an advantage in obtaining access to policymakers as opposed to those without such ties. Although we concur that bridging ties are important, we argue that two additional factors are important for understanding the added value of network positions regarding policy access of interest groups.
First, the position of an organisation within a coalition, in particular, a position as coalition representative, is an important factor contributing to access. The more an interest group functions as a central node within a coalition (for instance A, B and C in Figure 1), the more it can provide policymakers with information on the coalition's political views. The limited amount of time available to policymakers means that organisations holding central positions within a coalition are more likely to gain access than those with less central positions. An organisation that occupies a central brokerage position within a coalition may have an advantage in gaining access because of its large number of ties with other coalition members. In that sense, such centrally positioned organisations are better at communicating, encompassing and representing policy views. Peripheral coalition members, on the other hand, may profit from their connections with interests located in other coalitions (bridging or weak ties) – that is, by providing new policy information.
Second, the positions individual interest groups occupy will not be of equal value for all public officials. Research shows that the different types of policy goods interest groups offer co-vary with the likelihood of access to different types of policy officials (Bouwen Reference Bouwen2002; Eising Reference Eising2004; Eising Reference Eising2007). The general presumption of exchange-based models is that time and information constraints faced by public officials lead them to supply access to interest groups that are able to offer policy-relevant expertise and information. A targeted supply of access saves transaction costs for policymakers, and the varying position of organised interests in an inter-organisational network entails different types of information advantages. An interest group that occupies a central brokerage position within a coalition will be more useful for, and gain more access to, elected officials, as the latter are keen to gather information about political support and preference intensities. In particular, political support from clearly identifiable coalitions is important to elected officials. The more an organisation is able to represent the view of a coalition because of its central position therein, the more it is perceived as being able to supply valuable political information to politicians. In contrast, organisations with bridging ties will improve their access to bureaucrats or ministerial officials. These non-elected officials need a more diverse set of information that is useful for both technical problem solving and indicating broad societal support (Poppelaars and Scholten Reference Poppelaars and Scholten2008; Poppelaars Reference Poppelaars2009a; Braun Reference Braun2012). Such information is not necessarily confined to or available within one particular coalition. Moreover, non-elected officials are expected to be non-partisan and cannot afford to be too closely affiliated with one particular coalition. Therefore, organisations with substantial bridging ties are capable of providing more heterogeneous information and are likely to get better access to non-elected officials. Overall, we argue that the access an interest group enjoys depends on its position within a coalition, more precisely its propensity to bridge distinct coalitions (through ties with organisations outside its coalition), as well as its ability to offer representative policy views (through a pivotal and central brokerage position within a coalition). Thus, occupying brokerage or bridging positions will have distinct implications for gaining access to individual policymakers. This results in the following hypotheses:
Hypothesis 1: An interest group with a strong brokerage position within a coalition gains more access to politicians compared to bureaucrats.
Hypothesis 2: An interest group with several ties that bridge distinct coalitions gains more access to bureaucrats compared to politicians.
Data and research design
Our research design consists of a network analysis of Dutch interest groups and public officials. The data for the network analysis were collected via an elite survey, which was conducted between May 2003 and February 2006 within the area of external trade policy of the EU. The survey focused, among others, on how national interest groups seek access to Dutch policymakers in order to shape Dutch government positions in specific policy areas (agriculture, steel/metal and services policies). One of the major problems associated with sampling interest groups is the identification of a sample population. In the Netherlands, there are no reliable and comprehensive sources with population data of interest groups, meaning that top-down sampling of interest groups is a common strategy. Biased samples – that is, samples with interest groups that are relatively active and more “visible” – present a challenge to interest group research in political systems with no reliable population data, such as the Netherlands (Poppelaars Reference Poppelaars2009b). To obtain data as equivalent as possible to population data, we proceeded as follows. First, we screened several formal sources, such as the websites of government agencies involved in trade policy, to identify a wide variety of interest groups, including NGOs, business associations and labour unions.Footnote 1 This procedure of positional sampling resulted in an unbalanced sample of 225 Dutch organisations, as it contained many highly specialised groups that were not associated with trade policy and no labour unions. We retained the following organisations: sectoral associations with a direct (agriculture/food industry, metal/steel, services) or an indirect link (transport and retailing/distribution) to the policy sectors under investigation in the sample. Both NGOs and cross-sectoral interest groups, such as cross-sectoral employer unions, labour unions and associations representing small and medium enterprises, were also retained in the sample.
One important outcome of this mapping process was the complete absence of labour unions in any of the sources we screened. This is remarkable for two reasons. First, the institutionalised neo-corporatist system of interest intermediation means that labour unions are crucial interest groups in the Netherlands. Second, given the importance of trade for the overall Dutch economy, one could imagine that labour unions would be more active and visible in the various sources that were screened. Our aim was to have a sample not only of organisations that are very active in this policy area, but also a sample that would give us a representative picture of interest groups involved in Dutch policymaking more generally. To address this problem, we first snowball sampled the Dutch national members of European labour umbrella organisations and subsequently consulted a number of experts on the relevance of including certain national groups in the sample, particularly sectoral labour unions. As a final step, we examined the composition of key advisory bodies to ensure the inclusion of all relevant domestic labour unions. This procedure resulted in a representative sample of interest groups involved in Dutch policymaking rather than a sample of interest groups only active on trade policy.
Non-elected public officials were included in the sample on the basis of official sources that outline the government agencies and ministries involved in the formal coordination of the policy positions that the Dutch government defends at the European level. We identified 19 key officials in eight agencies and ministries who were in charge of the units responsible for the coordination with other ministries or agencies. Based on the composition of parliamentary commissions in the Dutch Parliament, we selected 23 MPs – or their aides – with a substantial interest in the trade policy domain. One could argue that the set of decision makers is relatively small and could hamper robust conclusion drawing; however, the way we sampled these actors ensures that we can draw a reliable conclusion and present an accurate picture. Importantly, as we demonstrate below, our results on the importance of weak ties correspond with the findings of Carpenter et al. (Reference Carpenter, Esterling and Lazer1998, 441), who worked with a similar-sized sample and similar number of policymakers (n = 29).
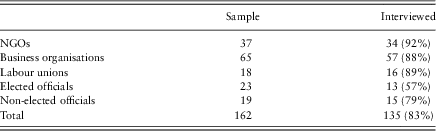
The net result of the sampling procedure was a sample of 162 Dutch interest organisations, government officials and representatives of MPs as well as party officials. Interviews were carried out with 135 officials, including 107 representatives of interest groups and 28 representatives of political parties and government agencies, resulting in an overall response rate of 83 per cent. Table 1 gives an overview of the sample and the response rates. Under the heading of NGOs, we include environmental NGOs, consumer NGOs, development NGOs and a small number of women's organisations. The second group, business organisations, contains cross-sectoral business associations and sectoral business associations (in the field of agriculture, services and metal/steel) as well as small “businesses” such as farmers, professions, and small and medium enterprises. Under the category of trade unions, we find both cross-sectoral and sectoral labour associations. Elected officials include representatives of political parties, and non-elected officials are all civil servants employed by various Dutch ministries associated with trade policy.
Overview of the Dutch sample and response

Identifying coalitions
The first step in our analysis is the identification of advocacy coalitions among Dutch interest groups in order to examine the effect of brokerage within and bridging ties between coalitions on gaining access. Thus, by using coalitions as a starting point, we can control for the impact of coalitions on gaining access as well as test the significance of different network positions on gaining access – that is, occupying a central coalition position and having ties connecting distinct coalitions. We define coalitions as sets of organisations that share common goals and seek to attain these goals through collaboration. Our conceptualisation of coalitions is structural in nature, because it views coalitions as encompassing and entailing diffuse cooperation patterns and does not only assume ad hoc coalitions associated with specific policy issues.
We operationalise advocacy coalitions as sets of interest groups with similar policy views in our case regarding trade policy. For the identification of advocacy coalitions, we first examine the extent to which the sampled actors consider other organised interests to be their allies, their opponents or organisations they want to persuade of their point of view (persuadees). Our questionnaire consisted of three open-ended questions (see Appendix 1 for the wording of these questions), which required respondents to indicate organisations with which they share policy views, they mainly oppose or they aim to persuade. This information was used to construct three square adjacency matrices (allies, persuadees and opponents), in which a “1” corresponds with a row actor indicating a column actor as an opponent, an ally or a persuadee (a “0” means that such a relation was not indicated).Footnote 2
We subsequently examined the coalition structure within the network of allies, opponents and persuadees by running the block model procedure CONCOR in UCINET simultaneously on the three adjacency matrices. This procedure clusters actors into structurally equivalent positions by grouping actors who have similar affiliations to other actors (Breiger et al. Reference Breiger, Boorman and Arabie1975; Burt Reference Burt1978; Wasserman and Faust Reference Wasserman and Faust1998; Borgatti et al. Reference Borgatti, Everett and Freeman1999). CONCOR splits the remaining actors in several blocks or sets of actors that have structurally equivalent connections with each other into an ally, opponent and persuadee. That is, the blocks represent sets of organisations identifying each other to a similar extent as allies, opponents and persuadees. We excluded the 25 per cent of organisations with the lowest number of allies, opponents and persuadees from this analysis, as we consider these as distinct organisational types.Footnote 3 Interviewees of these organisations indicated that their group did not adopt a clear position towards other organisations, and respondents of other organisations generally confirmed the fact that these groups are not obvious members of advocacy coalitions.
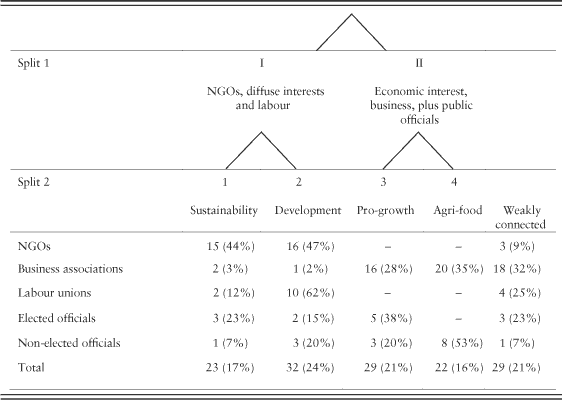
Table 2 reports the results of this analysis. The first split of the CONCOR procedure results in two primary blocks. Block I contains almost all NGOs (91 per cent) and a large number of labour unions (74 per cent) plus a handful of public officials. Almost 63 per cent of the business groups are in block II, while 32 per cent are weakly connected and only 5 per cent are in block I. The business coalition is joined by a large number of bureaucrats (73 per cent of the bureaucrats are in this category) and some politicians (38 per cent). A second split leads to a further split of block I, whereby the NGOs are almost equally divided over two groups and whereby 62 per cent of the labour unions join half of the NGOs. In addition, the employer/business organisations (block II) can be divided into two almost equally sized groups.
The Dutch coalition structure

In addition to the organisations that are not part of this coalition structure, we identified four distinct advocacy coalitions based on the block modelling procedure: the sustainability coalition, the development coalition, the pro-growth coalition and the agri-food coalition. The sustainability coalition mainly consists of NGOs representing environmental or sustainability interests (n = 8) or such as animal right organisations (n = 2), politically more radical development organisations (Both Ends and XminY). This coalition is further joined by two consumer NGOs, one agricultural producer, Kritisch Landbouwberaad, which defends the rights of small farmers and organic farming, and two labour unions. The next coalition consists mainly of development NGOs (n = 18) and labour unions (n = 11). As development NGOs are on average much more prominent than labour unions, we labelled this coalition the development coalition.Footnote 4 The third coalition we identified is the pro-growth coalition, in which most organisations have a liberal, market-oriented view. This coalition is primarily composed of cross-sectoral business interests (n = 16) with peak business associations occupying prominent positions. A final coalition we identified is the agri-food coalition, which is dominated by business organisations (n = 12) active in the “food industry” and food producers or farming interests (n = 5). In addition, we find two business organisations in this coalition that represent firms producing industrial and agricultural and biotechnical and pharmaceutical products. Prominent within this coalition is the Dutch peak agriculture association, LTO-Nederland.
Measuring and explaining interest group access
The advocacy coalitions identified in the previous section clusters organisations that identify each other to a similar extent as being allies, opponents and persuadees. We use this pattern of advocacy coalitions as a starting point for analysing the added value of coalition membership, a central position within a coalition – that is, many ties with organisations within a coalition – and a bridging position – that is, ties with actors from distinct coalitions. Data on information exchanges and collaboration patterns reported during our interviews are used in order to measure brokerage and bridging. Based on a pre-determined list of actors, we asked our respondents to identify organised interests with which they exchanged information and collaborated. The list included all actors that were identified and sampled during the pre-research and interviewed during the fieldwork. For the exact wording of the survey question, refer to Appendix 2.
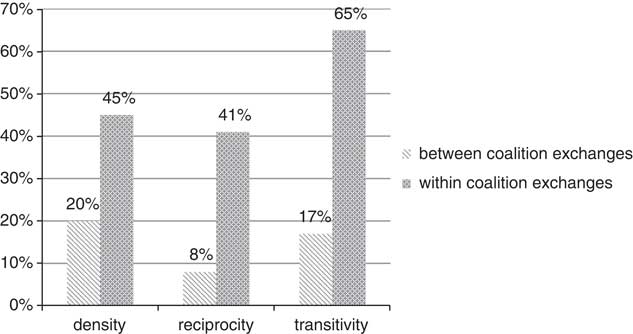
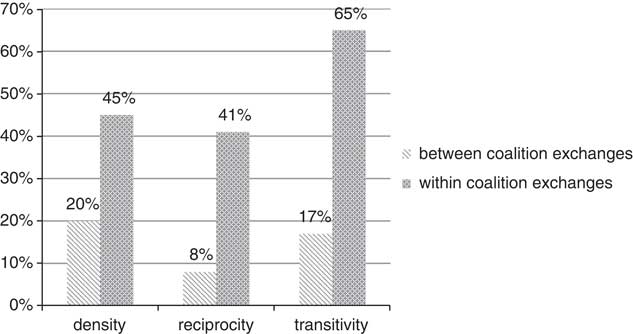
Relying on some simple cohesion measures, Figure 2 illustrates how exchange relations within and between coalitions differ in nature. To begin with, actors within coalitions are much more densely tied to each other. The percentage of initiated exchanges compared to the total number of possible exchanges equals 45 per cent, while this is 20 per cent for the exchanges between coalitions. However, important in terms of the quality of exchanges is the fact that reciprocity, the chance that i referring to j implies j mentioning i, is much higher between coalition members than across coalitions. We also observe substantial differences regarding transitivity, namely the existence of fully connected triads when two actors are linked via a strong tie. While the transitivity, the percentage of ordered triples in which i ⩾ j and j ⩾ k that are transitive, is 65 per cent within coalitions, it is only 17 per cent between coalitions. In sum, within-coalition exchange relations are much more cohesive, stronger and consist of groups that are functionally and ideologically similar. Meanwhile, the lack of transitivity between coalitions signifies the weakness of ties and that existing ties connect distant acquaintances (Carpenter et al. Reference Carpenter, Esterling and Lazer1998).
Comparing exchange relations within and between advocacy coalitions.
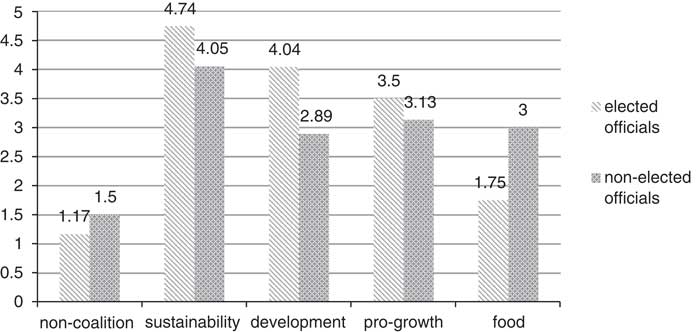
To measure the role of these within-coalition exchanges, that is, the centrality of an interest group within a coalition and the exchanges that bridge the coalitions, we constructed several measures based on actual exchanges and collaboration between interest organisations and policymakers and among interest organisations. First, we constructed two indices that measure interest group access to elected and non-elected officials. These are our two dependent variables. These two indices are count data and sum up for each organised interest the number of bureaucrats or politicians who indicated that they exchanged crucial information and/or collaborated with the interest group in question (see Appendix 2 for the survey questions). Hence, we use the propensity of policymakers to approach an individual organised interest as a relevant exchange partner as a measure for the extent to which this organised interest gains access. Our aim is to explain variation in this measurement. Put differently, our dependent variable is not the propensity of organised interests to form ties with public officials, but rather the propensity that access is supplied to organised interests by public officials. Higher levels of access then indicate that interest groups are mentioned by many policymakers as key actors for information exchanges and/or collaboration. Low access means that none or only a few policymakers identify an organisation as an exchanger or collaborator. Figure 3 shows the variation in access among the different advocacy coalitions identified above. A first obvious conclusion we can draw from this variation is that, on average, being part of a coalition delivers higher levels of policy access. Organisations with a low prominence in the coalition structure, mostly specialised business associations, are mentioned the least by elected and non-elected officials as collaboration and exchange partners. Organisations within the sustainability coalition are identified by many policymakers as exchange or collaboration partners. Organisations in the agri-food coalition differ somewhat from the rest, as they are most often mentioned by non-elected officials – bureaucrats in the ministries – and least often by elected officials.
Average access advocacy coalitions and non-coalition members gain from elected and non-elected officials.

To measure the network position within a coalition and the number of bridging ties (our main independent variables), we focus on actual exchanges and collaboration between the interest organisations. Ties situated outside a coalition are qualified as bridging or weak ties, that is, an organisation's bridging ties are measured by the total number of times it was mentioned as a partner by other actors that do not belong to the organisation's coalition. For instance, when the VNO-NCW (Dutch business peak organisation and member of the pro-growth coalition) is listed by Milieudefensie (member of the sustainability coalition), this tie is coded as a bridging tie for VNO-NCW. Second, we measure the within-coalition position by counting the total number of times an organisation was mentioned as an exchange partner by other coalition members. For instance, each time Milieudefensie is named by other environmental NGOs, we add these ties to its within-coalition or brokerage position. Because these variables are characterised by a skewed non-normal distribution, our models are estimated by taking the log of these variables; in this way, we presume that the first additional ties generate more value in terms of gaining access. As more and more ties are added to an actor's network, the marginal effect of additional connections starts to decrease.
Next to the main independent variables on the positions of actors in inter-organisational networks, we control for (1) the material resources of an organisation measured as the logged number of its full-time staff members and (2) membership, that is, individual members versus organisational or firm membership, in the analyses. We further included the coalition to which an interest group belongs (development, sustainability, pro-growth or agriculture) to test the overall effect of coalition membership. Because the dependent variables, access to bureaucrats and politicians, are count data that are characterised by a large number of zeroes, a highly non-normal distribution and much over-dispersion (variance is substantially larger than the means), we use negative binominal regression in order to test the relative impact of each independent variable (Long Reference Long1997).
One of the key assumptions of standard regression models is the independence of observations. Clearly, in analysing network data with network variables as explanatory factors, this assumption does not hold. There are two ways to model interdependencies and control for possible endogeneity, or auto-correlation, in models aiming to explain the effect of network-related factors, such as the number of ties an organisation or individual has to others, on individual outcomes.Footnote 5 A first option is to model the disturbances, or error terms, as being correlated. The second is to model the auto-regressive effects of the dependent variable. These are not two competing models but may reflect different assumptions about the underlying processes that result in the interdependence effects (Leenders Reference Leenders2002; Mizruchi and Leuman Reference Mizruchi and Neuman2008; O'Malley and Marsden Reference O'Malley and Marsden2008). What kind of interdependence effect should enter the empirical analysis is, ultimately, a decision of the researcher, based on theoretical assumptions of potentially relevant network effects (Leenders Reference Leenders2002). In our analysis, we control for the extent to which other organisations with which a particular organisation is closely related also gain a lot of access. That is, when access is strongly predicted by the extent to which closely related actors also gain access, we can speak about a positive auto-regressive effect. A negative auto-regressive effect means that someone's access diminishes if the access of those with whom one is in close contact increases. The latter finding would suggest that competitive mechanisms are at work (Carpenter et al. Reference Carpenter, Esterling and Lazer1998). As we have two types of interdependencies – brokerage and bridging, we add two separate auto-regressive terms in order to account for these effects (Dow et al. Reference Dow, Burton, White and Reitz1984; Leenders Reference Leenders2002):
 $$ {{{\bf {{Y}}}}_{\rm{a}}}\, = \,{\bf {{X\beta }}}\, + \,{{{\bf {{\rho }}}}_{{\rm{brok}}}}{{{\bf {{W}}}}_{{\rm{brok}}}}{{{\bf {{Y}}}}_{\rm{a}}}\, + \,{{{\bf {{\rho }}}}_{{\rm{brid}}}}{{{\bf {{W}}}}_{{\rm{brid}}}}{{{\bf {{Y}}}}_{\rm{a}}}\, + \,{{{\rm{{\epsilon}}}}_{\rm{a}}} $$
where Ya is an N × 1 vector of access granted by policymakers (bureaucrats and politicians) to 107 organised interests, and X is the matrix of independent variables: staff resources, membership types, brokerage and bridging network position as well as the coalition to which an organised interest belongs. WYa is the network auto-regressive term and indicates the access enjoyed by other organised interests in the focal actor's network, weighted by the extent to which these organisations are involved in exchange relations with the focal actor. To put it differently, WYa is the vector containing for each observation the weighted average value of access gained by the actors with whom one is connected. We use two weight matrices, one with only the ties within coalitions (Wbrok , brokerage) and another containing the ties between coalitions (Wbrid , bridging), and we row standardise these by dividing each cell in a row by the row sums.Footnote 6 Thus, ρ brok and ρ brid show the extent to which dependencies among observations impact on the access supplied by policymakers and can be considered as a robustness test for the overall models in the sense that they control for interdependence among the units of analysis. Basically, ρ brok and ρ brid control for the extent to which access is affected (positively or negatively) by those to whom an organised interest is socially proximate.
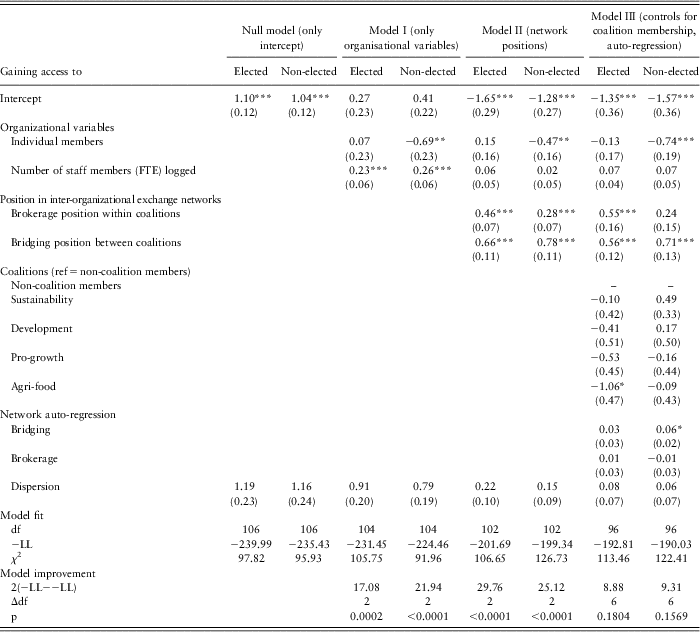
Table 3 presents the results of our analyses. We first analysed the explanatory potential of the variables related to the resource–exchange perspective and subsequently added the coalition-related variables. In a second step, we add evidence on brokerage and bridging. Our final models include additional control variables, namely the auto-correlation term and the coalitions to which organised interests belong. The bottom row indicates the change in goodness-of-fit for each subset of explanatory variables added.
Multivariate test of access (negative binominal regression)

Note. Standard errors between parentheses.
*p < 0.05; **p < 0.01, ***p < 0.001.
Model I tests the importance of staff size and whether the organisation has individual members or not. Both models yield significant results, as the goodness-of-fit is significantly better than the intercept model. These results clearly fit into a picture of expertise-based lobbying that prevails for gaining access to bureaucratic agencies. Namely, the amount of professionals within an interest organisation positively impacts on the number of bureaucrats that grant access to an interest organisation. In contrast, organisations with individual members, compared to organisations with an institutional membership, fare worse when it comes to gaining access to bureaucrats. The picture is slightly different for gaining access to politicians. In model I, a substantial professional staff has a significant positive effect for elected officials, while membership-based organisations have a slight, although statistically non-significant, advantage. Based on these models, one might conclude that access is primarily a matter of spending resources, especially for gaining access to bureaucrats.
Next, we add the two explanatory factors referring to the network position an organisation occupies within and between coalitions (model II). The first thing we notice is that the fit of these models is significantly better than the previous models. Importantly, the impact of organisational resources declines substantially. Generally, these results indicate that resources – in terms of professional staff members – are not the most important factors for gaining access. Still, individual membership is clearly not beneficial for gaining access to bureaucrats. Most of the initial explanatory power of resources (model I), however, is offset by adding information on network positions. The position an interest group occupies within and between a coalition significantly improves its access to public officials. While bridging and brokerage positions are both important for gaining access to elected and non-elected officials, overall, bridging positions seem to be more important. A strong bridging position is clearly more important for gaining access to bureaucrats than brokerage positions are.
Model II adds information on coalitions and the auto-correlation terms as control variables. As expected, the coalition effect is most acute for the access gained to elected officials. When we look at the estimated probability changes (by comparing Expβ), we observe that the coalition effect is larger for elected officials than for non-elected officials. The type-III main effects for the coalition variables show that the likelihood ratio in the case of access to politicians is statistically significant (df = 4, χ 2 = 10.76, p = 0.0294), but not for access to bureaucrats (df = 4, χ 2 = 7.85, p = 0.0973). The agri-food coalition gains much less access to elected officials (Expβ = 0.35) compared with the other three coalitions for which Expβ varies between 0.59 and 0.90 (see also Figure 3). No such strong coalition effect is observed for access to bureaucrats. In sum, access granted by politicians is more sensitive to coalition membership than access granted by bureaucrats.
The auto-correlation terms have little impact. The only significant effect relates to the positive effect that network auto-correlation for the bridging ties has on access to bureaucrats. This means that the access enjoyed by “acquaintances” with whom one exchanges has a positive impact on an organised interest's access. This finding not only confirms the importance of bridging, but it also shows that, when it comes to bridging ties, competitive effects are not that strong. The access enjoyed by ego's distant acquaintances does not jeopardise ego's own access. The coalition effects and auto-correlation terms also show that brokerage and bridging ties are of a somewhat equal importance to elected officials, yet the effect of bridging ties is more pronounced for non-elected officials. When evaluating these final models, two aspects are important. First, adding control variables, including the robustness tests for endogeneity, has very little impact on our expected results for network positions. Second, although some of these control variables generate some impact, they do not significantly improve the overall model fit (compared to the more parsimonious model II).
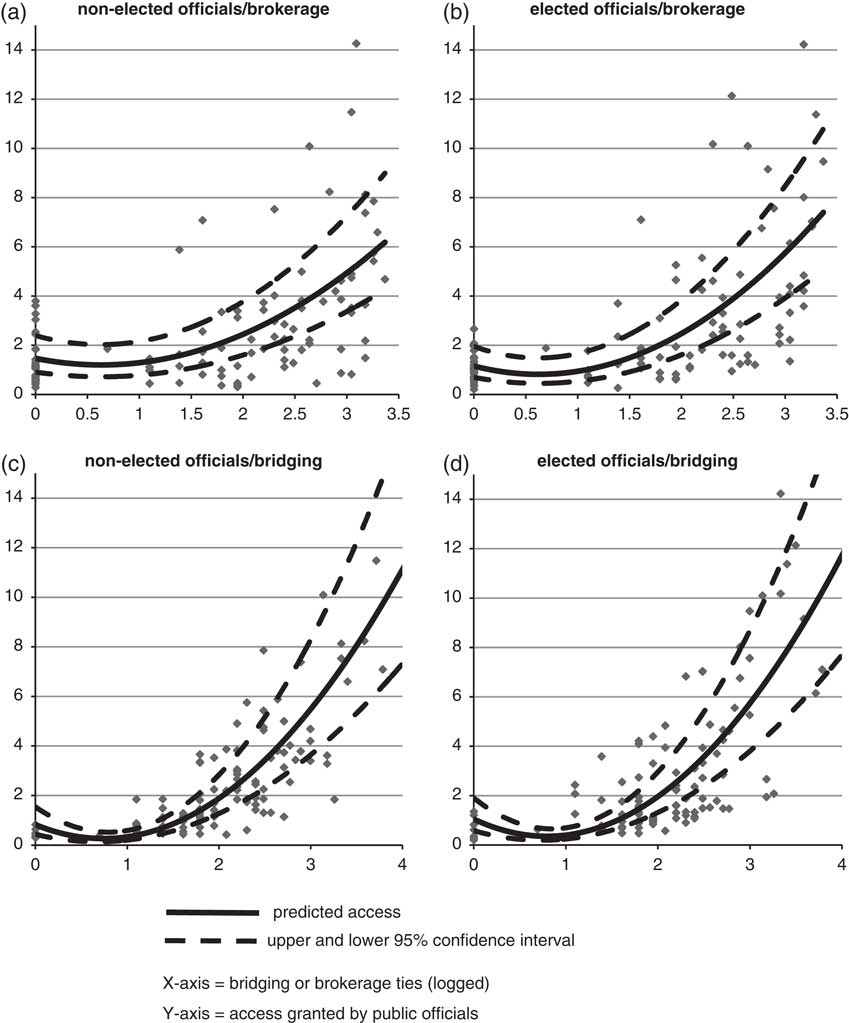
As hypothesised, not all ties are equal and, clearly, as the parameters in models II and III demonstrate, bridging ties carry more weight. In Figure 4, we compare the predicted effect of ties that bridge distinct actors with within-coalition positions on gaining access to non-elected and elected officials (logged ties on the x-axis; access granted by public officials on the y-axis). The results demonstrate the more pronounced effect of the bridging ties, especially compared to the effect of brokerage ties on gaining access to non-elected officials. When we compare the average effect of the smallest 10th percentile with the largest 10th percentile of bridging and brokerage ties, the effect of brokerage ties for gaining access to non-elected officials increases with a factor of 2.2 and for elected officials with a factor of 5.9. For bridging ties, access increases with a factor of 5.6 for the highest 10th percentile to elected officials and with a factor of 8.3 for access to non-elected officials. The average access groups within the highest 10th percentile of bridging ties gain from non-elected officials is a factor 1.7 higher than from elected officials. Average access of interest groups within the highest percentile of bridging ties to non-elected officials is a factor 5.7 higher than for groups within the highest percentile of brokerage ties. These results imply that the pivotal position of an organisation within its coalition is not that important for gaining access to bureaucrats, while such central positions are somewhat more relevant for gaining access to elected officials. Overall, ties that connect distant actors are more important than holding a central position within a coalition for gaining policy access, both for elected and non-elected officials.
Predicted access for changes in bridging and brokerage ties (model III; other variables held constant).

Conclusion
Our objective was to demonstrate the importance of network positions for gaining access to policymakers. Overall, it is clear that the position an interest group occupies within a larger inter-organisational network generates substantial explanatory leverage. Importantly, our empirical analyses demonstrate the structural differences between access supplied by elected and non-elected policymakers. The gaining of access to elected officials – politicians and parties – is much more affected by a central brokerage position within a coalition, while such a position is less crucial for gaining access to bureaucrats. Access to bureaucrats is more related to ties that bridge actors who belong to different, sometimes opposing, coalitions. Taking into account inter-organisational networks and coalition patterns clearly adds to our understanding of interest group access. Our findings show that they are at least as important as the traditional resource-based explanations. Importantly, however, our results do not necessarily imply that organisational resources are completely irrelevant for interest group politics. Resource endowment remains important, although to a smaller degree and in a different way, as a minimal level of resources is needed in order to get an interest organisation established and to maintain it. Rather, our results demonstrate that the resources an individual interest organisation spends on lobbying are probably less crucial during policymaking processes and that policymakers tend to conceive factors such as network positions and coalition membership as important sources of information.
Two aspects of our research design deserve special attention. First, Dutch neo-corporatism, with its institutionalised system of hierarchical interest representation and tradition of coalition governments, may render a central network position of interest groups as representatives of a large coalition more important compared to pluralist systems. Interestingly, our results seem to travel well to other systems, as similar findings on the importance of weak and bridging ties for gaining access in a more pluralist system suggest (Phillips Reference Phillips1991; Carpenter et al. Reference Carpenter, Esterling and Lazer1998). These equivalent research outcomes are important, as they suggest that similar observations in highly different polities imply that factors related to the social context of interest groups are potentially more important explanatory factors than political-administrative and institutional factors or organisational resources. Overall, our key finding on the importance of network positions and its differential effect in gaining access to either politicians or bureaucrats is robust (Poppelaars Reference Poppelaars2009b; Braun Reference Braun2012).
Second, a statistical analyses in itself cannot identify causal claims, and one might easily reverse the causal nature of some multivariate results. For instance, prominence in an exchange network among organised interests might be the result of an organisation's degree of access rather than a cause of it. One could argue that transaction costs lead policymakers to prioritise their supply of access to a limited number of interest groups, and it is because of this varying supply that these interest groups become relevant interlocutors for other groups. The causal order we put forward – network position of interest groups influences access – is consistent with much of the empirical literature on access networks (Carpenter et al. Reference Carpenter, Esterling and Lazer1998, Reference Carpenter and Esterling2003, Reference Carpenter and Esterling2004; Heaney Reference Heaney2004, Reference Heaney2006). Our understanding of network positions relies on some assumptions about the information actors with different network positions are able to supply. Basically, some network positions allow actors to obtain specific sorts of policy-relevant information, and it is these features of network positions that shape access. One important implication is that changes in network positions are consequential for the information actors are able to exchange and the propensity of public officials to grant them access.
Importantly, however, is that this causal order does not exclude other causal orders. Therefore, one needs to be careful with the interpretation of the findings, especially regarding the precise direction of the relationship. Nonetheless, reversing the causal order does not necessarily invalidate our most important findings. Our results demonstrate important implications regarding which ties in a policy network are most consequential. Much research concentrates on brokerage positions, and few studies have systematically distinguished different types of policymakers. The distinction we draw between bridging and brokerage highlights an interesting variation in motives of bureaucrats and politicians in their exchanges with interest groups. Bureaucrats seem less interested in partisan information that relates to a particular coalition, while politicians are keen to receive information about the political support of mobilised coalitions. The data we analysed do not show how exactly individual policymakers assume or perceive that an interest organisation occupies a bridging or brokerage position and which sort of informational qualities policymakers attribute to such positions. Additional analyses are needed to get a more in-depth grasp of how policymakers value the network positions of interest groups. Still, our findings correspond with other recent research on the different motives of non-elected versus elected policymakers to provide interest group access (Poppelaars Reference Poppelaars2009b; Braun Reference Braun2012) and earlier research on how different types of expertise are needed in order to obtain access to different EU officials (Beyers Reference Beyers2002; Bouwen Reference Bouwen2002; Eising Reference Eising2004, Reference Eising2007; Beyers and Kerremans Reference Beyers and Kerremans2012).
Our analyses demonstrate that the capability to connect actors in distinct coalitions is more relevant for gaining access than the coalition to which an organised interests belongs. This is important for several reasons. Apparently, ideological motives are less crucial in the relations public policymakers establish with organised interests than technocratic and strategic motives (see also Laumann and Knoke Reference Laumann and Knoke1987; Heinz et al. Reference Heinz, Laumann, Nelson and Salisbury1993). In addition, while most interests tend to coalesce primarily with like-minded groups, those with additional and complementary networks attract more attention from policymakers.
This latter result, however, does not mean that coalitions are irrelevant. Coalitions remain important, as they structure the overall interest intermediation system in sets of similar organisations that get represented through brokers and bridge builders. But if bridging ties are so important, one may wonder why organised interests do not invest more resources in developing such ties instead of concentrating most of their exchanges with closely aligned organisations. One possible reason is that organised interests are also risk averse and tend to reduce uncertainty by close collaboration with like-minded organisations (Carpenter et al. Reference Carpenter and Esterling2003). Moreover, the information interest group officials obtain from their distant acquaintances, who might happen to be their opponents, might be seen as less reliable and trustworthy. In addition, interest groups do not only seek optimal information transfers, but political attention as well. Compared to organisations that are not part of a coalition, coalescing with other like-minded actors clearly enhances the chances of access. This access is not necessarily equally distributed among coalition members, but when coalition leaders enjoy substantial access, aligning to a coalition may help to gain indirect access. This implies a trade-off between investing in and aligning oneself to a stable and cohesive set of like-minded actors with clearly identifiable leaders and developing additional bridges with other organised interests. Our results suggest that the trade-off between coalition membership or occupying a peripheral position with many bridging ties should be sensitive to the type of policymakers – elected or non-elected officials – the organisation assumes to be its prime target for exerting influence.
Acknowledgements
This paper was presented at several international conferences and workshops, including the Netherlands Institute of Government (NIG) Annual Conference (Maastricht, 2010), the CERGU research seminar (Gothenburg, 2011) and the Political Studies Association's Annual Conference (London, 2011). We would like to express our gratitude to all those who provided us with helpful comments, in particular William A. Maloney, Bart Kerremans and Daniel Naurin. This research has been made possible by a grant from the Research Foundation-Flanders (Grant G.0187.02 and the Odysseus Program). The project has been developed in co-operation with researchers from the University of Leuven, Leiden University, Wissenschaftzentrum Berlin and CEVIPOF Paris.
Appendix 1: Measuring the persuasion network

Appendix 2: Measuring the exchange network
Based on pre-determined list of actors, we asked our respondents to identify actors with which they exchanged information and collaborated with. The list included all actors that were identified and sampled during the pre-research and whom were interviewed during the fieldwork (see Table 1).