Surgical site infections (SSIs) are the most common hospital-acquired infections;Reference Pittet, Harbarth and Ruef 1 they complicate approximately 5% of the estimated 30 million operations that occur annually in the United States.Reference Horan, Culver, Gaynes, Jarvis, Edwards and Reid 2 SSIs significantly increase healthcare costs,Reference Boyce, Potter-Bynoe and Dziobek 3 cause pain in patients, increase the risk of hospital readmissions and death, and make repeated procedures more likely.Reference Whitehouse, Friedman, Kirkland, Richardson and Sexton 4 – Reference Nespoli, Gianotti and Totis 7
Healthcare organizations want to decrease the likelihood of SSIs in their institutions. This requires an ability to track SSIs to both monitor their incidence and determine the efficacy of interventions that are introduced to fight SSIs. Primary data collection is usually necessaryReference Grammatico-Guillon, Rusch and Astagneau 8 but can be prohibitively expensive and time-consuming, partly because patients need to be followed after hospital discharge.
Given the burden of primary data collection, people have developed methods to identify SSIs using routinely collected administrative data and clinical data repositories. Some accurate procedure-specific administrative data algorithms have been developed.Reference Grammatico-Guillon, Baron, Gaborit, Rusch and Astagneau 9 Other studies using administrative databases have found that SSI identification for a broad assortment of procedures is imprecise. For example, Song et alReference Song, Cosgrove, Pass and Perl 10 studied CABG and surgeries requiring craniotomy and reported that the combination of 5 distinct criteria derived from a hospital discharge abstract database had low positive predictive values, which varied between 10% and 20%.
To completely measure surgical infection burden, ideally, healthcare organizations could use routinely collected administrative data to monitor SSI rates after all surgeries. Accurate identification of SSIs using health administrative data in a broad surgical population is difficult because of the wide array of procedures layered on top of multiple postoperative infections with varied presentations and described in different terms. This lack of data homogeneity results in a vast number of combinations of procedure and complication codes, which even taken individually would lack specificity to reliably identify SSIs. In this study, we sought to determine whether this issue could be addressed using multiple administrative datasets and data mining techniques to more accurately predict the probability that a person who had undergone any surgery in hospital developed an SSI within the subsequent 30 days.
METHODS
Study Overview
This study was conducted in Ontario, Canada, where all hospital, emergency, and physician services are covered by a publicly funded healthcare system. We anonymously linked a cohort of surgical patients identified via primary data collection with population-based health administrative data to derive a model that estimated the probability that a patient would develop an SSI within 30 days of an operation. This model was then tested in 2 temporally or geographically distinct validation cohorts. The study was approved by the research ethics boards of the respective hospitals.
Surgical Cohorts
All patients in our derivation cohort were recruited into the American College of Surgery—National Surgical Quality Improvement Program (NSQIP) and underwent surgery at a large, multi-institutional teaching hospital between March 2010 and February 2012. NSQIP collects preoperative data and 30-day morbidity outcomes on patients undergoing major operations. Cases from all surgical specialties were sampled from the institution’s operative log. The following exclusion criteria were applied: the patient was <18 years old; the surgical indications included acute trauma, transplantation, or brain-dead organ donor; the patient had already been included in the program within the previous 30 days; or the procedure was either an inguinal herniorrhaphy, breast lumpectomy, laparoscopic cholecystectomy, or transurethral resection of the prostate and 3 examples of the procedure had already been sampled within the current 8-day sampling cycle.
Data were uniformly collected by trained personnel using standard data collection sheets and were subjected to quality checks by NSQIP. Postoperative information was collected in a review of the in-patient medical record, outpatient charts, and phone calls or letters to the patients. For each person in our NSQIP derivation cohort, we extracted the date of the surgery and the 30-day SSI status. Patients were required to have a valid health card number (ie, to allow linkage to the health administrative data) to be included in the study.
Patients in the internal validation cohort were enrolled into NSQIP at the same institution as the derivation cohort between March 2012 and March 2014; patients in the external validation cohort were enrolled into NSQIP from another the general surgery service at a different multi-institutional teaching hospital between March 2012 and September 2013. Data collection methods were the same as those for the derivation cohort. At the time of the study, the participating hospitals were the only institutions in Ontario that participated in NSQIP.
Linkage to Population-Based Administrative Data
To these datasets, we appended the patient’s health card number, which was then encrypted to permit confidential linkage with population-based administrative datasets. We first mined the Discharge Abstract Database (DAD) using each patient’s healthcare number and the date of their surgery to identify the record of the hospitalization containing the surgery (ie, index hospitalization). DAD captures all hospitalizations and same-day surgeries in Ontario, all admission and discharge dates, diagnoses, and procedures are included.
Using the same encrypted healthcare number, we mined several other population-based databases to retrieve records for all healthcare encounters that occurred within 30 days of the procedure. We linked to the Physicians Services Database (PSD) to retrieve all claims for physician encounters (PSD captures all physician services billed to the public system), to the National Ambulatory Care Reporting System (NACRS) to retrieve all emergency department encounters (NACRS captures all emergency room visits recording diagnoses as ICD-10 codes), and to the DAD again to identify all post-discharge hospitalizations (ie, readmissions).
Outcome
The primary outcome for the study was any SSI identified within 30 days of surgery using primary data collection with the NSQIP methods described above and defined using NSQIP criteria (Appendix A). In the presence of an open wound, SSIs were counted only if they were initially detected >2 days after the operation. Infections present prior to surgery were not counted as SSIs.
Analysis
All analyses were performed using SAS version 9.3 (SAS Institute, Cary, NC, USA). When creating our analytical dataset to derive our model, we sought to collect information from the administrative datasets that could either indicate a risk factor for developing an SSI or identify an SSI that had occurred.
We used 3 approaches for handling diagnostic, procedural, and physician fee codes, which had a myriad number of discrete values. First, we identified a priori all diagnostic codes (ie, using the International Statistical Classification of Diseases and Related Health Problems, 10th revision, Canada [ICD-10-CA]) whose description included any terms (eg, infection, cellulitis, abscess, or infected) that potentially indicated an infectious process or the influence of an infectious process on a wound (eg, disrupted) (Appendix B). Second, for procedural codes of the index hospitalization, we used a risk index (ie, the previously derived CPT-3 scoreReference van Walraven and Musselman 11 ) to assign risk to each index hospitalization using both Current Procedural Terminology (CPT) codes and Canadian Classification of Health Interventions codes. This score quantified the risk of SSI for each procedure independent of known risk factors. The CPT3 score varied from 0 to 4.07; scores less than 1 indicated procedures having an SSI event rate that was less than expected (after accounting for known risk factors). The use of this score allowed us to account for individual procedural risk and create an omnibus SSI risk model that applies to all procedures.
Finally, we developed 4 code-risk scores that quantified the independent association of different codes from various datasets with SSI status. We created these risk scores using the following data: (1) diagnostic codes during the index admission; (2) physician fee codes for all post-operative physician claims; (3) diagnostic codes in all post-discharge emergency department encounters; and (4) diagnostic codes in hospital abstracts for all readmissions. The latter 3 risk scores included records if they occurred up within 30 days after the operation.
Each of these 4 risk scores were independently created using the same steps: (1) We identified all codes whose univariate association with SSI status had a P value of <.1. (2) We created a binary logistic regression model that used stepwise variable selection to determine which codes from step 1 were independently associated with SSI status. (3) We then used the methods of Sullivan et alReference Sullivan, Massaro and D’Agostino 12 to transform the final logistic model from step 2 into a point system (ie, the risk score). Because the diagnostic and fee codes used to indicate SSI vary by specialty and surgical type, we stratified all logistic models by specialty in the following categories: orthopedic, general surgery, urology/gynecology, and other. We clustered codes by their first 3 alpha-numerics.
We then created the SSI risk model using binary logistic regression with stepwise variable selection. To prevent overfitting, the association of covariates with SSI had to have a P≤.0001 to remain in the model. Model discrimination and calibration were assessed.
The discrimination and calibration of the final model was tested in the validation cohorts. Because of the significant differences in SSI risk between the derivation and validation cohorts (even after adjusting for the covariates in the SSI risk model), we used logistic regression methods (on a dataset containing all 3 cohorts) to regress SSI status against the source cohort after adjusting for SSI predicted risk from the SSI risk model (expressed as each observation’s linear predictor function). The parameter estimate for each validation cohort was added to the intercept of the SSI risk model to calculate “prevalence corrected risk estimates” for the validation groups with the SSI risk model.
RESULTS
A total of 6,107 patients were entered into NSQIP and the derivation cohort; 5,747 (94.1%) of these patients had a valid healthcare number. Patients were excluded if they had previously been entered into NSQIP (114, 2.0%) or if their index surgical admission could not be identified in DAD (274, 4.8%).
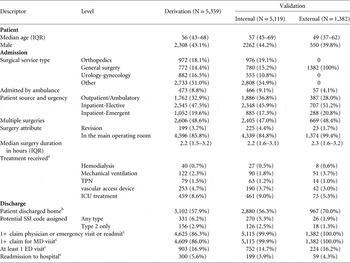
Thus, 5,359 patients remained in the derivation cohort (Table 1); these patients were generally middle-aged with an American Society of Anesthesiologists score of primarily 2–3. Almost half of the operations were inpatient and elective or could be categorized under orthopedics, general surgery, or urology-gynecology. More than 90% of patients had a clean or a clean/contaminated wound.
Description of Derivation and Validation Study Cohorts

NOTE. IQR, interquartile range; TPN, total parenteral nutrition; ICU, intensive care unit.
a During the index hospitalization.
b Does not include patients discharged to rehabilitation centers.
c Within 30 days of the operation.
Overall, 324 derivation patients (6.0%) developed an SSI within 30 days of their operation, only 118 of whom (36.4%) developed an SSI while still in the hospital. Of the SSIs, 218 (67.2%) were categorized as superficial, 28 (8.6%) were deep, and 78 (24.1%) were organ-space related. SSI rate varied notably between services. After orthopedic surgeries, 27 of 972 (2.8%) patients developed SSIs; after general surgery, 116 of 772 (15.0%) patients developed SSIs; after urology-gynecology surgeries, 58 of 882 (6.7%) patients developed SSIs; and after other surgeries, 123 of 2,733 (4.5%) patients developed SSIs.
Index Hospitalization Diagnostic Score
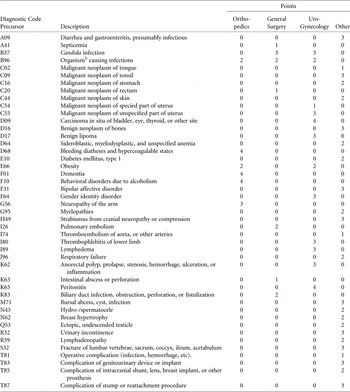
Many diagnostic code precursors recorded for the index hospitalization were independently associated with any SSI (Appendix C). Previously, we had identified only 5 of these diagnostic code precursors (ie, M71, bursal abscess; T81, operative infection; T83, complication of genitourinary device; T85, complication of intracranial shunt; and T87, complication of stump). Only 3 diagnostic code precursors (ie, B37, Candida infection; B96, infectious organism; and E66, obesity) were present for >1 specialty. Most patients had an index hospitalization diagnostic score of 0 (n=4,622, 86.2%); 277 patients (5.2%) had a score of 1; and 460 patients (8.6%) had a score ≥2.
Physician Claims Score
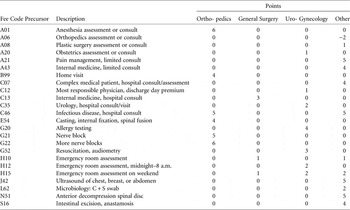
The postoperative physician fee-code precursors independently associated with SSI are listed in Appendix D. Only 3 fee-code precursors were common to more than 1 specialty group: C46, infectious disease hospital consult; H10, emergency room assessment; and H15, emergency room assessment on weekends. Most patients (n=3,920, 73.2%) had a score of 0, while 533 patients (9.9%) had a score that was less than 0 and 906 (16.9%) had a score greater than 0.
Emergency Visit Diagnostic Score
A total of 903 patients (16.9%) had at least 1 post-discharge emergency room visit within 30 days of the index surgery. Only 4 codes were independently associated with SSI status in any specialty (Appendix E). One code (T81, procedure complication) was associated with SSI in all 4 specialty groups. Among the entire patient cohort, 5,031 patients (93.9%) had a score of 0.
Hospital Readmission Diagnostic Score
A total of 384 patients (7.2%) had at least 1 readmission within 30 days of the index surgery. Among these patients, only 2 diagnostic code precursors (Appendix F) were independently associated with the development of SSI: T81, complication of procedure (which was observed in 3 of the 4 specialty groups), and T85, mechanical complication of implant. The vast majority of patients (n=5,284; 98.6%) had a score of 0.
SSI Risk Model
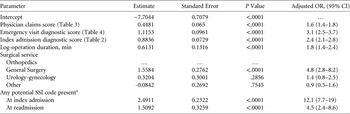
These 4 scores, along with all of the variables presented in Table 1, were input into the logistic regression model. Only 7 covariates, 3 of which were risk scores, met inclusion criteria in the SSI risk model (Table 2). SSI risk was greatest in patients from general surgical services (adjusted odds ratio, 4.8; 95% confidence interval (CI) 2.8–8.2, compared with orthopedics).
Surgical Site Infection Risk Model

NOTE. OR, odds ratio; CI, confidence interval; SSI, surgical site infection.
a See Appendix B.
In the derivation cohort, the model had excellent discrimination (C statistic, 0.912; 95% CI, 0.893–0.931; Figure 1). The predicted probability threshold with the optimal operating characteristics (ie, with the shortest distance from the top left-hand corner of the ROC curve) was a predicted risk of 5% (sensitivity, 82.1%; specificity, 85.6%; positive likelihood ratio, 5.7; negative likelihood ratio, 0.21; positive predictive value, 27.7%; and negative predictive value, 98.6%). Using a predicted probability of 50% yielded the following results: sensitivity, 44.1%; specificity, 99.0%; positive likelihood ratio, 44.1; negative likelihood ratio, 0.56; positive predictive value, 74.5%; and negative predictive value, 96.5%.
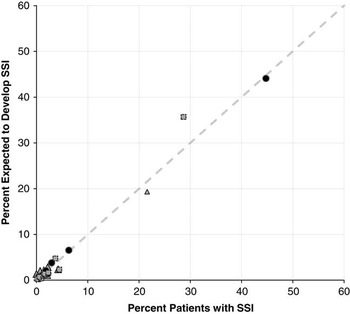
Calibration of surgical site infection (SSI) risk model in the derivation and validation cohorts. All study participants in the derivation and calibration cohorts were classified into 10 equally sized groups based on the predicted risk of SSI from the SSI risk model (Table 2). Within each group the observed percent of patients with an SSI (horizontal axis) was plotted against the expected percent of patients with an SSI (vertical axis). The derivation cohort (circles) is presented along with the internal (squares) and external (triangles) validation cohorts. The dashed diagonal line presents perfect calibration in which the predicted and observed percentages are equal. The Hosmer-Lemeshow (H-L) χ2 statistic for the derivation cohort was 7.6 (associated P=.4692, indicating no evidence for lack of fit); H-L statistics were acceptable for the external validation cohort (8.0; P=.42) but not the internal validation cohort (26.4; P=.0009), with the latter showing significant deviation of expected percentages from those predicted.

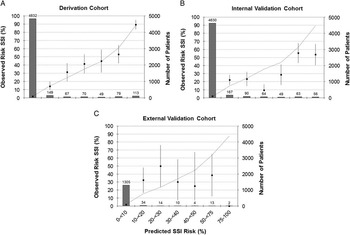
The SSI risk model had excellent calibration in the derivation cohort (Hosmer-Lemeshow χ2 statistic, 7.5; P=.484; Figure 1). The vast majority of patients (90.2%) had a predicted SSI risk that was <10% (Figure 2A). Observed SSI risks did not vary significantly from predicted SSI risks for any predicted risk category.
Calibration plots for derivation and validation cohorts. These plots summarize calibration of the surgical site infection (SSI) risk model for the derivation cohort (A), internal validation cohort (B), and the external validation cohort (C). In each plot, the observed percentage of patients having an SSI within 30 days of surgery (left vertical axis) is plotted against the predicted SSI risk from the SSI risk model (horizontal axis) by the data points (with 95% confidence intervals). Expected SSI rates are presented by the trend line. The number of patients within each predicted risk category is displayed with the histogram and the right vertical axis.

Validation
The internal validation cohort contained 5,119 patients who were essentially identical to the derivation population except for a notable increase in the likelihood of any health service claim being submitted within 30 days of the patient’s surgery (Table 1) and a lower risk of SSI occurring in 234 patients (4.6%), a 23.3% relative decrease.
The external validation cohort (n=1,382) was more distinct from the derivation cohort (Table 1): patients were younger, exclusively underwent general surgery services, and were less likely to have been admitted by ambulance. They were also less likely to develop an SSI (n=50, 3.6%; a 40.0% relative decrease).
Albeit weaker than in the derivation cohort, the SSI risk model remained strongly discriminative in both the internal validation cohort (C statistic, 0.853) and external validation cohort (C statistic, 0.812). The predicted SSI risk from the model (corrected for cohort prevalence) was not as well calibrated in the validation cohorts as for the derivation cohort (internal validation cohort: H-L χ2 statistic, 26.4; P=.0009; external validation cohort: H-L χ2 statistic, 8.0; P=0.42) (Figure 1). In both validation cohorts, patients with an expected SSI risk <10% (who, as in the derivation cohorts, made up >90% of patients) were very accurately identified (Figure 2B and 2C). Expected SSI risk was higher in all other predicted risk categories in both validation cohorts.
DISCUSSION
We successfully derived a model that used health administrative data to accurately determine the probability of 30-day surgical site infection (SSI). This model remained highly discriminative in validation patients and accurately identified the vast majority of patients with a low likelihood of SSI.
Our study results have several implications. First, SSIs have a very broad and heterogenous collection of clinical presentations, terminologies, and classifications that make their identification within large administrative datasets difficult. We tried to identify all possible codes that might indicate an SSI for each type of surgery but found them to be insensitive for SSI identification. Therefore, we used data-mining techniques to sift through a vast array of codes to derive risk scores that summarized code association with SSI. Second, SSI risk model calibration deteriorated in the validation cohorts, especially in patients having an expected SSI risk exceeding 10% (Figures 2B and 2C). This finding likely indicates some overfitting of the model due to the extensive amount of significance testing used to create our model or our modeling techniques (ie, stepwise variable selection methods were used to create the risk scores). However, >90% of patients have a very low expected risk of SSI (ie, <10%), and the SSI risk model accurately identified these patients. Therefore, it is possible that the SSI risk model could be used to identify the large majority of patients in whom the likelihood of SSI is so low that further data collection is unnecessary.
Several aspects of our study should be carefully considered. First, our results highlight the importance of following patients post discharge to determine whether or not an SSI develops. Approximately 65% of the SSIs in our derivation cohort were identified after the patient left the hospital. Second, we found a significant variation between services in the codes that were indicative of SSI. An examination of the risk scores (Appendix C–F) revealed that very few codes were associated with SSI risk in all 4 surgical services, which is likely due to the system-specific nature of coding systems like the ICD. As such, each surgical service, which is treated as a distinct system, has distinct codes associated with their SSIs. A larger derivation population and a larger number of surgical categories, each with a more focused collection of patients, might have increased the accuracy of SSI prediction. Third, a baseline risk is needed to adequately calibrate the SSI risk model to a particular cohort of patients if their baseline risk is distinct from the cohort used to create the SSI risk model. Fourth, while the data-mining methods used to create the code risk scores were helpful to identify unforeseen associations and improve predictive accuracy, some of these methods are clinically unreasonable. Fifth, our study and model did not capture SSIs that occurred beyond 30 days post-surgery. Finally, our model did not include antibiotic information because our administrative data did not capture medication information for people <65 years of age. Our model may have performed better (or be simpler) if we had access to these data.
In summary, our study shows that administrative data can effectively and efficiently be used to identify postoperative patients with a very low risk of having a surgical site infection within 30 days of their procedure at the population level.
ACKNOWLEDGMENTS
Financial support. Dr. van Walraven is employed by the Department of Medicine, University of Ottawa. No other financial support was provided relevant to this article.
Potential conflicts of interest. All authors report no conflicts of interest relevant to this article.
APPENDIX A
Definitions of Surgical Site Infection Used for Derivation and Validation Cohorts (American College of Surgery - National Surgical Quality Improvement Program)
Superficial surgical site infection (SSI): Only skin and subcutaneous tissue of the incision were involved and any of the following were noted, including purulent drainage from the superficial incision; organisms isolated from an aseptically obtained culture of fluid or tissue from the superficial incision; pain, tenderness, localized swelling, redness, or heat with superficial incision being deliberately opened by the surgeon; or diagnosis of superficial incisional SSI by the surgeon or attending physician.
Deep incisional SSI: Deep soft tissues were involved and any of the following were noted: purulent drainage from the deep incision but not from the organ or organ space; a deep incision spontaneously dehisced or was deliberately opened by a surgeon when the patient had a fever, localized pain, or tenderness; an abscess or other evidence of infection involving the deep incision was found on direct examination, during reoperation, or by histopathologic or radiologic examination; or a diagnosis of deep incision SSI was made by a surgeon or attending physician.
Organ-space SSI: Purulent drainage noted from a drain that was placed through a stab wound into the organ space; organisms were isolated from an aseptically obtained culture of fluid or tissue in the organ space; an abscess or other evidence of infection involving the organ space that was found on direct examination during reoperation, or by histopathologic or radiologic examination; or diagnosis of an organ-space SSI was made by a surgeon or attending physician.
APPENDIX B
International Statistical Classification of Diseases and Related Health Problems, 10th revision (ICD10) Diagnostic Codes Potentially Indicating an Infectious Process