Sociocultural issues arrived in the political space of advanced democracies during the late 1960s and early 1970s. The ensuing ideological configuration is familiar. The sexually and culturally egalitarian stances of green parties leaned to the left, while the right, spurred by the radical right, advocated a return to traditional values and monocultural nation-states. Sociocultural issues became broadly salient in the mainstream into the 2000s, creating bipolar conflict over a wide range of social issues.
Today, sociocultural issues dominate the political agendas in most West European states (De Vries, Hakhverdian and Lancee Reference De Vries, Hakhverdian and Lancee2013; Green-Pedersen and Otjes Reference Green-Pedersen and Otjes2019; Hooghe and Marks Reference Hooghe and Marks2009; Hooghe, Marks and Wilson Reference Hooghe, Marks and Wilson2002; Kriesi Reference Kriesi1998; Kriesi et al. Reference Kriesi2006), yet the most salient issues differ from those of the ‘post-materialist era’. The sociocultural divide of the twenty-first century pertains to questions of national identity and state sovereignty, which emanate from increasing globalization, supranational governance, and immigrant and refugee flows. These processes, and their electoral consequences, have been underway since the 1980s (see Bornschier Reference Bornschier and Rydgren2018; Kriesi et al. Reference Kriesi2006; Kriesi and Bornschier Reference Kriesi, Bornschier and Rydgren2012). However, the European Union's (EU's) difficulty in handling the debt crisis of the late 2000s and the influx of Syrian refugees onto the shores of the continent in the mid-2010s more clearly highlight the tensions wrought by globalization. Unprecedented concern with such issues culminated in a resurgence of green, radical left and particularly, radical right, parties across Europe during the mid-2010s (see Hobolt and De Vries Reference Hobolt and De Vries2016; Hobolt and Tilley Reference Hobolt and Tilley2016; Hooghe and Marks Reference Hooghe and Marks2018).
As in the 1980s, today the poles of the sociocultural dimension are inhabited by greens and the radical right (see De Vries Reference De Vries2018; De Wilde et al. Reference De Wilde2019; Hooghe and Marks Reference Hooghe and Marks2018; Norris and Inglehart Reference Norris and Inglehart2019). Does this mean sociocultural conflict today is just ‘more of the same’? Individuals who oppose immigration are generally assumed to be conservative on other social issues (see, for example, Duckitt and Sibley Reference Duckitt and Sibley2009; Flanagan and Lee Reference Flanagan and Lee2003; Hooghe and Marks Reference Hooghe and Marks2018; Inglehart Reference Inglehart1997; Jost et al. Reference Jost2003; Kitschelt Reference Kitschelt1995; Kriesi et al. Reference Kriesi2006; Malka, Lelkes and Soto Reference Malka, Lelkes and Soto2019; Treier and Hillygus Reference Treier and Hillygus2009) (for exceptions, see Baldassarri and Gelman Reference Baldassarri and Gelman2008; Baldassarri and Park Reference Baldassarri and Park2020; Caughey, O'Grady and Warshaw Reference Caughey, O'Grady and Warshaw2019; Feldman and Johnston Reference Feldman and Johnston2014; Lancaster Reference Lancaster2019; Weeden and Kurzban Reference Weeden and Kurzban2016). Yet this may not be a tenable assumption in all circumstances. I contend that the cohesion of sociocultural attitudes is more contextually variable than is commonly assumed.
In this article, I examine West Europeans' attitudes towards gender egalitarianism and immigration. As previous work has shown, this region is becoming more and more ‘post-materialist’, as generational attitude change occurs (Caughey, O'Grady and Warshaw Reference Caughey, O'Grady and Warshaw2019; Inglehart Reference Inglehart1977; Inglehart Reference Inglehart1997). Progressive attitudes regarding issues such as women's rights, LGBTQ rights and environmentalism are increasing in the aggregate (Caughey, O'Grady and Warshaw Reference Caughey, O'Grady and Warshaw2019; Inglehart Reference Inglehart1997). In light of this increasing progressivism, the record-high vote shares of radical right parties in the past several years seems paradoxical. While this could be in part a voter turnout story (see Norris and Inglehart Reference Norris and Inglehart2019, 14), I argue that broader, generational value changes are a more profound driver.
In particular, I argue that a new type of sociocultural attitude configuration has taken hold among younger generations in many West European countries, which combines opposition to immigration with support for progressive issues such as gender and sexual equality. This configuration is justified through a ‘nationalisation of liberal values’ (see Lægaard Reference Lægaard2007), wherein classical liberalism is used to define the boundaries of the nation.Footnote 1 In this sense, the ‘imagined community’ (see Anderson Reference Anderson1983) of the nation-state is one in which tolerance, liberal democracy and European ‘Enlightenment values’ reign supreme and distinguish ‘us’ from ‘them’. The idea of liberal values as boundary demarcation originated with political theorists such as Kymlicka (Reference Kymlicka1995) and Joppke (Reference Joppke2004), who argue that the accommodation of minority practices and beliefs via multiculturalism presents a unique challenge to liberal states: it demands the acceptance and tolerance of minorities, even if those minorities engage in illiberal practices that violate state principles (see also Barry Reference Barry2002; Lægaard Reference Lægaard2007; Parekh Reference Parekh1996). Therefore, a minority's inability or unwillingness to adhere to a state's liberal values can serve as a justification for its exclusion.
Increased Muslim immigration and asylum seeking over the past few decades in Western Europe has, for some, exposed perceived weaknesses of multiculturalism, as governments and policy makers have struggled with issues of accommodation and assimilation (Geddes and Scholten Reference Geddes and Scholten2016; Joppke Reference Joppke2014; Sniderman and Hagendoorn Reference Sniderman and Hagendoorn2007). As such, multiculturalism does not enjoy the same broad acceptance as other progressive values. Even radical right parties such as the Dutch Party For Freedom (PVV), Sweden Democrats and the Danish People's Party now draw rhetorical distinctions between Europe's ‘progressive’ and ‘Enlightened’ norms surrounding gender and sexuality and the ‘intolerance’ and ‘conservatism’ of Muslim immigrants (Akkerman Reference Akkerman2005; Akkerman Reference Akkerman2015; Campbell and Erzeel Reference Campbell and Erzeel2018; De Lange and Mügge Reference De Lange and Mügge2015; Farris Reference Farris2017; Lancaster Reference Lancaster2019; Meret and Siim Reference Meret and Siim2013; Mudde and Kaltwasser Reference Mudde and Kaltwasser2015; Spierings and Zaslove Reference Spierings and Zaslove2015; Vossen Reference Vossen2011). As the 2010 PVV manifesto emblematically states, Muslim immigration ‘flushes decades of women's emancipation down the toilet’ (quoted in Mudde and Kaltwasser Reference Mudde and Kaltwasser2015).
In this article, I examine gender attitudes (a classic post-materialist issue), immigration attitudes (a national identity issue) and the relationship between them using an eleven-wave, nationally representative household panel survey from the Netherlands (Longitudinal Internet Studies for the Social Sciences, LISS) over the period 2007–2019, as well as the 2017 wave of the European Values Study (EVS). I focus on gender attitudes for two reasons. First, the struggle over women's rights was a central conflict in the post-materialist era, but has since become ‘settled’, particularly in Western Europe. Therefore, it is a representative issue exhibiting the value change theorized to result from modernization. Secondly, the debate over immigration and multiculturalism has shifted away from economic concerns to decidedly gendered concerns. It is common for anti-immigrant politicians to speak of women's rights as a sort of cornerstone of Western society – a cornerstone that is supposedly lacking in the Muslim world. The implication is that immigration skeptics can relate to this basic point of reference – particularly those, such as women, who have historically avoided anti-immigrant parties – and will be motivated to vote for such parties not despite, but because of, their liberal attitudes.
The Netherlands is a vanguard case of how intolerance of immigrants can flourish in progressive societies, making it an ideal test for my hypotheses. Once home to a highly structured (‘pillarized’) party system (Adams, De Vries and Leiter Reference Adams, De Vries and Leiter2012; Knutsen Reference Knutsen2004; Mair Reference Mair2008), the Dutch electoral scene weakened slowly for many years and then fractured with the founding of the anti-immigrant Pim Fortuyn List in the early 2000s. The backlash against immigration and multiculturalism in the tolerant Netherlands was unexpected but not merely a flash in the pan, for these issues have been taken up by other politicians and parties in the years since, keeping them on the country's political agenda (Geddes and Scholten Reference Geddes and Scholten2016; Sniderman and Hagendoorn Reference Sniderman and Hagendoorn2007). The Dutch may have been the first to popularize ‘liberal’ opposition to immigration, as a country that prides itself on tolerance (see Sniderman and Hagendoorn Reference Sniderman and Hagendoorn2007). Yet the unlikely combination of tolerance for women and sexual minorities and intolerance of foreigners, particularly Muslims, is not exclusive to the Dutch context. Similar phenomena are occurring across the continent, such as in Denmark, Sweden and France (De Lange and Mügge Reference De Lange and Mügge2015; Lancaster Reference Lancaster2019; Meret and Siim Reference Meret and Siim2013; Spierings, Lubbers and Zaslove Reference Spierings, Lubbers and Zaslove2017). Lancaster (Reference Lancaster2019) finds that growing groups of voters, even in more conservative countries such as Switzerland, combine strong anti-immigrant sentiment with support for gender and sexual equality. This is far from the argument that all anti-immigrant individuals in Europe are liberal, but as greater acceptance of women's and LGBTQ rights spreads, while immigration remains a chief concern, this attitude configuration may become quite prevalent.
This article finds that gender egalitarianism is widely accepted by younger generations and that individuals' gender attitudes become more progressive over time. Immigration attitudes, in contrast, vary little across birth cohorts and remain remarkably stable over the course of the panel. I further show that the differing trajectories of change for these two attitudes affect their correlation across generations. In particular, gender and immigration attitudes are more weakly correlated in those born during and after the ‘post-materialist era’. This implies that the assumption that anti-immigrant voters are conservative in other realms is most applicable to older voters and is thus losing significance over time, to varying degrees cross nationally.
The evidence presented here speaks to the literature on issue constraint and bundling (Adams, De Vries and Leiter Reference Adams, De Vries and Leiter2012; Converse Reference Converse and Apter1964; De Vries Reference De Vries2018; Ellis and Stimson Reference Ellis and Stimson2012; Gidron Reference Gidron2020; Malka, Lelkes and Soto Reference Malka, Lelkes and Soto2019). Issues that are commonly considered to ‘go together’ may do so to different degrees across space and time, and my analysis of birth cohorts suggests that socialization processes play a key role in this variation. Secondly, my use of panel data provides insight into the stability of attitudes about salient and divisive political issues (see also Bechtel et al. Reference Bechtel2015; Kustov, Laaker and Reller Reference Kustov, Laaker and Reller2019). Panel data allow one to establish that attitudes on certain issues can be resilient to political shocks as well as life cycle change. Additionally, my findings are consistent with the proposition that European electorates are polarizing around a new ‘transnational cleavage’, wherein politics is dominated by neither materialist nor post-materialist concerns, but rather by contestation about the borders around the community: ‘Who is one of us?’ (see De Wilde et al. Reference De Wilde2019; Hooghe and Marks Reference Hooghe and Marks2018; Hooghe, Lenz and Marks Reference Hooghe, Lenz and Marks2019). Hence, the cultural backlash across Europe does not appear to be targeted wholesale against progressive values. Rather, it is focused on protecting the ‘national community’ and its values, the content of which is context specific.
The following two sections develop my theoretical argument. Building on scholarly work on the sociocultural dimension, I argue that only in older cohorts is the combination of opposition to immigration and social conservatism likely. The two dimensions are weakly related in younger cohorts due to broad acceptance of progressive gender attitudes and broad skepticism of immigration and multiculturalism. Then, I introduce the data and measures, and present my results. I conclude with a discussion of the implications.
The Sociocultural Dimension
The sociocultural, or GAL-TAN,Footnote 2 dimension is a fault line between traditional and modern ways of life. This dimension arose during the 1970s with the decline of the traditional class-based (economic left–right) cleavage discussed by Lipset and Rokkan (Reference Lipset and Rokkan1967). As Inglehart (Reference Inglehart1977) argues, increasing affluence and prosperity allowed Western societies to turn their attention away from survival concerns and towards ‘cultural or “ideal” politics…issues that derive more from differences in life-style than from economic needs’ (Inglehart Reference Inglehart1977, 13). These issues included ‘the role of women, protection of the environment, the quality of life…the redefinition of morality, drug usage, and broader public participation in both political and non-political decision-making’ (Inglehart Reference Inglehart1977, 13). Inglehart (Reference Inglehart1977) argued that conservative attitudes would dwindle through the process of cohort replacement as younger, post-materialist individuals came of age and began to influence politics.
Newfound green and other ‘new left’ parties were the main beneficiaries of this political shift, as existing parties were largely unable to alter their appeals for fear of weakening their constituencies (Inglehart Reference Inglehart1977). Socialist and social democratic parties were an exception; they began to abandon pro-labor policies in pursuit of the new, and rapidly growing, middle class (Bornschier Reference Bornschier2010; Kriesi and Bornschier Reference Kriesi, Bornschier and Rydgren2012). According to the theory of ‘cultural backlash’, the confluence of rapid economic and sociocultural change left traditionally minded manual laborers behind and created a political vacuum waiting to be exploited. Since the post-industrial service economy and old left parties now catered to the highly educated middle class, and because increasing economic prosperity led to the advent of progressive sociocultural political agendas, new parties – radical right parties – formed, giving working-class men a new political home (Bornschier Reference Bornschier and Rydgren2018; Inglehart Reference Inglehart1997; Kitschelt Reference Kitschelt1995).
While the post-materialist left focused its attention on ‘multiculturalism, gender and racial equality, and sexual freedom’ (Golder 2016, p. 483), the radical right turned toward hierarchy and particularism, ‘demand[ing] the protection of (patriarchal) family values and a nationally-oriented immigrant-free way of life’ (Meguid Reference Meguid2005, 348). Therefore, the TAN side of this dimension combines nationalism with support for traditional families and gender roles, whereas the GAL pole focuses on multiculturalism, egalitarianism and social libertarianism. These issues need not necessarily fit together, however, as I discuss further below.
Theory and Hypotheses
Whether today's anti-immigrant constituency is fundamentally different from that of the past is debated. The debate is important because it has implications for how we understand current political contestation. Some scholars, most notably Norris and Inglehart (Reference Norris and Inglehart2019) (see also Inglehart and Norris Reference Inglehart and Norris2017), argue that the nationalist voters of the 2010s are engaging in ‘conservative backlash’ stimulated by ‘the silent revolution in cultural values’ (Norris and Inglehart Reference Norris and Inglehart2019, 14). This backlash is also implicated in the initial rise of sociocultural politics in the late 1970s and early 1980s (Bornschier Reference Bornschier2010; Bornschier Reference Bornschier and Rydgren2018; Inglehart Reference Inglehart1997; Kitschelt Reference Kitschelt1995). For Norris and Inglehart (Reference Norris and Inglehart2019), the resurgence in recent years is due to ‘medium-term economic conditions and rapid growth in social diversity’, which have accelerated material decline among those most susceptible to nationalist appeals – rural, older, less educated and poorer individuals. Although this group is shrinking, on the whole, Norris and Inglehart (Reference Norris and Inglehart2019) argue that it has outsized electoral influence because younger, more progressive individuals are least likely to vote.
Such an argument depends on a stable constellation of attitudes wherein sociocultural issues are bundled together in the same way as in the past. As they explain: ‘The authoritarian reflex is not confined solely to attitudes toward race, immigration, and ethnicity, but also to the rejection of the diverse lifestyles, political views, and morals of “out-groups” that are perceived as violating conventional norms and traditional customs’ (Norris and Inglehart Reference Norris and Inglehart2019, 18). Yet in light of a West European radical right that increasingly expresses support for women and the LGBTQ community (Akkerman Reference Akkerman2005; Akkerman Reference Akkerman2015; Campbell and Erzeel Reference Campbell and Erzeel2018; De Lange and Mügge Reference De Lange and Mügge2015; Meret and Siim Reference Meret and Siim2013; Mudde and Kaltwasser Reference Mudde and Kaltwasser2015), as well as recent discussion of a party system realignment around immigration, EU integration and other issues of national identity (De Wilde et al. Reference De Wilde2019; Hooghe and Marks Reference Hooghe and Marks2018), there is reason to doubt that the nationalist backlash is wholly conservative in nature (see Lancaster Reference Lancaster2019; Spierings, Lubbers and Zaslove Reference Spierings, Lubbers and Zaslove2017).
In a recent study of European mass publics from 1981–2016, Caughey, O'Grady and Warshaw (Reference Caughey, O'Grady and Warshaw2019) find that conservative attitudes on ‘social issues’ (for example, attitudes towards women, homosexuality, the environment, euthanasia, protest, etc.) have declined secularly across Western Europe, quite in line with the expectations of post-materialist theory. However, they also find that ‘immigration attitudes have not been found to share the social issues’ clear liberalizing trend overtime’ (p. 676), and in fact, that this liberalization ‘appears to have stalled’ (p. 682). Although younger individuals (16 to 34 years old) are, on average, less anti-immigrant than those aged 60 and older, the difference between young and old in this issue domain is about half the difference between these age groups' attitudes on social issues. Since Caughey, O'Grady and Warshaw (Reference Caughey, O'Grady and Warshaw2019) examine mass publics and not voters specifically, it appears that the electoral fortune of radical right parties is not necessarily due to disproportionately high turnout among nationalist ‘authoritarians’ (see Norris and Inglehart Reference Norris and Inglehart2019). Rather, I argue that the anti-immigrant voters of today are attitudinally different than in the past, in the sense that they oppose immigration but are not necessarily conservative. Instead of immigration being bundled with conservatism, younger voters, who came of age during and after the post-materialist era, increasingly combine anti-immigrant sentiment with moderate or even progressive sociocultural attitudes. While gender conservatism has declined across Europe, anti-immigrant sentiment has generally not, as the question of whether native and foreign cultures are compatible remains a widespread concern. In other words, sustained conflict around immigration throughout the 2000s and 2010s (Green-Pedersen and Otjes Reference Green-Pedersen and Otjes2019) precluded widespread acceptance of multiculturalism. This is in contrast to the issue of gender egalitarianism, which is largely no longer hotly contested in the political arena.
Political theorists envisaged the potential for value conflict between Europeans and conservative Muslim immigrants as early as the 1990s (see Barry Reference Barry2002; Kymlicka Reference Kymlicka1995; Parekh Reference Parekh1996). They argue that insofar as minority practices infringe on individual liberties, they must not be respected or tolerated by the state. To do so would mean privileging the rights of a group over that of the individual, contrary to the tenets of classical liberalism (Kymlicka Reference Kymlicka1995). Equating ‘liberalism’ with the ‘nation’ and ‘illiberalism’ with Islam creates a tension insofar as multiculturalism demands respect for diverse cultures (see Joppke Reference Joppke2014). Therefore, I refer to individuals who are opposed to immigration, yet also support gender equality, as ‘liberal nationalists’.
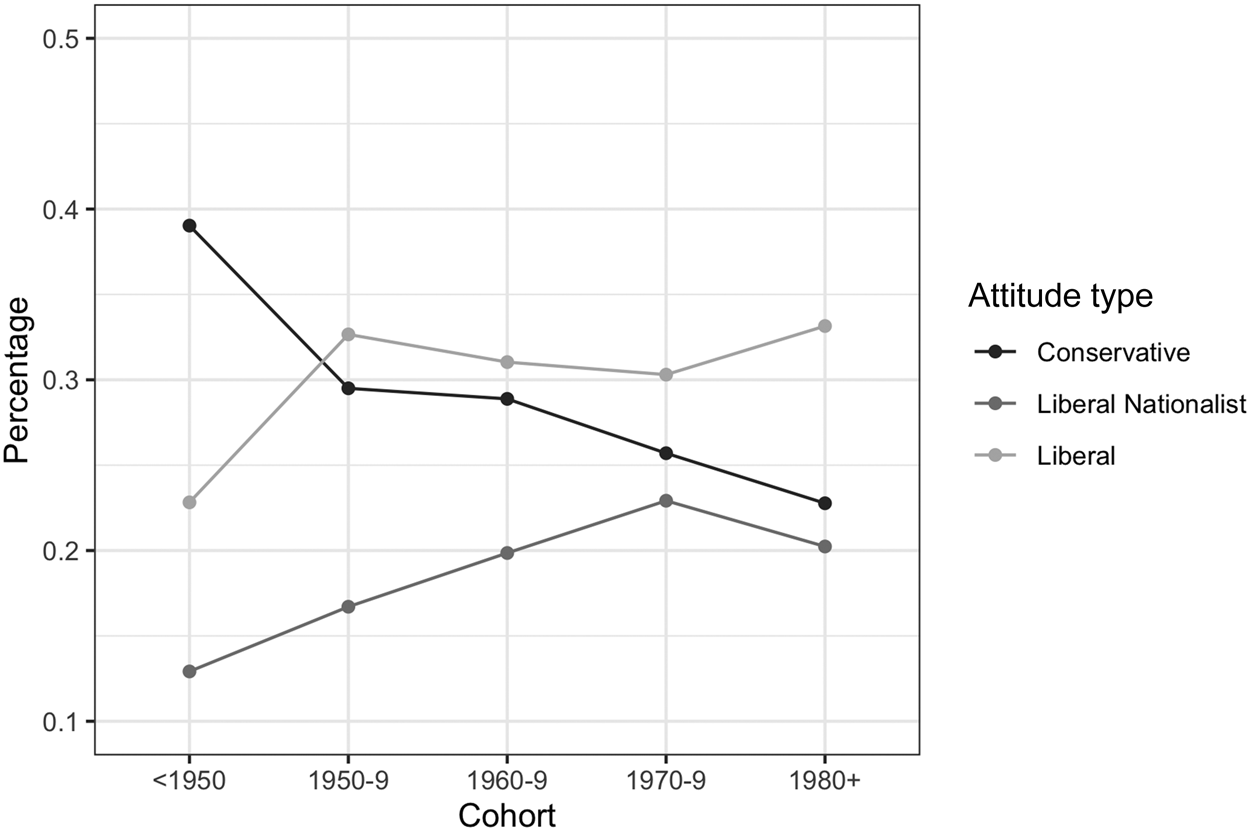
The question of whether a liberal state should condone illiberal minority practices is now debated outside of academic circles, after years of broad public consensus on multicultural policy. As Sniderman and Hagendoorn (Reference Sniderman and Hagendoorn2007) argue in their study of the Netherlands, multiculturalism remained uncontested in the mainstream right and left for many years because of norms of conformity. Those who consider conformity to be very important are also likely to oppose multiculturalism, due to an authoritarian bent. However, because they value conformity, these individuals are particularly ‘susceptible…to social pressure’ (p. 9) and ‘appeals to authority’ (p. 107). In other words, multicultural policy was uncontested, and there were no political outlets through which to voice opposition. Pim Fortuyn's short foray into Dutch politics in the early 2000s changed that. Fortuyn, an openly gay sociologist, began publicly criticizing Dutch multicultural policy for not only ‘legitimiz[ing] repressive practices of Islam’ but also for ‘propp[ing] them up financially’ (Sniderman and Hagendoorn Reference Sniderman and Hagendoorn2007, 19). Fortuyn was the first politician to voice ‘liberal’ opposition to immigration, rather than the economic and classically racist opposition of the past, weaponizing Dutch tolerance against Muslim immigrants' supposed intolerance (Sniderman and Hagendoorn Reference Sniderman and Hagendoorn2007). Now, Dutch anti-immigrant politicians discuss not traditional family values but rather the centrality of gender equality and gay rights to the Dutch nation, using liberal values as a way to establish boundaries between ‘us’ and ‘them’ (see Lægaard Reference Lægaard2007). As seen in Figure 1, the percentage of Dutch individuals with a ‘liberal nationalist’ attitude configuration has increased across cohorts, to the exclusion of those with purely conservative attitudes.
Frequency of Dutch attitude configurations by cohort
Note: the figure plots the percentage of individuals in each birth cohort with each type of attitude configuration. Data are from LISS, and the attitude measures are discussed in detail below. Conservatives have greater than average opposition to immigration and greater than average gender conservatism. Liberals have less than average opposition to immigration and less than average gender conservatism. Liberal nationalists have greater than average opposition to immigration and less than average gender conservatism.

Soon, such ‘Enlightenment’ rhetoric spread to other radical right parties across the continent (see Akkerman Reference Akkerman2015; Campbell and Erzeel Reference Campbell and Erzeel2018; Meret and Siim Reference Meret and Siim2013; Vossen Reference Vossen2011). The mainstream, particularly the center right, could no longer electorally afford to ignore the issue (Downes and Loveless Reference Downes and Loveless2018; Pardos-Prado Reference Pardos-Prado2015). Multicultural policy became fair game for leaders such as Cameron, Sarkozy and Merkel; the latter famously denounced multiculturalism as an ‘utter failure’ in 2010 (Joppke Reference Joppke2014, 288). Rather than Europeans becoming more multiculturalist, just as they became more accepting of other progressive sociocultural issues, these developments meant that immigration became a topic of broad public skepticism. Therefore, in many West European countries, being ‘nationalist’ means supporting and upholding the entrenched liberal values of one's nation. Nationalism has morphed into a form more compatible with ‘progressive’ cultures.
To summarize, I argued above that the immigration issue is becoming dealigned from other issues in the sociocultural dimension, particularly gender attitudes, due to widespread acceptance of the latter and continued conflict over the former. Hence, I expect that:
Hypothesis 1a: Gender attitudes become more progressive due to cohort replacement.
Hypothesis 1b: Immigration attitudes are not subject to cohort replacement.
An alternative explanation for why anti-immigrant sentiment appears to be increasingly associated with progressive gender attitudes may be period effects resulting from sharpened political conflict over immigration as a result of the Syrian refugee crisis. This would mean that everyone, including younger individuals with progressive gender attitudes and previously pro-immigration attitudes, may have shifted to a more skeptical viewpoint. Hence, the contending hypothesis is:
Hypothesis 2: Individuals become more opposed to immigration over the course of the panel.
These two hypotheses have contrasting implications for the relationship between gender and immigration attitudes. If divergent cohort trends are the key driver (Hypotheses 1a and 1b), then:
Hypothesis 3a: Gender attitudes are more weakly correlated with immigration attitudes in younger individuals than in older individuals.
However, period effects should increase opposition to immigration across all cohorts while leaving gender attitudes unaffected. This means that the slope of the line connecting gender and immigration attitudes should be similar for all cohorts, both before and after the crisis.
Hypothesis 3b: The relationship between gender and immigration attitudes does not differ across birth cohorts.
Data and Measures
My primary data source is the LISS panel. This panel, administered by CentERdata at Tilburg University in The Netherlands, is ‘a representative sample of Dutch individuals…based on a true probability sample of households drawn from the population register’ (Knoef and de Vos Reference Knoef and de Vos2009; Scherpenzeel and Das Reference Scherpenzeel, Das, Das, Ester and Kaczmirek2011). It is an exceptionally rich data source for the present inquiry because it tracks individuals over a 12-year period (2007–2019) and contains many relevant questions on gender attitudes and immigration. Further, panel data allows me to analyze if, and how, individuals' attitudes change over time. The panel has been refreshed four times (2009, 2011–2, 2013–4, and 2016–7), stratified on the basis of attrition rates, which are highest among households with members who are over 75, pensioners or immigrants (De Vos Reference De Vos2009).Footnote 3 As a secondary data source, and to explore the cross-national generalizability of the Dutch findings, I employ the 2017 wave of the EVS (GESIS Data Archive 2020) and include respondents from eleven West European countries.Footnote 4
I conceptualize my main variables of interest – Gender and Immigration Attitudes – as continuous latent traits. These latent traits are modeled through item response theory (IRT). IRT models, which originated in the education and psychology fields, use observed data, such as survey responses, test answers or roll-call records, to estimate an unobserved latent variable. As my data are categorical, I utilize a graded response model, which estimates a person-level ‘ability parameter’ and an item-level ‘discrimination parameter’. The ability parameter indicates each respondent's location on the latent trait – in other words, their attitude. The discrimination parameter is similar to a factor loading and measures how much information an item provides about the latent trait (Jackman Reference Jackman2009; Reckase Reference Reckase1997). A respondent's answers to highly discriminating questions, such as whether a woman's family suffers if she works outside the home (see Appendix E), tell the model more about her latent gender attitude than her answers to items with low discrimination parameters, such as whether married people are happier. As such, measuring respondents' attitudes though IRT modeling is preferable to other methods, such as creating an additive index or taking the average of the responses, because the model weights each question by its discrimination parameter, rather than weighting all questions equally. Further, the use of multiple questions to tap a single concept allows for more reliable inference about complex attitudes (Ansolabehere, Rodden and Snyder Reference Ansolabehere, Rodden and Snyder2008).
For the Dutch gender attitudes scale, I use twenty-two gender-related questions available in the LISS ‘Politics and Values’ panel and one on abortion attitudes from the ‘Religion and Ethnicity’ panel.Footnote 5 Cronbach's α for these twenty-three questions is 0.87, indicating a high degree of reliability. This score has a mean of 0, a standard deviation of 0.95, and ranges from −3.24 to 4.30; negative values indicate progressive attitudes, while positive values indicate conservative attitudes. The most discriminating items in the model pertain to traditional vs. modern gender roles, such as whether a woman should work if she has a toddler, whether a male breadwinner family is preferable, and whether a woman's family or children suffer if she works outside the home (see Appendix E).Footnote 6 The EVS gender attitudes score includes only twelve questions but appears to tap a similar construct – items pertaining to issues such as the male breadwinner in the family discriminate highly while those about divorce and abortion fall lower on the scale. Cronbach's α is 0.85, and this scale has a mean of 0, standard deviation of 0.94, and ranges from −1.97 to 3.46.
The Dutch immigration attitudes score is created from the nine immigration questions in the panel, and has an estimated reliability of 0.77. The resulting latent trait appears to relate to cultural concerns about immigration (see Appendix E). The EVS scale, however – created from six questions (Cronbach's α = 0.8) – concerns issues such as crime and welfare, and the one culture-related question, on assimilation, is the least discriminating. As such, the immigration attitudes measured by LISS and EVS are not exactly comparable. However, if the findings are similar across data sets despite these differences, this should provide further support for my argument.
The main independent variable of interest is Birth Cohort. In initial analyses, Cohort is a five-level factor variable that takes a value of 1 for individuals born prior to 1950 and 5 for those born after 1980, incrementing by 10 in between. In the regression models, I dichotomize this variable, as explained further below. In order to isolate the effect of birth cohort as much as possible, it is important to control for characteristics that vary in prevalence across generations (for example, religiosity) and also affect individuals' attitudes. Therefore, I control for gender, marital status, whether one resides in an urban, suburban or rural area (LISS only), employment status, gross individual income, education level (from no high school diploma to bachelor's degree or higher), frequency of religious attendance (1–7, where 1 is ‘never’) and left–right self-placement (where 0 is extreme left and 10 extreme right). The LISS data is comprised of an unbalanced eleven-wave panel with 13,140 individuals and 62,530 observations, while the EVS data include 26,112 individuals from eleven countries at a single time point (2017).Footnote 7 A Wald test of the LISS data indicated panel wave heteroskedasticity, making it advisable to control for time. I do so by means of a ‘cubic polynomial approximation’ (t,t 2 and t 3), which Carter and Signorino (Reference Carter and Signorino2010) find to be a more efficient and accurate method of modeling temporal dependence than including time dummies.
Results
I begin the analysis with an overview of gender and immigration attitudes by birth cohort both in the Dutch context and cross-nationally. I expect that younger cohorts have more progressive gender attitudes, on average, than older cohorts (Hypothesis 1a), and I do not expect to see intergenerational differences in immigration attitudes (Hypothesis 1b). To test this expectation, I regress birth cohort onto each attitude measure, controlling for demographic characteristics. In the panel model, I also control for time and include a random effect for individuals, since birth cohort is time invariant, making fixed effects inappropriate.Footnote 8 Standard errors are bootstrapped and clustered by individual. In the EVS model, I include population weights and country fixed effects, with standard errors clustered by country.
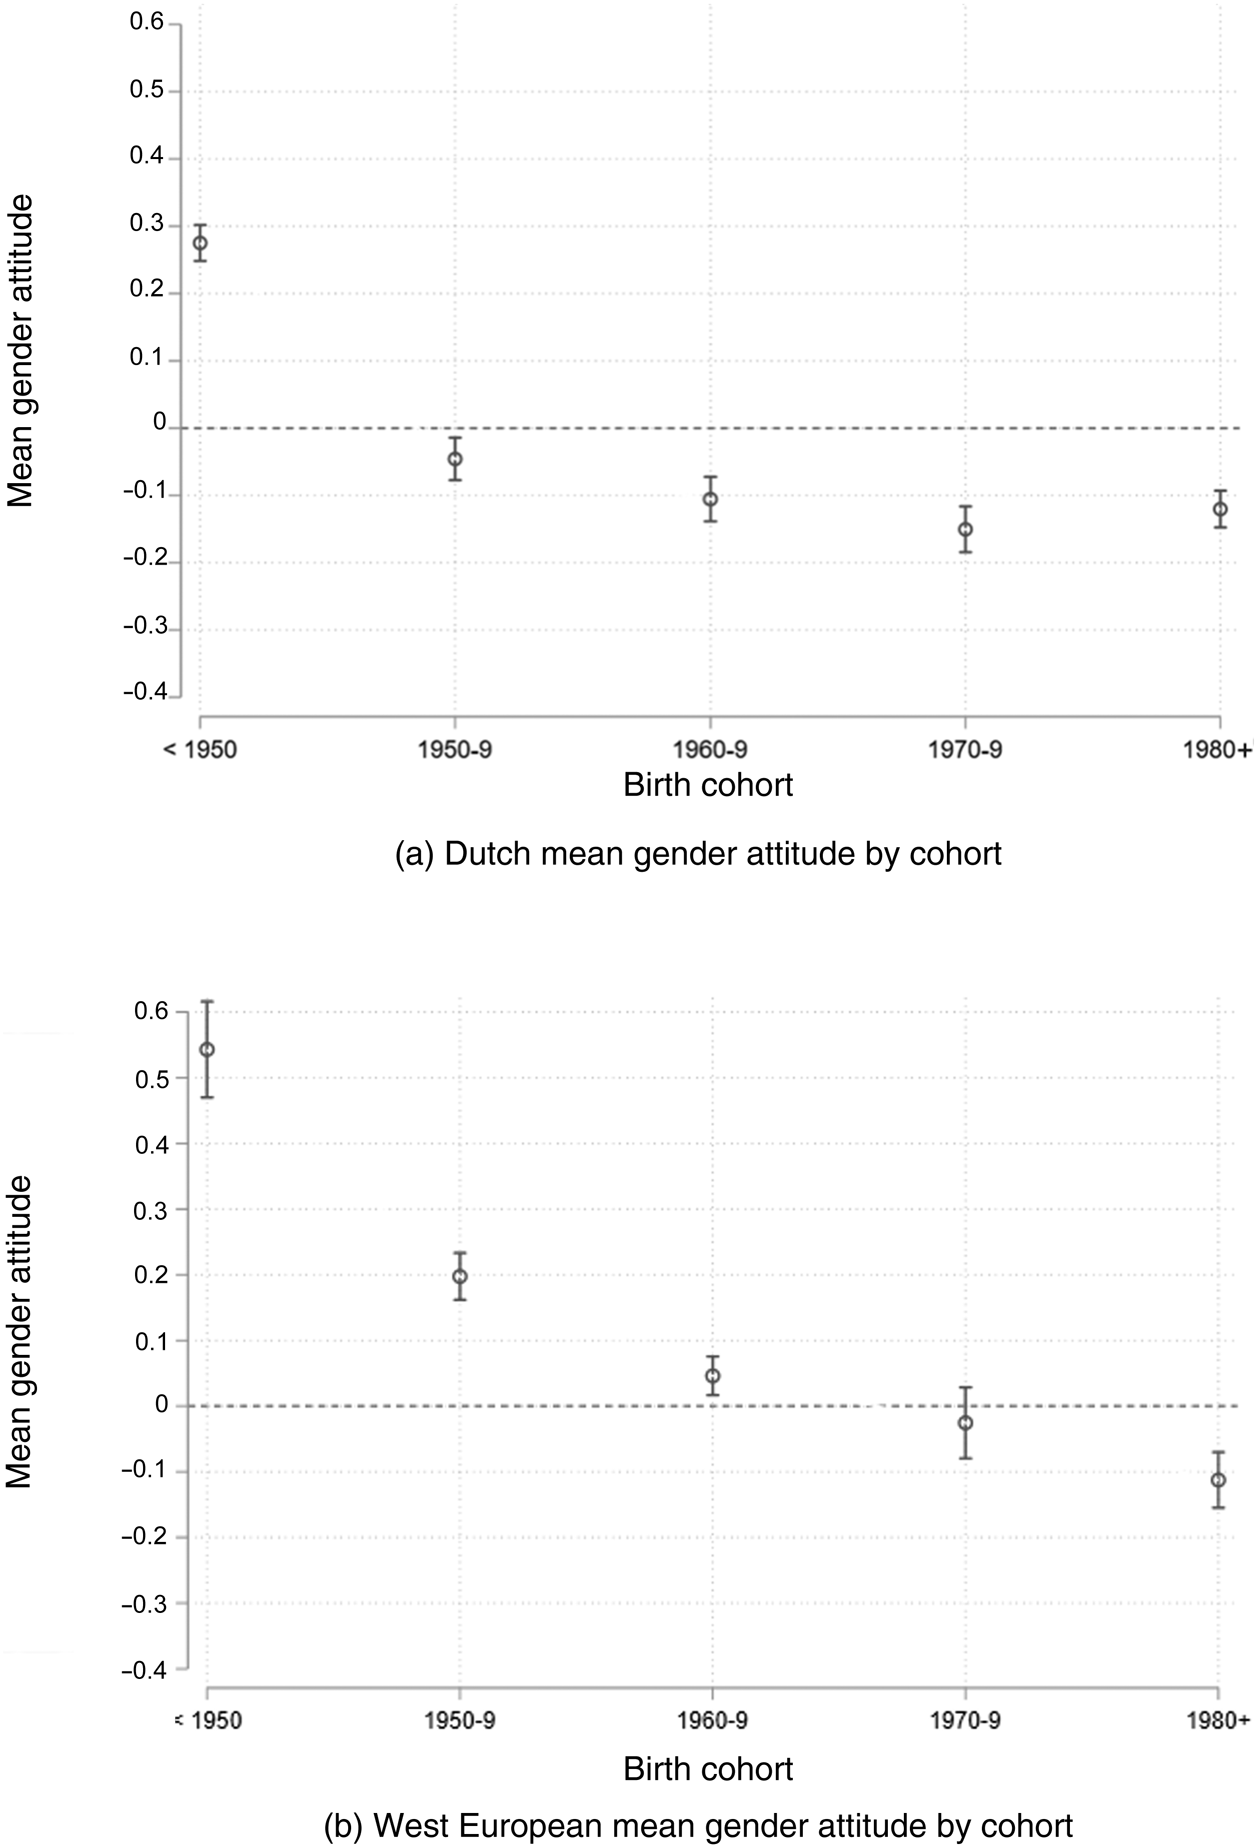
Figure 2a plots the mean attitudes towards gender issues in the Netherlands by birth cohort. As shown, the most progressive cohort is comprised of those born between 1970 and 1979, while those born prior to 1950 are clearly the most conservative. The difference between these two cohorts is almost half of a standard deviation. The trend appears somewhat curvilinear, with the youngest cohort, born in or after 1980, showing a slight uptick in conservative attitudes, but they are still significantly less conservative than the oldest cohort. The cross-national findings similarly indicate substantial generational differences (Figure 2b).
Mean gender attitudes by cohort – LISS and EVS
Note: attitudes are centered at 0, where positive values indicate that the cohort holds, on average, more conservative attitudes.

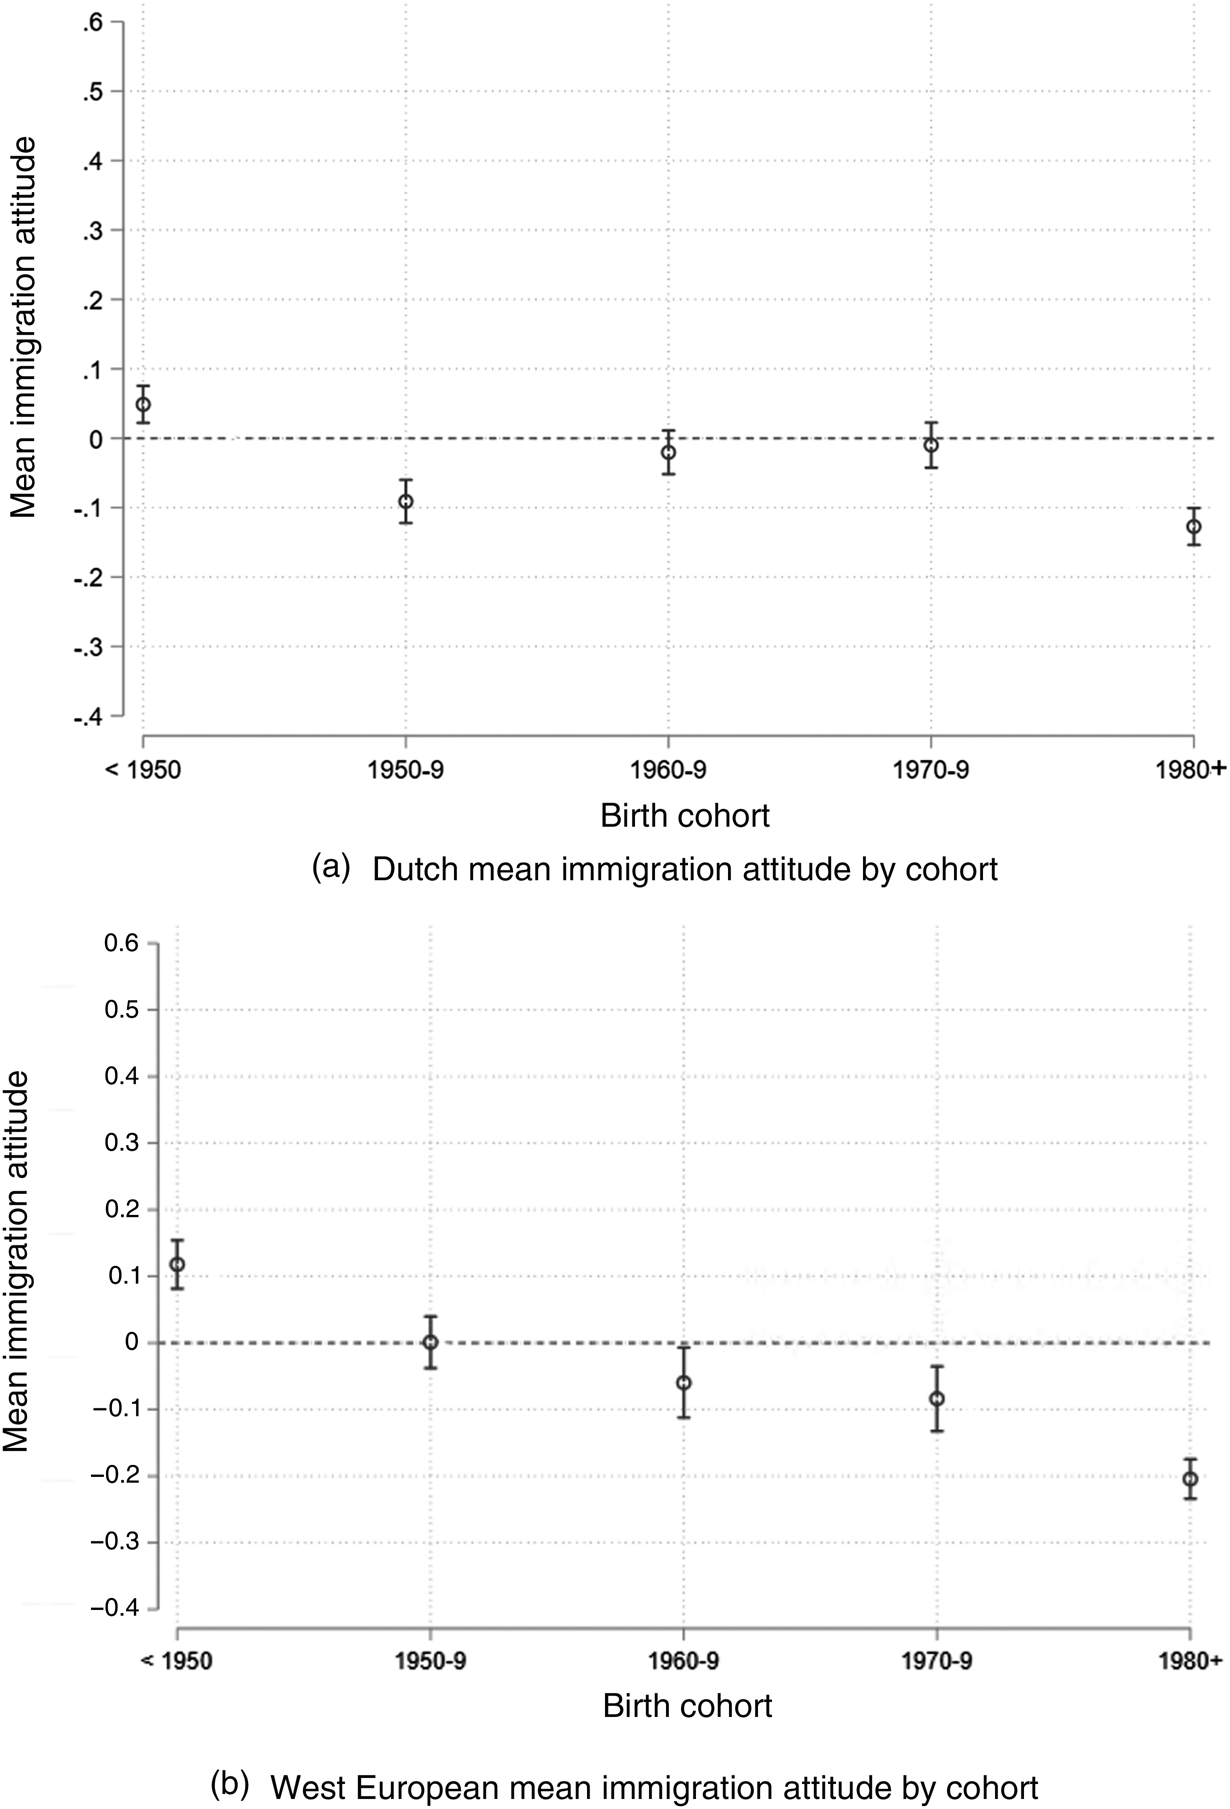
Figures 3a and 3b present the results for immigration attitudes by cohort. Across both data sources, the oldest cohort is the most opposed to immigration. However, in the Dutch sample, the cohorts with the most progressive gender attitudes – those born between 1960 and 1979 – hold mean immigration attitudes that are, on average, almost indistinguishable from those born prior to 1950. The EVS paints a similar picture, despite measuring somewhat different concerns. While the difference between the oldest and youngest EVS cohorts' gender attitudes is about 0.66 – around two-thirds of a standard deviation – the difference in immigration attitudes is half that.Footnote 9 Taken together, these findings echo those of Caughey, O'Grady and Warshaw (Reference Caughey, O'Grady and Warshaw2019) and suggest that indeed, immigration attitudes are not liberalizing via cohort replacement alongside other sociocultural attitudes. Indeed, the immigration trend is more linear in the EVS than in the LISS, yet an examination of cohort trends by country (Appendix E) indicates that some countries, such as Denmark and Finland, exhibit trends similar to those seen in the Dutch data. Further, differences across cohorts are generally smaller in magnitude compared to gender attitudes, suggesting that even in cases of linear decreases in opposition, the declines are occurring more slowly. I return to the issue of cross-national generalizability in the conclusion.
Mean immigration attitudes by cohort – LISS and EVS
Note: attitudes are centered at 0, where positive values indicate that the cohort holds, on average, more conservative attitudes.

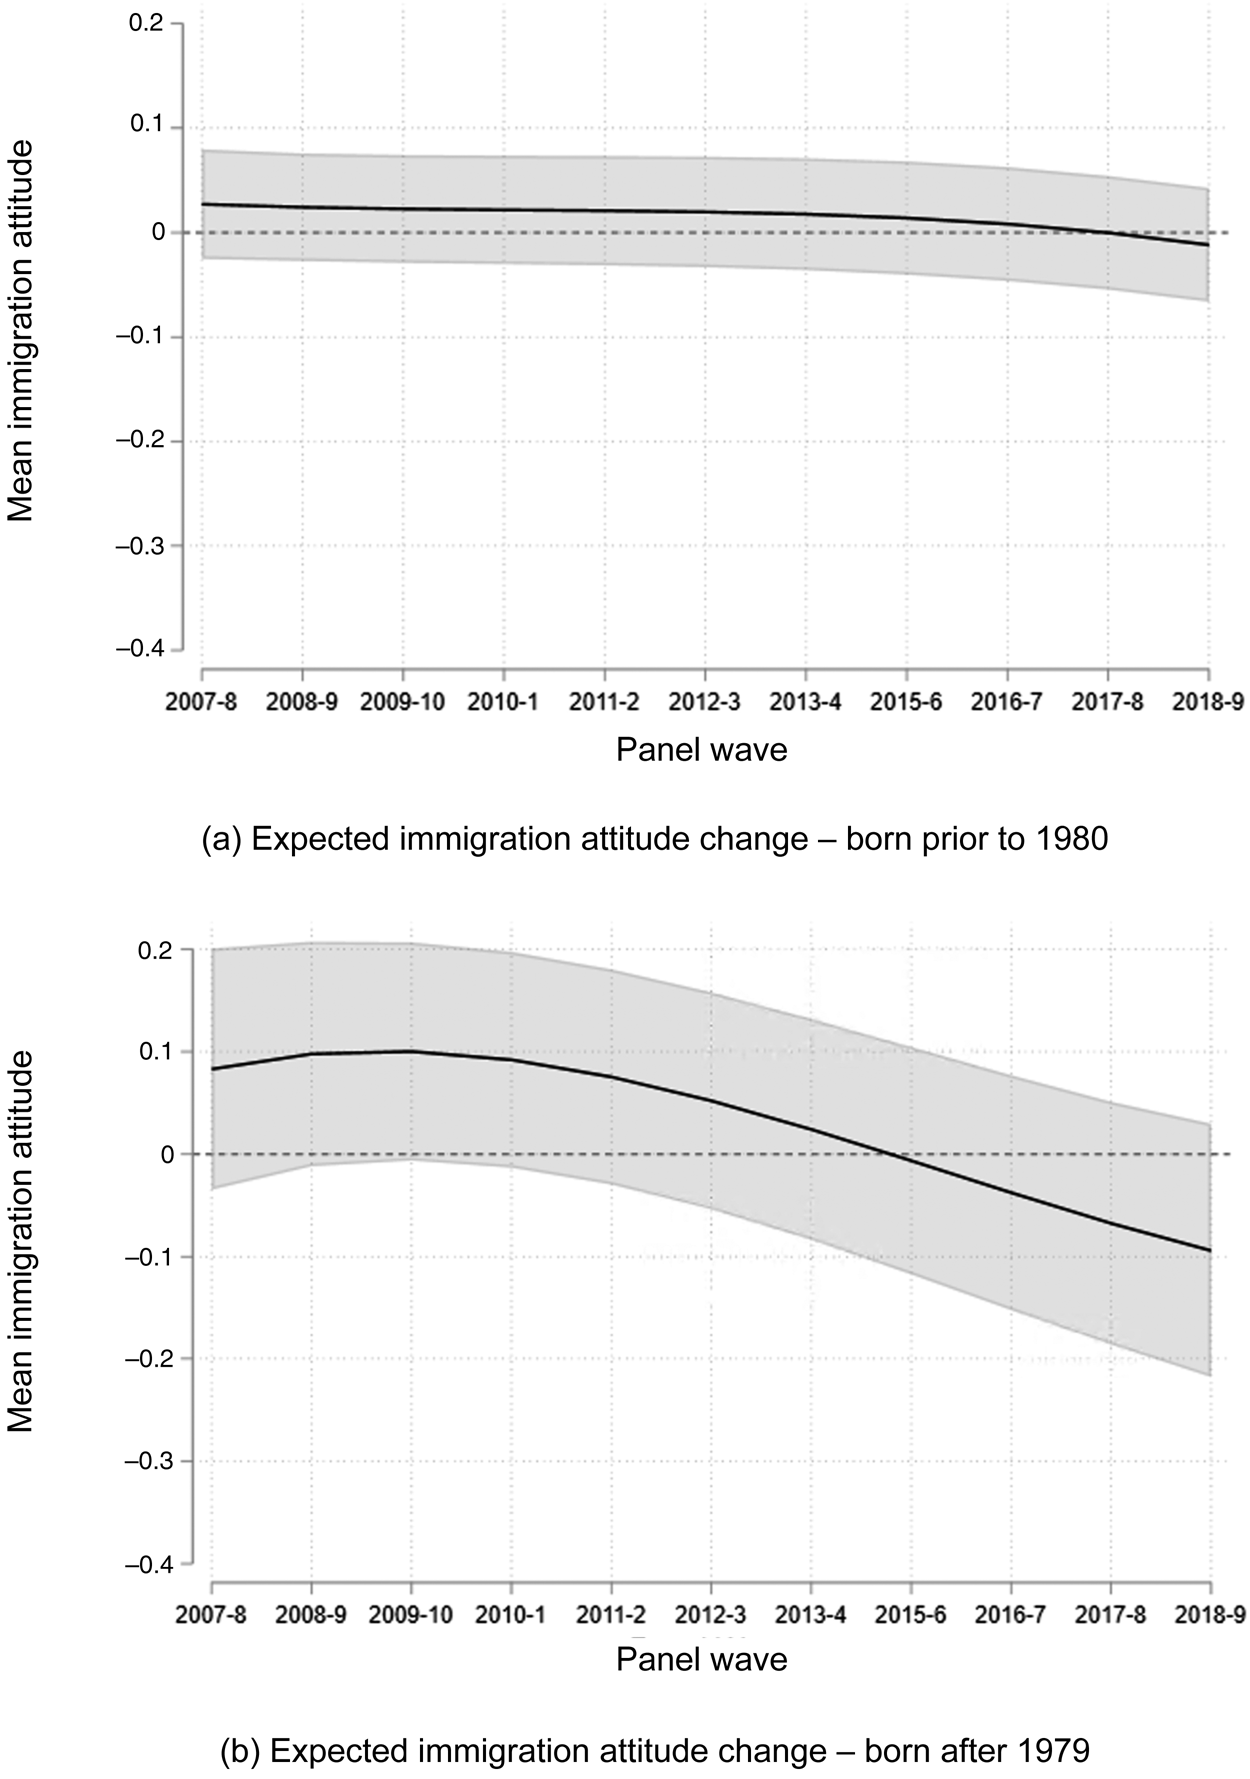
To test for period effects on immigration attitudes (Hypothesis 2), I now examine longitudinal, within-individual change via growth curve analysis (GCA). GCA is a method common in the biological and behavioral sciences for analyzing time trends in panel data (Mirman Reference Mirman2017). Above, a cubic polynomial controlled for temporal dependency in the data. However, I am now interested in inference about the polynomial term, which I use to model the average attitudinal trajectory of an individual over the eleven-wave (12-year) course of the panel. To isolate the ‘within’ effect, I employ individual-level fixed effects. Because younger individuals may be more susceptible to shocks, such as the refugee crisis (see Goldman and Hopkins Reference Goldman and Hopkins2020; Kustov, Laaker and Reller Reference Kustov, Laaker and Reller2019), I estimate models on two subsets of the data – those born after 1979 (the youngest cohort) and those born prior to 1980 (all other cohorts).Footnote 10
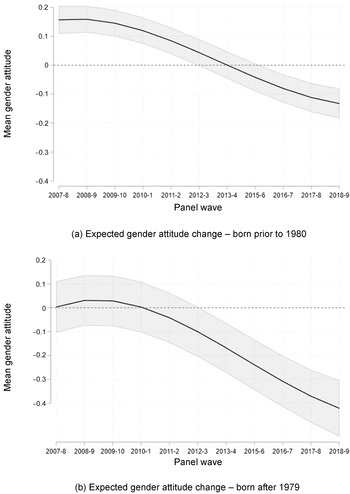
Although Hypothesis 2 pertains only to immigration attitudes, I first check the stability of gender attitudes. Figures 4a and 4b plot individuals' expected gender attitudes during each panel wave. Whether I consider older (Figure 4a) or younger individuals (Figure 4b), it is clear that gender attitudes change over the course of the eleven-wave panel. From 2007–2019, the gender attitudes of older individuals became about a third of a standard deviation more progressive, while younger individuals' attitudes became almost half a standard deviation more progressive. Substantively, this entails choosing a more progressive Likert scale option on one or two weighty questions or a few less important questions. However, considering that this prediction is based on pooled data from over 13,000 individuals across a wide swath of society, it is a meaningful shift.
Within-individual gender attitude trajectory by birth cohort
Note: attitudes are centered at 0, with s.d. = 1, where positive values indicate that the individual holds a conservative attitude. The figures plot an individual's predicted gender attitude in each panel wave. Models were estimated on two subsets – individuals born prior to 1980 and those born after 1979.

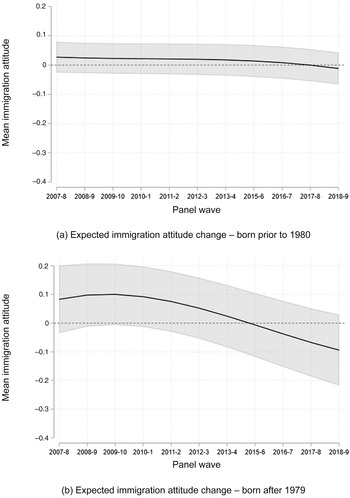
The results above are particularly striking in light of Figures 5a and 5b, which plot the attitudinal trajectory of immigration attitudes within the same individuals and across the same time period. A couple of findings should be noted. First, in contrast to above, where the younger cohort had significantly more progressive gender attitudes at baseline, the intercepts on immigration attitudes do not significantly differ. Secondly – and again, in contrast to above – immigration attitudes do not change significantly over the course of the panel. Indeed, the trajectory of the youngest cohort declines slightly, while that of older cohorts is almost completely static. Yet in both figures, the confidence intervals always include zero. Further, the trend for the youngest cohort is in the opposite of the hypothesized direction. Some younger individuals may have become more accepting of immigration, not more opposed. Therefore, Hypothesis 2 finds no support.
Within-individual immigration attitude trajectory by birth cohort
Note: attitudes are centered at 0, with s.d. = 1, where positive values indicate that the individual holds a conservative attitude. The figures plot an individual's predicted immigration attitude in each panel wave. Models were estimated on two subsets – individuals born prior to 1980 and those born after 1979.
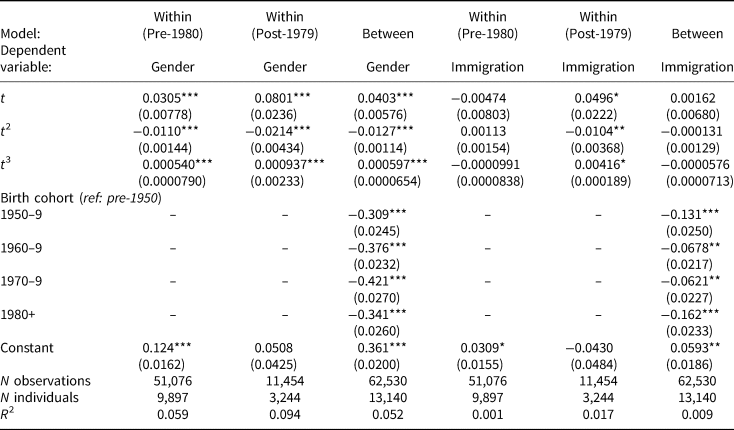
This evidence is further corroborated by Table 1. Models 1, 2, 4 and 5 are the growth curve models for gender and immigration attitudes, and Models 3 and 6 are random effects linear regressions measuring between-cohort attitude differences. As discussed above, the within models are estimated on cohort-based subsets. To best compare the explained variance of these models, I do not include controls. It is clear in the gender models that both time (life cycle) and cohort reach statistical significance. Further, the explanatory power of the within and between effects is comparable. In contrast, the variance in immigration attitudes is not explained by either the time or cohort variables; across all three models, the R 2 is negligible, between 0.001 and 0.017 depending on the model. Additionally, the cohort coefficients, though significant, are substantially smaller than those in Model 2. These results indicate that tolerance of immigration and multiculturalism does not vary substantially between age cohorts, nor does it change substantially over the life cycle. Gender egalitarianism, however, appears to be more acceptable to Dutch individuals over time as well as across generations. The immigration divide is thus more intractable: it exists not primarily between young and old but rather across geographic, educational and other boundaries (see Maxwell Reference Maxwell2019).
Comparing within-individual and between-cohort attitude change

Note: cluster robust standard errors in parentheses. * p < 0.05, ** p < 0.01, ***p < 0.001
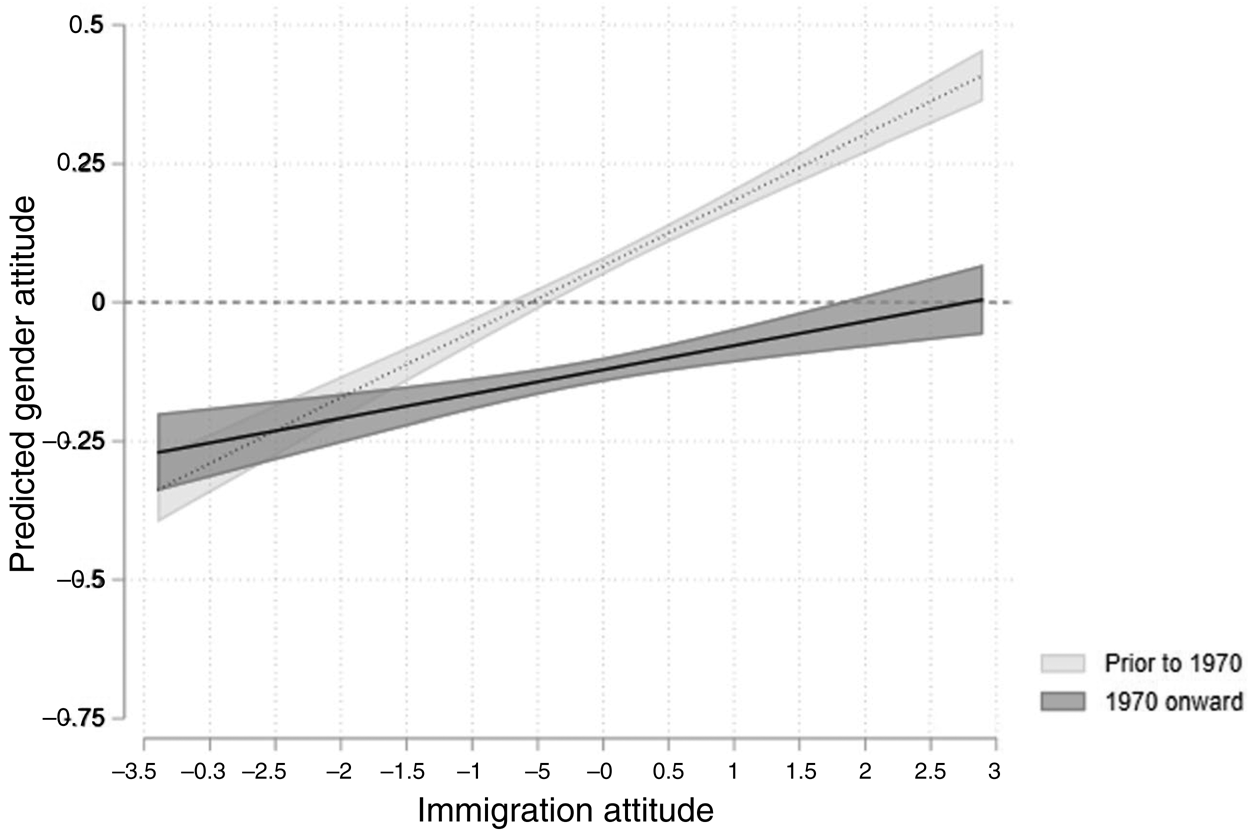
I now test the second part of my argument, which pertains to the association between immigration and other sociocultural attitudes. I hypothesized in Hypothesis 3a that due to the divergent trends in gender and immigration attitudes established above, a strong positive correlation between these two attitudes only exists among older cohorts. In support of this hypothesis, I present linear random effects models on the Dutch data, where immigration attitude predicts gender attitude, with demographic and temporal controls, and cluster-robust bootstrapped standard errors. To test whether the relationship varies by cohort, I interact immigration attitude with a dummy variable that takes a value of 1 for individuals born after 1969.Footnote 11 Figure 6 presents the results. As expected, the association between immigration attitudes and gender attitudes is strongly positive for those born prior to 1970: immigration opponents – those on the positive side of the immigration scale – are clearly on the conservative side of the gender attitudes scale, and vice versa. In contrast, the line flattens substantially for younger cohorts. Knowing that someone born after 1969 is strongly opposed to immigration does not indicate much about their gender attitude. In fact, a younger individual with a maximum level of opposition to immigration (2.91) is expected to have a gender attitude of 0 – neither conservative nor progressive, but exactly average. Therefore, Hypothesis 3a is supported, and by implication, Hypothesis 3b is unsubstantiated.
Immigration predicting gender attitudes
Note: attitudes are centered at 0, where positive values indicate that the individual holds a conservative attitude. The figure plots predicted gender attitude by immigration attitude and birth cohort.

To test whether these results are affected by recent political crises, I model a three-way interaction between immigration, cohort and time (Appendix C). In line with expectations, the relationship between the two attitudes is similar at the beginning and end of the panel. The main difference is that the baseline predicted gender attitude is more progressive in 2019 than in 2007. This finding comports with the results from the fixed-effects models above, which showed that individuals have become more accepting of gender egalitarianism over the course of the panel, but that their immigration attitudes remain remarkably stable. Hence, it does not appear that attitudes as such have been affected by the refugee crisis. Rather, any political effects resulting from the refugee crisis, such as increased support for radical right parties, are likely due to changes in the salience of the immigration issue (Dennison Reference Dennison2019), as well as rhetorical frames that are more broadly appealing and take advantage of the generational attitudinal trends discussed herein.
The findings presented thus give credence to the view that broad socialization processes have induced ‘liberal nationalist’ attitude configurations. However, it could be that older individuals have more structured attitudes because they have more political experience – that is, they are more knowledgeable about which issues ‘go together’ because they have been more exposed to political messaging that helps them connect these issues. The decoupling would then be a byproduct of youth or inexperience. To tackle this question, I subset the panel to include only those individuals present in all eleven waves. I then further subset to examine respondents born in three five-year periods – 1950–1955, 1970–1975 and 1980–1985 (605 individuals in total).Footnote 12 This allows me to track respondents as they age from their 50s to 60s; 30s to 40s; and 20s to 30s. This is arguably a hard test, as stable panel members may be more likely to exhibit higher levels of political knowledge and engagement.
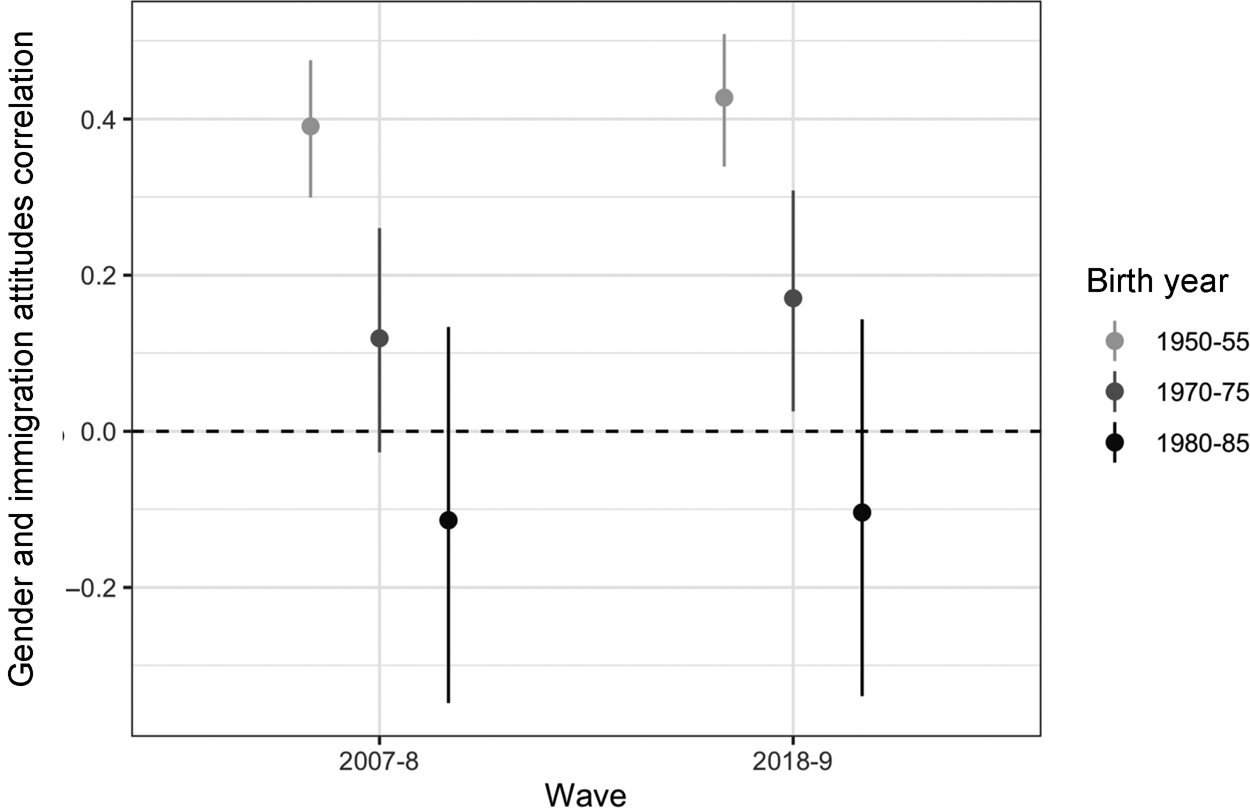
Figure 7 presents the Pearson's r correlations (with 95 per cent confidence intervals) between gender and immigration attitudes for these birth cohorts in 2007–8 (first wave) and 2018–9 (last wave). The results provide no indication that individuals' attitudes become more aligned as they age. The correlations for all three cohorts remain remarkably stable. Moreover, the correlations for the youngest two cohorts are significantly lower than those for the oldest cohort. These findings provide further support for my argument that, in younger cohorts, immigration attitudes are becoming decoupled from other sociocultural attitudes. As I argued, I suspect this is because immigration continues to be contested while gender egalitarianism has gained widespread support among younger individuals.
Attitude correlation by birth year – beginning and end of panel
Note: the figure plots the Pearson correlation coefficient for the same individuals at the beginning and end of the panel. Individuals are grouped by birth year.

Discussion and Conclusion
This article has examined change in, and the relationship between, attitudes towards gender and immigration. The results suggest that gender attitudes become more progressive over time due to both strong cohort replacement effects and within-individual change. Immigration attitudes, however, exhibit little divergence across cohorts; nor do they change over time. The remarkable stability of immigration attitudes, even among younger individuals, provides evidence against period effects resulting from the sharp increase in the salience of immigration in recent years. I further show that younger cohorts have weak associations between gender and immigration attitudes because they tend to hold entrenched progressive gender attitudes but remain skeptical of immigration and multicultural policy. The persistence of the immigration issue against a backdrop of tolerance and progressivism suggests that the former is decoupling from other issues in the sociocultural dimension.
Despite these findings, many questions remain. First, how generalizable are these findings to other West European countries? As the EVS data show, the overall cross-national trend in immigration attitudes across cohorts is similar to, yet more linear than, that seen in the Dutch data. In other words, on the whole, younger West Europeans are slightly less opposed to immigration than their older counterparts, whereas this is not true of the Netherlands, where differences between cohorts are minimal. However, this does not imply Dutch exceptionalism. As shown in Figure 8, Appendix E, several countries, including Denmark, Finland, Italy, Norway and France, exhibit relatively limited differences across cohorts in immigration attitudes. Further, the Dutch pattern of weaker attitude correlations in younger cohorts also exists in countries such as France, Norway and Sweden (Figure 9, Appendix E). These countries are among the most progressive in Western Europe, and yet remain skeptical of immigration. The variation in gender attitudes and immigration salience across Western Europe therefore serves as a partial explanation for why the Dutch pattern is not universal.
Yet, another piece arguably relates to the extent to which each country's nationalism is based on liberal values. Liberal nationalism is not likely to exist in a more conservative, Catholic country such as Austria or Italy. And even in more progressive contexts, if opposition to immigration is not made more socially acceptable via rhetoric that legitimates this opposition by way of liberal values – as occurred in the Netherlands in the early 2000s – then the pattern may not emerge. Or, to the extent that this rhetoric has emerged in certain countries in recent years (see Akkerman Reference Akkerman2005; Akkerman Reference Akkerman2015; Campbell and Erzeel Reference Campbell and Erzeel2018; De Lange and Mügge Reference De Lange and Mügge2015; Meret and Siim Reference Meret and Siim2013), it may be too soon to notice any effects. After all, I argue that these trends came about due to long-term socialization processes. Nonetheless, the use of this rhetoric among the radical right in progressive countries may be a new ‘winning formula’ (see Kitschelt Reference Kitschelt1995). Instead of the typical radical right constituencies ‘coming out of the woodwork’ during a time of high immigration salience (see Norris and Inglehart Reference Norris and Inglehart2019), perhaps the radical right is broadening its base in some countries by drawing on new constituencies with more progressive leanings (Lancaster Reference Lancaster2019).
Another question concerns my use of birth cohort as a primary explanatory variable. This variable can only approximate the socialization processes I posit to be responsible for the results herein. Therefore, future work could analyze historical survey data, tracing cohorts' nationalist attitudes over time as each cohort ages. Of particular interest is whether – and if so, how – these attitudes may have shifted once immigration came onto the political agenda in Western Europe in the latter part of the twentieth century.
Further, this article does not consider whether certain aspects of the multidimensional concept of ‘immigration attitudes’ may be behind these results. I briefly noted above that the LISS panel includes more questions on the cultural implications of immigration than the EVS, which emphasizes economic and social implications (for example, employment, crime, welfare). These data differences may also mean that the prevalence of the Dutch pattern across Western Europe is underestimated, as I suspect that cultural concerns are more relevant to my theory. The current debates surrounding multiculturalism and Muslim immigration revolve around whether or not Muslims' culture, beliefs and way of life are compatible with those of Western Europe. While economic concerns may have played a greater role in the past, driving working-class men to the radical right (Bornschier Reference Bornschier2010; Reference Bornschier and Rydgren2018), the justifications given for restricting immigration have shifted across much of Western Europe. Future work could break these attitudes down even further to get a more granular view of the specific concerns driving the recent resurgence of the immigration issue in West European politics, as this article does not explore why immigration has remained divisive, in contrast to gender issues.
Additionally, these results have implications for the psychological bases of political attitudes. While it was previously assumed that both economic and social conservatism shared a common psychological basis (see Duckitt and Sibley Reference Duckitt and Sibley2009; Malka, Lelkes and Soto Reference Malka, Lelkes and Soto2019 for overviews of this literature), ideology research now suggests that social dominance orientation underlies economic conservatism, while social conservatism stems from right-wing authoritarianism (Duckitt and Sibley Reference Duckitt and Sibley2009). The degree of correlation between these two measures is highly context dependent (Malka, Lelkes and Soto Reference Malka, Lelkes and Soto2019; Weeden and Kurzban Reference Weeden and Kurzban2016). In Western Europe, a weak correlation between the economic and social dimensions of ideology manifests through ‘welfare chauvinism’, which has become prevalent among both the mainstream and radical right in recent years (Harteveld Reference Harteveld2016; Malka, Lelkes and Soto Reference Malka, Lelkes and Soto2019; Marx and Naumann Reference Marx and Naumann2018). Welfare chauvinism – the desire to only allow natives to benefit from the welfare state – partly results from the entrenchment, and broad acceptance, of redistributive economic policy, coupled with growing immigration. This is not dissimilar to the phenomenon explored in this article: liberal values are now entrenched, just like the welfare state, and so right-wing politics, dominated by immigration, has sought to accommodate that. While right-wing authoritarianism is argued to relate to socially conservative attributes such as respect for tradition, hierarchy and order, and skepticism of out-groups (Duckitt and Sibley Reference Duckitt and Sibley2009), these attitude clusters may be more contextually variable than is commonly assumed (Weeden and Kurzban Reference Weeden and Kurzban2016).
A final question pertains to the causal mechanisms underlying party appeals on new transnationalist issues. For example, what types of frames are most effective in drawing voters to anti-immigrant radical right parties? Because many with anti-immigrant sentiments appear to be not conservative, are gender-related immigration frames indeed more appealing to potential voters than other frames, such as those concerning unemployment or criminality? And at the other pole, how might pro-immigration and pro-EU parties make the case for accepting refugees, remaining in the EU, and more generally, stemming the tide of nationalism? Future research should explore these dynamics.
Supplementary material
Data replication sets are available in Havard Dataverse at: https://doi.org/10.7910/DVN/HZLAF0 and online appendices at https://doi.org/10.1017/S0007123420000526.
Acknowledgements
I would like to thank Liesbet Hooghe, Gary Marks, Rahsaan Maxwell, Marc Hetherington, Milada Vachudova, Austin Bussing, Kaitlin Alper and the Comparative Working Group at the University of North Carolina at Chapel Hill for their helpful comments, suggestions, and support. The author also thanks René Lindstädt and three anonymous reviewers for their insightful input during the review process.
Financial support
This article is based on work supported by the National Science Foundation Graduate Research Fellowship (NSF-GRFP) under Grant No. DGE-1650116. Any opinions, findings and conclusions or recommendations expressed herein are those of the author and do not necessarily represent the views of the National Science Foundation.