Introduction
The functional integrity of the intestinal tract mucosa is related to the interaction between enterocytes, goblet cells, Paneth cells, and the intestinal microbiota. Reference Mello, Silva and Fonte1-Reference Lee, Lee and Kim4 Changes in these components can cause losses in the absorption of nutrients and an increase in intestinal permeability, thus predisposing the appearance of diseases. Reference Bischoff, Buurman and Ockhuizen2,Reference Caruso and Demonte5-Reference Umekawa, Sugiyama and Du7
Inadequate food consumption, especially excess saturated fat intake, can promote important changes in the intestine, including changes in the composition of the microbiota and damage to intestinal histomorphology, Reference Lee, Lee and Kim4,Reference Natali, Neto and Orsie8,Reference Hermes, Azevedo, Araújo and Sant’Ana9 which in turn affect the intestine functionality. Reference Navarrete, Vásquez and Sol6,Reference Bruce-Keller, Fernandez-Kim and Townsend10 Early exposure to the consumption of saturated fat in critical periods of development, such as during pregnancy and lactation, can predispose to important intestinal changes in the offspring Reference Bruce-Keller, Fernandez-Kim and Townsend10,Reference Ma, Prince and Bader11 and in the development of the enteric nervous system (ENS) that communicates bidirectionally with the central nervous system (CNS) forming the gut-brain axis. Reference Carabotti, Scirocco and Maselli12,Reference Srugo, Bloise, Nguyen and Connor13,Reference Ye and Srinivasan14
Recent evidence suggests that the high-fat diet (HFD) during the perinatal period causes ganglionic remodeling, Reference Stenkamp-Strahm, Nyavor, Kappmeyer, Horton, Gericke and Balemba15 loss of nitrergic myenteric neurons and changes the chemical code of the remnants. Reference McMenamin, Clyburn and Browning16 Although the striking morphological alterations in the ENS are the most evident, subtle changes in the neurophysiology of enteric microcircuits, termed enteric neuroplasticity, can cause intestinal dysfunction. Reference Giaroni, De Ponti, Cosentino, Lecchini and Frigo17,Reference Lomax, Fernández and Sharkey18 The imbalance in the expression of neurotransmitters in myenteric neurons is associated with dysfunction of the intestinal epithelial barrier. Reference Mawe, Strong and Sharkey19-Reference Cameron and Perdue21
Studies have shown that adult C57BL/6 mice, exposed to a HFD showed impairment of the intestinal barrier due to dysbiosis and expansion of pathobionts caused by dysfunction of Paneth cells and a reduction in antimicrobial peptides (AMPs). Reference Lee, Lee and Kim4,Reference Guo, Li and Tang22 Histopathological findings observed in experimental models exposed to an HFD, including reductions in goblet cells Reference Hamilton, Boudry, Lemay and Raybould3 and Paneth cells, Reference Guo, Li and Tang22 and colitis, are predisposing factors for the development of inflammatory bowel disease. Reference Lee, Lee and Kim4 In addition, it was shown that the offspring of rats fed an HFD during pregnancy showed changes in the intestinal microbiota, Reference Ma, Prince and Bader11 degeneration in enteric neurons and gliosis, Reference Ye and Srinivasan14 and increased intestinal permeability, which in turn increased the susceptibility to inflammatory processes. Reference Umekawa, Sugiyama and Du7
Faced with a worldwide scenario based on the consumption of nutritionally unbalanced diets, both quantitatively and qualitatively and due mainly to the high content of saturated fat Reference Popkin, Adair and Ng23,Reference Popkin24 reflecting modern eating habits, there are still only a few studies that evaluated the consequences of eating this type of diet in the critical period of development to adulthood more specifically with respect to changes related to intestinal histomorphometry. Therefore, this study hypothesizes that maternal exposure to a HFD alters parameters in histomorphometry, histopathology and neuroplasticity in the ileum of rats. Thus, the present study aimed to evaluate the chronic effects of an HFD, from the perinatal (pregnancy and lactation) and post-weaning periods to adulthood, on histomorphometry, neuroplasticity and histopathology in the ileum of rats.
Materials and methods
Animals
A total of 38 male descending Wistar rats (8 weeks old) were used in this study. The experiments carried out in this study followed the recommendations of the Brazilian Society of Science in Laboratory Animals (SBCAL) and guidelines of ARRIVE (Animal Research: Reporting of in Vivo Experiments). Reference Percie du Sert, Hurst and Ahluwalia25 The study was approved by the Ethics Committee on Animal Experimentation, Faculty of Veterinary Medicine and Animal Science, Federal University of Bahia, according to protocol n°. 59/2017. The animals were kept at the Experimental Nutrition laboratory of the UFBA nutrition school under the same temperature conditions (23 ± 2 °C) and a 12-h light/dark cycle.
Experimental groups
The primiparous rats Wistar (90 to 100 d of life weighing between 220 and 280 g) were mated with non-consanguineous males (2:1 ratio) and allocated to two experimental groups according to the diet to be administered during the period of pregnancy and lactation: control group (C, n = 5), fed a standard commercial diet for rats; and an HFD group (H, n = 5), fed a HFD. The pregnancy was confirmed by means of a vaginal smear, and the presence of sperm in the vaginal secretion was considered indicative of the onset of pregnancy. After weaning the males offspring were divided randomly into subgroups according to the diet consumed up to 60 d of life, allocated individually in polypropylene cages, as described in Table 1.
Experimental design in different periods of life

CC: rats fed a control diet in the perinatal period until adulthood; CH: rats fed a control diet in the perinatal period and a high-fat diet from post weaning to adulthood; HH: rats fed a high-fat diet in the perinatal period until adulthood; HC: rats fed a high-fat diet in the perinatal period and a control diet from weaning to adulthood.
Diets
The control diet was composed of commercial rat food (Nuvilab® CR1), containing in 100 g: 22.0% protein, 57.0% carbohydrate, 4% lipids, totaling approximately 3.5 kcal/g. The HFD was composed of commercial feed (Nuvilab®), roasted peanuts, milk chocolate and cookies, containing in 100 g: 46% carbohydrate, 17% protein, 23% lipids, and approximately 4.5 kcal/g Reference Estadella, Oyama, Dâmaso, Ribeiro and Nascimento26,Reference Oliveira, Leandro and Deiró27 (Table 2).
Experimental diet compositions

HFD: high-fat diet. Oliveira et al., (2011) Reference Percie du Sert, Hurst and Ahluwalia25
Body weight
After birth, the animals were handled on the second day of life, considered day 1st in this study. The animals were weighed on alternate days from the 1st to the 60th day of life. The weighing was performed on an electronic digital scale -Marte, model 131 S-4000, with a sensitivity of 0.001 g.
Histological processing and analysis
At 60 d, the rats were euthanized after a 12-h fast. The animals underwent laparotomy to collect visceral adipose tissue (represented by the sum of the mesenteric and retroperitoneal adipose tissue) and the intestine, which were weighed and measured. The relative weight of visceral adipose tissue (g) was investigated using the following formula: visceral adipose tissue weight (g)/100 g body weight. The small intestine was measured from the pylorus to the ileocecal junction with the aid of an inelastic tape. The ileum (1 cm away from the ileocecal junction) was excised, cleaned and fixed in paraformaldehyde (10%), then dehydrated with alcohol and xylene, embedded in paraffin wax, sectioned at 5 μm, and stained with hematoxylin and eosin (H&E) for quantitative, histomorphometric and histopathological analysis. Images were captured with a digital camera (Olympus® SC30, 3.0 MP) coupled to an optical microscope (Olympus® BX43F, Minato-Ku, Japan and AxioVison).
Caloric and protein intake
The caloric and protein intake of the offspring was verified in adulthood. The offspring were exposed to a standardized quota (70 g) of the HFD or control. Caloric intake was related to body weight, using the following form: (consumption × diet kcal/weight at 60 d) × 100. The protein intake was calculated using the following index: consumption × protein (%)/100.
Histomorphometric analysis
The thickness (µm) of the muscular tunic, submucosa, mucosa, height and width of villi, and the width and depth of the crypts were evaluated under 10× magnification. The villus width was obtained from the average of three measurements taken at the base, middle third and at the apex. One hundred measurements of each parameter were made, with 10 measurements per image in 10 images of the mesenteric, intermediate, and antimesenteric regions for each rat. Images captured under 40× magnification were used to measure the height and width (at three points) of 80 enterocytes in the ileum of each rat. Measurements were made using Image-Pro Plus 4.5.0.29 (Media Cybernetics Silver Spring, MD, USA). Reference Trevizan, Vicentino-Vieira and Watanabe28,Reference Vicentino-Vieira, Gois and Trevizan29
Histomorphometric analysis of ganglia of the enteric nervous system
The area (profile in µm2) of the myenteric plexus and submucosal plexus ganglia were evaluated under 40× magnification. Ten ganglia per rat from each plexus were measured in the ileum. Reference Pastre, Casagrande and Gois30,Reference Boeing, Gois, Souza, Somensi, Sant'Ana and Silva31
Quantitative analysis of Paneth cells
Stained sections in H&E were used to quantify Paneth cells. The Paneth cells present in 64 intestinal crypts and the granules present in 10 Paneth cells of each rat were quantified. The area occupied by Paneth cells in 64 intestinal crypts of each rat was measured. Twenty images (5/quadrant/rat), captured in the 100× objective, were used. Reference Lee, Lee and Kim4,Reference Vicentino-Vieira, Gois and Trevizan29,Reference Santos, Ferlini, Vicentino, Lonardoni, Sant'Ana and Melo32
Quantification of intraepithelial lymphocytes (IELs)
Quantification of intraepithelial lymphocytes (IELs) was performed in the tissue samples stained with H&E. The IELs of 2500 epithelial cells of the ileum of each rat were counted and the number of IELs/100 epithelial cells calculated. Quantification was performed directly under the photonic microscope (CX31 Olympus) under 40× magnification. Reference Sant’Ana, Góis, Zanoni, Silva, Silva and Araújo33
Quantitative analysis of goblet cells
Quantification of goblet cells was performed on tissue samples stained with H&E Reference Mello, Silva and Fonte1,Reference Hamilton, Boudry, Lemay and Raybould3 . Six fields were captured for each slide corresponding to each animal; the slides were photographed using the photonic microscope (AxioVision) under 20× magnification. To quantify the cells, histomorphometric analysis software (ImageJ) was used. The results were expressed as the number of goblet cells per microscopic field.
Histopathological analysis
Histopathological analysis was performed on the tissue samples stained with H&E and analyzed under a photonic microscope following the criteria described in previous studies Reference Boeing, Gois, Souza, Somensi, Sant'Ana and Silva31,Reference Taha, Dahill, Nakshabendi, Lee, Sturrock and Russell34–Reference Santos, Lima and Mota37 with a few modifications: (i) the mucosal histoarchitecture loss score was considered as: 0 – normal histological findings; 1 – slight focal or diffuse inflammation in the lamina propria, but with normal epithelium and mild edema and congestion; 2 – moderate focal or diffuse inflammation, rupture of the epithelium; or 3 – intense focal or diffuse inflammation, intense destruction of the epithelium, flattening of the mucosa and villi broadening, abscess formation in villi or crypts; (ii) the presence of occasional inflammatory cells in the lamina propria was scored as 0; increased numbers of inflammatory cells in the lamina propria was assigned score 1; confluence of inflammatory cells extending into the submucosa was scored as 2; and transmural extension of the infiltrate was scored as 3; (iii) the cryptitis score in the ileum was considered as: 0 – absence; 1 – discrete; 2 – moderate; and 3 – intense presence of neutrophils between crypt epithelial cells.
Statistical analysis
In the present study, the total sample size was calculated based on the experimental design using one-way ANOVA to compare the control, HFD and HFD + control groups, using the G * Power software (version 3.1.9.2). The parameters evaluated were from intestinal histomorphometry, getting: power = 0.8, level of significance = 0.05 and effect size (average) = 0.53. Reference Andrade, Almeida and Espeschit38,Reference Scoaris, Rizo and Roldi39
The data were submitted to the D'Agostino-Pearson or Kolmogorov–Smirnov normality test. Data comparisons used one-way ANOVA followed by Bonferroni tests (parametric data) and for the nonparametric data was used Kruskal–Wallis followed by Dunn’s test. Parametric data are presented as means and standard error (SEM), whereas nonparametric data are presented as medians and interquartile range (P25; P75). For comparison between two groups, we used an unpaired t test. All tests were performed using GraphPad Prism software (Version 5.01). The data were considered statistically significant when p < 0.05.
Results
Body weight
Birth weight was not significantly different between groups (CC, 7.026 ± 0.17; CH, 6.630 ± 0.23; HH, 6.342 ± 0.15; HC, 6.408 ± 0.22); p = 0.6351. But the relative weight gain during the lactation period (1st to 21st day of life) was higher in the group of offspring of mothers who consumed HFD compared to offspring of control mothers (H, 478.7 ± 17.76 N = 20; C, 413.1 ± 12.51 ; p < 0.0045); Fig. 1A. Greater weight gain was also observed from the 1st to the 60th day of life in rats exposed to HFD in the perinatal period compared to the control (HC, 3393 ± 114.9; CC, 2653 ± 65.37; p < 0.0001); Fig. 1B.
(A) Percentage of weight gain from 1st to 21st days of life (%); (B) Percentage of weight gain from 1st to 60th days of life (%); Absolute (C) and relative (D) weight of the visceral adipose tissue; (E) Caloric (Kcal) and (F) protein (%) Intake of rats descended from mothers submitted to a control diet or a high-fat diet and who continued or not consuming the same maternal diet after weaning. Values are presented as mean + SEM using one way ANOVA, followed by the Bonferroni and Dunn’s multiple comparison test; Significance level: ***p < 0.0001; **p = 0,0105; *p < 0.05 CC, n = 9; CH, n = 9; HH, n = 9; HC, n = 9.

Visceral adipose tissue weight
There was an accumulation of absolute and relative visceral fat in rats submitted to an HFD in the post-weaning period (CH, 3.938 ± 0.26 absolute; CH, 2.327 ± 0.15 relative) and in those exposed during the gestation period to adulthood (HH, 3.689 ± 0.33 absolute; HH, 2.407 ± 0.18 relative) compared to the control group (CC, 2.637 ± 0.21 absolute; CC, 1.414 ± 0.13 relative; p < 0.0001); Fig. 1C and D.
Caloric and protein intake
There was a higher relative caloric intake in rats submitted to a HFD in the post-weaning period (CH, 682.0 ± 25.00) and during the perinatal period and throughout life (HH, 688.5 ± 23.56) in relation to the control group (CC, 606.4 ± 9.149; p = 0.0168); Fig. 1E. For protein intake, lower consumption was observed in the CH (6.139 ± 0.3282) and HH (5.391 ± 0.2142) groups in relation to the CC control group (10.12 ± 0.1580; p < 0.0001); Fig. 1F.
Intestine length and mass
Fig. 2A and B shows the length of the small intestine of rats submitted or not to an HFD. There was a reduction in the intestine length of rats in the CH (106,8 ± 1.39 absolute) and HH (99,34 ± 1.87 absolute) groups when compared to the CC (control) group (114.60 ± 1.83; p < 0.0001). There was no significant difference in the relative length of the intestine between the groups.
(A and B) Absolute e relative length (cm) of the small intestine; (C and D) Absolute e relative mass intestine of rats descended from mothers who were submitted to a control diet or a high-fat diet and who continued or not consuming the same maternal diet after weaning. Values are presented as mean + SEM using one way ANOVA, followed by the Bonferroni multiple comparison test. Significance level: ***p < 0.0001; **p = 0.0019; *p < 0.05. CC, n = 10; CH, n = 9; HH, n = 10; HC, n = 9.

There was a reduction in the absolute intestine mass (g) of rats in the CH (14.81 ± 0.75) and HH (11.14 ± 0.76) groups when compared to the CC group (17.55 ± 0.80; p < 0.0001; Fig. 2C). As for the relative mass of the intestine, a reduction was observed in the HH (7.594 ± 0.49) and HC (7.126 ± 0.34) groups compared to the CC (9.245 ± 0.37); p = 0.0019; Fig. 2D.
Ileum wall histomorphometry
The results of the histomorphometric analysis of the ileal wall can be observed in Table 3. The muscular tunic suffered hypertrophy with an increase of 12% in the CH group (134.20 ± 4.46) (p < 0.0001) when compared to the CC; on the other hand, in the HH (76.07 ± 2.47) and HC (76.38 ± 2.69) groups there was atrophy, with a 37% reduction (p < 0.0001) compared to the CC control group (120.20 ± 5.08). Atrophy was also observed in the thickness of the submucosa, and the HH group (19.79 ± 0.58) showed a reduction of 28% compared to the CC (27.36 ± 0.71; p < 0.0001).
Histomorphometry of the strata of the wall of the ileum of rats fed a control or high-fat diet in the perinatal period or even adulthood

Means ± standard error followed by different letters (a and b) in the same line are significantly different (P < 0.05) compared to CC. One-way ANOVA analysis of variance was performed, followed by Bonferroni post-test. CC, n = 10; CH, n = 9; HH, n = 10; HC, n = 9.
As for the thickness of the mucosa, there was hypertrophy with an increase of 31% in the CH group (318.0 ± 12.04) and atrophy in the HH (132.0 ± 1.31) and HC (185.9 ± 5.12) groups with 46% and 24% reductions, respectively (p < 0.0001) compared to the CC group (243.21 ± 8.55). The rats in the HH group, who received an HFD from gestation to adulthood, showed a 29% reduction in the depth of the crypts (109.61 ± 3.02) compared to the control (CC, 151.90 ± 5.61; p < 0.0001). There was a 5% increase in the width of the crypts in the ileum mucosa of rats in the HH (48.04 ± 0.62) and HC (48.93 ± 0.93) groups when compared to the control (45.51 ± 0.77; p < 0.0013).
In relation to the villi, there was a reduction of 41% and 18% in villus height respectively for groups HH (170.0 ± 5.41) and HC (236.0 ± 5.02) compared to control (287.11 ± 8.87; p < 0.0001). There was a 12% increase in villus width in the CH group (82.94 ± 2.05) and an 11% reduction in the HH group (66.22 ± 1.56) compared to the CC (74.11 ± 1.1; p < 0.0001).
As for enterocytes, an increase of 18% in height was observed in the HC group (27.29 ± 0.76) compared to the CC (23.08 ± 0.49; p < 0.0001). The width of the enterocytes, in turn, increased 8% in the HH group (9.08 ± 0.11) compared to the CC (8.42 ± 0.12; p < 0.0005).
Histomorphometric evaluation of ganglia of the enteric nervous system
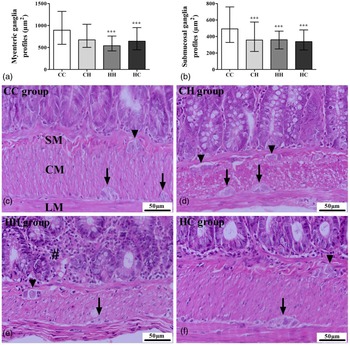
There was a reduction in the profile area of the myenteric plexus ganglia present in the muscular layer of the ileum of rats in the HH (median = 541.2; IQ: 423.1 and 761.3) and HC (median = 646.1; IQ: 449.9 and 952.8) groups compared to CC (median = 894.7; IQ: 573.7 and 1322.9; Fig. 3A). In the submucosal plexus, the area of the ganglion profiles decreased (p < 0.0001) in all experimental groups that consumed an HFD, regardless of the phase of life when compared to the control (Fig. 3B). The ganglia of the myenteric and submucosal plexuses can be seen in Fig. 3C–F.
Histomorphometry of the myenteric and submucosal plexus ganglia. Ganglion profiles of the myenteric (A) and submucosal (B) plexuses. The non-parametric data were expressed as median with interquartile range and compared by Kruskall–Wallis followed by Dunn’s post-test. ***p<0.001 compared to CC. (C-F) Photomicrographs of the tissues stained by H&E. The myenteric plexus (arrows) between the longitudinal (LM) and circular (CM) layers of the external musculature, and the submucosal plexus (arrowheads) in the submucosa (SM) of the ileum wall. (E) Note a large number of immune cells in the lamina propria, diffuse mononuclear inflammatory infiltrate and atrophy of crypts (#). Objective lens 40x. CC, n = 10; CH, n = 9; HH, n = 10; HC, n = 9.

Quantification of Paneth cells
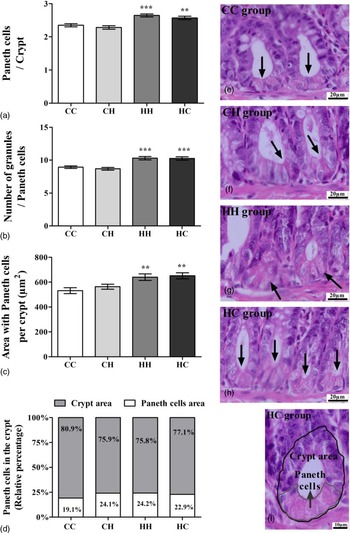
The number of Paneth cells per intestinal crypt increased in the HH group (2.64 ± 0.04) and the HC group (2.56 ± 0.05) compared to the CC (2.34 ± 0.04; p < 0.0001) (Fig. 4A). The same was observed in relation to the number of granules per Paneth cell, both in the HH group (10.30 ± 0.26) and in the HC group (10.25 ± 0.25), which presented a greater number of granules compared to CC (8.93 ± 0.19; p < 0.0001; Fig. 4B). There was an increase in the area occupied by Paneth cells in intestinal crypts in the HH (24.2%) and HC (22.9%) groups compared to the CC group, in which they occupied 18.52% of the intestinal crypt area (Fig. 4C and D). Intestinal crypts can be seen in Fig. 4E–I.
Quantification of the Paneth cells. (A) Number of Paneth cells per intestinal crypt; (B) Number of granules per Paneth cell; (C) Area occupied by Paneth cells in the intestinal crypt. The data were expressed as Mean ± standard error. One-way ANOVA analysis of variance was performed, followed by Bonferroni post-test. *p < 0.05, **p < 0.01, ***p < 0.001 compared to CC. (D) Percentage (%) relative to the area occupied by Paneth cells in intestinal crypt. (E-H) Hematoxylin and eosin (H&E) staining of ileum showing typical eosinophilic granules of Paneth cells at the base of the crypts (arrows). (I) Crypt area (external) and area occupied by Paneth cells (internal). Objective lens 100x. CC, n = 10; CH, n = 9; HH, n = 10; HC, n = 9.

Quantification of IELs
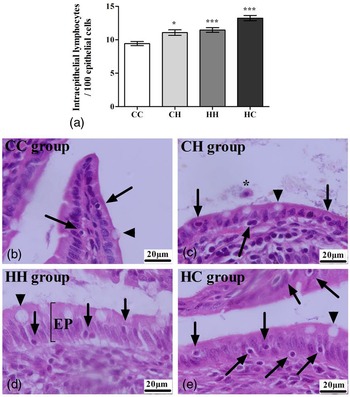
There was a significant increase in the number of IELs in all groups exposed to an HFD, regardless of the phase of exposure to the diet (CH 11.07 ± 0.42; HH 11.45 ± 0.34; HC, 13.25 ± 0.39) compared to the CC group (9.43 ± 0.30; p < 0.0001; Fig. 5A). IELs can be seen in Fig. 5B–E.
Quantification of intraepithelial lymphocytes (IELs). (A) IELs in the ileum. The data were expressed as Mean ± standard error. One-way ANOVA analysis of variance was performed, followed by Bonferroni post-test. *p < 0.05, ***p < 0.001 compared to CC. (B-E) Photomicrographs of the tissues stained by H&E. Distribution of IELs (arrows) in the epithelium (EP). Note the presence of goblet cells in the epithelium (arrowheads) and leukocyte in the intestinal lumen (*). Objective lens 100x. F = 17,83; df = 899. CC, n = 10; CH, n = 9; HH, n = 10; HC, n = 9.

Quantification of goblet cells
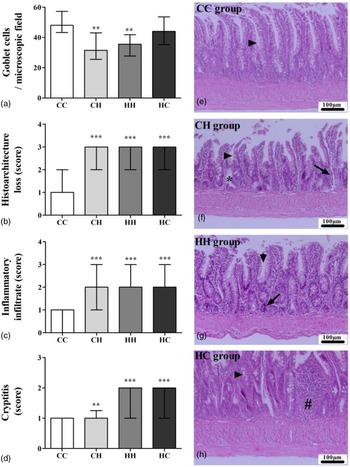
There was a reduction in the number of goblet cells in the ileum mucosa of the rats of the CH (33.25 ± 3.09) and HH (34.50 ± 2.64) groups when compared to the CC group (49.75 ± 2.60; p < 0.0001; Fig. 6A). Goblet cells can be identified (arrowed) in Fig. 6E–H.
Histomorphology of ileum. (A) Distribution of goblet cells in the ileum epithelium; (B) Histopathological changes in ileal mucosa; (C) presence of diffuse inflammatory infiltrate; (D) Inflammation in intestinal crypts. The non-parametric data were expressed as median with interquartile range and compared by Kruskall–Wallis followed by Dunn’s post-test. **p<0.01, ***p<0.001 compared to CC. (E-H) Photomicrographs of the ileum wall stained by H&E. (E) Normal histoarchitecture, minimal and focal inflammatory cell infiltrate in the mucosa, and numerous goblet cells in villi and intestinal crypts (arrowhead). (F and G) Diffuse inflammatory cell infiltrates in the mucosa, histoarchitecture loss, and flattening of the mucosa accompanied by villous broadening; moderate goblet cell loss (arrowhead); neutrophils between crypt epithelial cells (arrows); bifurcated crypt (asterisk). (H) Focal inflammatory cell infiltrates in the mucosa and submucosa (#); moderate goblet cell loss (arrowhead). Objective lens 20x. CC, n = 10; CH, n = 9; HH, n = 10; HC, n = 9.

Histopathological assessment
The HFD, regardless of the stage of life at which the rats were exposed, caused significant histopathological changes (p < 0.05) in all parameters evaluated, according to the criteria adopted in the present study. There were changes in the mucosal histoarchitecture, from score 2 with moderate focal or diffuse inflammation, rupture of the epithelium (Fig. 6B); an increase in the number of inflammatory cells in the ileum wall scored from 2 with the confluence of inflammatory cells that extended into the submucosa (Fig. 6C); and inflammation in intestinal crypts, which suggested cryptitis from score 1 (Fig. 6D). Histopathological findings can be seen in Fig. 6E–H.
Discussion
The results of the present study showed that perinatal and post-weaning exposure to the HFD induced structural changes in the ileum wall, in enteric ganglia, in the density of Paneth cells, goblet cells, and IELs, and histopathological changes in the intestinal mucosa.
The high fat content present in a diet can induce cell damage and a deficiency or decrease in the consumption of some nutrients, such as protein. In this way, it can contribute to changes in the dynamic and normal balance of the organism, since nutrients are important for the development of organ and tissue structures, the nutritional balance of the food being necessary for these nutrients to perform their functions properly. Reference Lee, Lee and Kim4,Reference Natali, Neto and Orsie8,Reference Hermes, Azevedo, Araújo and Sant’Ana9
The present study showed that the increased caloric intake due of the HFD consumption reduced the mass of the small intestine and caused the accumulation of visceral fat in rats fed in the post-weaning period and in those who consumed HFD for life, the consequences of this diet in this group being the most harmful. HFD simulates the modern diet in humans, Reference Hariri and Thibault40 and one of the main implications is the accumulation of visceral fat, which is associated with components of the intestinal microbiota. Reference Beaumont, Goodrich and Jackson41 Another effect observed in this study was the reduction in the length of the intestine, in agreement with the results of Soares et al. (2015) who demonstrated a 10% reduction in the size of the small intestine in mice that consumed an HFD in adulthood. Reference Soares, Beraldi, Ferreira, Bazotte and Buttow42 After the recovery of healthy eating habits, this study showed that parameters such as weight and bowel length can be attenuated even after HFD exposure in the critical period of development. It is worth mentioning that the reduction in the size of the intestine can compromise the absorption of nutrients Reference Natali, Neto and Orsie8,Reference Hermes, Azevedo, Araújo and Sant’Ana9 and affect the turnover in the intestinal epithelium. Reference Azevedo, Hermes, Manzano, Araújo and Sant’Ana43 Thus, it is suggested that early exposure to an HFD favors the accumulation of visceral fat and impairs the development of the small intestine in rats.
Considering the structural changes in the ileum wall, there was a relationship between the consumption of HFD in the perinatal period and after weaning, and a significant increase in the thickness of tunic muscular and mucous membrane, as well as the width of the villus. On the other hand, except for the width of the crypts and the height and width of the enterocytes, which increased, it was found that the consumption of the HFD by the rats during the perinatal period, or perinatal and post-weaning period, caused a significant reduction in the thickness of the ileum wall. Similar to the results found in this study, Soares et al. (2015) showed that the consumption of an HFD caused significant morphometric changes in parameters such as muscle layer, crypt depth, villus height, goblet cells and IELs evaluated in the ileum wall. Reference Soares, Beraldi, Ferreira, Bazotte and Buttow42
The impairment in the size of the villus may be reflected in the reduction in the transport of nutrients on the surface of the enterocytes, with a decrease in the enzymatic content of the intestinal mucosa, which may consequently favor malabsorption, in addition to losses in the formation of mucous cells with consequent damage to the intestinal barrier. Reference Bischoff, Buurman and Ockhuizen2,Reference Caruso and Demonte5 Literature data report that diets with a high content of fat induce pathophysiological changes in the gastrointestinal tract due to imbalances in protein intake and synthesis Reference Caruso and Demonte5,Reference Navarrete, Vásquez and Sol6,Reference Brandão, Angelis, Souza, Fróes and Liberti44,Reference Araújo, Sant’Ana, Molinari and Neto45 and in the intestinal microbiota. Reference Hamilton, Boudry, Lemay and Raybould3,Reference Valdes, Walter, Segal and Spector46-Reference Mujico, Baccan, Gheorghe, Díaz and Marcos50
It is believed that the consumption of an HFD in the perinatal period (pregnancy and lactation) and after weaning caused dysbiosis which, in turn, intensified intestinal inflammation. Reference Hamilton, Boudry, Lemay and Raybould3 Thus, it is suggested that the increase in the thickness of the ileum mucosa was caused by edema, as well as by the recruitment of immune cells to the lamina propria. This atrophy is related to the reduction in villus height and crypt depth observed in these groups. Reference Shaw, Gohil and Basson48 However, the consumption of HFD in all groups was able to harm more sensitive parameters such as immune cells. Regarding the strata that reduced the thickness, it is believed that the reduction in protein present in the HFD in relation to the control diet (from 22% to 17%) and the amount of protein consumed associated with the consumption of fat in this diet affected the cell renewal rate in the ileum wall, whose effects contributed to the reduction in its mass and length. It has been reported in the literature that the consumption of an HFD associated with reduced protein supply (from 22% to 20%) caused significant morphometric changes in the ileum wall and myenteric neurons. Reference Soares, Beraldi, Ferreira, Bazotte and Buttow42 Thus, it is possible to infer that the early consumption of an HFD associated with a reduction in the supply of proteins alters the ileum histoarchitecture.
Studies suggest that an HFD compromises the development of the ENS Reference Carabotti, Scirocco and Maselli12,Reference Ye and Srinivasan14 and alter gastrointestinal motility patterns. Reference Soares, Beraldi, Ferreira, Bazotte and Buttow42,Reference Beraldi, Soares and Borges51,Reference Anitha, Reichardt and Tabatabavakili52 Gastrointestinal functions are controlled by the ENS, an intrinsic nervous system that consists of neurons and cells of the enteric glia, organized in interconnected ganglia forming two main plexuses: the myenteric plexus (or Auerbach plexus), which controls motility; and the submucosal plexus (or Meissner plexus), which coordinates absorption, secretion, and local blood flow and modulates the permeability of the epithelial barrier. Reference Lomax, Fernández and Sharkey18,Reference Furness and Costa53 In the present study, it was demonstrated that the consumption of the HFD caused neuroplastic changes in the area of myenteric and submucosal plexus ganglia.
The reduction in the areas of the myenteric and submucosal plexus ganglion profiles may be a result of the rearrangement caused by the reduction in the chemical mediator’s synthesis machinery resulting from the activation of ENS adaptation mechanisms triggered by dysbiosis and immunopathology, or the loss of neurons and/or glial cells due to metabolic adaptations caused by protein deficiency, or by HFD-induced apoptosis. Beraldi et al. (2015) suggest that the excess of saturated fatty acids caused mitochondrial damage which induced neuronal apoptosis. Reference Beraldi, Soares and Borges51 Anitha et al. (2016) reported that HFD consumption causes apoptosis in enteric neurons and delays gastrointestinal transit. Reference Anitha, Reichardt and Tabatabavakili52 Therefore, the reduction in the ganglionic profile as observed in this study, can lead to a small reduction in the synthesis machinery or changes in the chemical code, compromising, for example, intestinal motility. In addition, prolonged intake of HFD caused ganglionic remodeling and morphometric and quantitative changes in enteric neurons which have been described as enteric neural plasticity. Reference Srugo, Bloise, Nguyen and Connor13
The consumption of the HFD in this study also caused other significant changes to Paneth cells, IELs, goblet cells and in the architecture of the ileum mucosa. In this study HFD consumption has been shown to cause a significant increase in the number of Paneth cells, as well as in the number of granules and the area occupied by these cells. These changes occurred during the perinatal period and after weaning, therefore, it is suggested that there was programming during intestinal ontogenesis. Paneth cells, present at the base of intestinal crypts, play a role in innate immunity and an important role in maintaining intestinal homeostasis. They produce and release AMPs, including cryptidines (α-defensin) and lysozymes, which are key molecules in the interaction between the intestinal microbiota and the host. Reference Bischoff, Buurman and Ockhuizen2,Reference Guo, Li and Tang22,Reference Clevers and Bevins54 Studies demonstrate that an HFD causes significant changes in the intestinal microbiota Reference Hamilton, Boudry, Lemay and Raybould3,Reference Bruce-Keller, Fernandez-Kim and Townsend10,Reference Prendergast and Kelly55 and activate inflammatory processes that, in turn, increase the expression of AMPs. Reference Guo, Li and Tang22 The results of this study suggest that there was an increase in the production and release of AMPs to prevent microbial translocation due to the increase in intestinal permeability induced by the HFD.
The evaluation of goblet cells showed that the HFD caused a significant reduction in their density in the groups that consumed this diet after weaning and from pregnancy to adulthood. Different experimental models of HFDs corroborate the findings of this study. Reference Hamilton, Boudry, Lemay and Raybould3,Reference Lee, Lee and Kim4,Reference Soares, Beraldi, Ferreira, Bazotte and Buttow42 The reduction in the number of goblet cells was reported after one, Reference Hamilton, Boudry, Lemay and Raybould3 eight, Reference Soares, Beraldi, Ferreira, Bazotte and Buttow42 and 15 weeks of treatment Reference Lee, Lee and Kim4 in animals submitted to a diet with different fat concentrations (45%, 35%, and 60%, respectively). Goblet cells are responsible for the production and release of mucins, which form a film that lubricates and protects the intestinal epithelium against pathogens Reference Boeing, Gois, Souza, Somensi, Sant'Ana and Silva31 and prevents microbial translocation. Reference Kim and Ho56 Goblet cell dysfunction causes increased intestinal permeability and predisposes to colitis. Reference Lee, Lee and Kim4,Reference Kim and Ho56 The reduction in goblet cells in the present study was a further indication that the consumption of HFDs causes ileitis. Reference Soares, Beraldi, Ferreira, Bazotte and Buttow42 The probable increase in AMPs made the epithelium more responsive. Nevertheless, the reduction in mucus favored the adhesion of pathobionts, thus ideal conditions for inflammation arose. In addition, it can be seen that the change in eating habits in the group exposed to HFD only in the perinatal period was able to restore the number of goblet cells, but did not attenuate inflammation. Mechanisms associated with decreased mucin expression may be a justification for these findings. Guiburdenche et al. 2021, in their study, showed that offspring of mothers exposed to HFD showed a reduction in the expression of Muc 2 in the ileum, which may explain the inflammation observed in these animals. Reference Guibourdenche, Sabbouri and Djekkoun57
The ileitis found in this study is related to the increase in the proportion of IELs and histopathological findings. Along with enterocytes, Paneth cells and goblet cells, IELs actively participate in the protection of the epithelial barrier through the secretion of TGF-β, Reference Toumi, Neunlist and Denis58 but they can also contribute to inflammation with the secretion of pro-inflammatory cytokines and AMPs regulated by commensal bacteria. Reference Chen, Ni and Sun59,Reference Kaer and Olivares-Villagómez60 A study showed that consumption of HFD alters the IELs, observing activation of pro-inflammatory cytokines such as TNF-α, perforin and granzyme B, not demonstrating alterations in cytokines that promote protection of the intestinal barrier such as TGF-β. Reference Franco, Pérez, Ramirez, González and López61 Studies suggest that consumption of this diet is associated with increased intestinal permeability, LPS, with changes in proteins such as occludin, which can result in increased IELs, thus triggering inflammatory processes. Reference Franco, Pérez, Ramirez, González and López61-Reference Liu, Brooks and Ciappio63 A reflection of this response were the histopathological findings, including the loss of mucosal histoarchitecture, the intense presence of inflammatory infiltrates, and cryptitis. An HFD favors the proliferation of gram-negative bacteria in the intestinal microbiota, Reference Lee, Lee and Kim4 which, in turn, leads to an increase in endotoxins and causes inflammation of the mucosa due to endotoxemia, Reference Beraldi, Soares and Borges51,Reference Cani, Neyrinck and Fava64 and severe damage to the intestine due to the effect known as intestinal lipotoxicity. Reference Tanaka, Nemoto and Takei65
Conclusion
Taken together, our results showed that the maternal HFD during pregnancy and lactation and weaning associated with consumption in the post-weaning period caused changes in the structure of the ileum wall, in enteric ganglia, in the density of Paneth cells, goblet cells, and IELs, and impaired the histoarchitecture of the ileum mucosa. From this evidence, we can conclude that these offspring are predisposed to impaired nutrient absorption, gastrointestinal dysfunction, and the appearance of inflammatory bowel diseases. However, some the effects can be mitigated by changes in eating habits.
Acknowledgments
We thank Federal University of Bahia, School of Nutrition, Graduate Program in Food, Nutrition and FAPESB (Fundação de Amparo à Pesquisa do Estado da Bahia).
Author contributions
Designed and design of the study: GSC, JMBM, LSS, DAES, RTS, and MUP; Supervision of postgraduate activities: JMBM; Histological analysis: GSC, MBG, and JNS; Statistical analysis, interpretation data, and manuscript: GSC, MBG, LSS, and JMBM. Review of manuscript writing: GSC, MBG, JMBM, LSS, MEPCM, and TCBJD. All authors read and approved the final manuscript.
Financial support
This work was supported by National Council for Scientific and Technological Development [grant number 481822/2013-5]. Gabriele dos Santos Cordeiro was the recipient of a doctoral fellowship from FAPESB (Fundação de Amparo à Pesquisa do Estado da Bahia), Brazil.
Conflicts of interest
The authors declare that they have no conflicts of interest.
Ethical standards
The authors assert that all procedures contributing to this work comply with the ethical standards described in the of the Brazilian Society of Science in Laboratory Animals (SBCAL) and guidelines of ARRIVE (Animal Research: Reporting of in Vivo Experiments) and have been approved by the Ethics Committee on Animal Experimentation, Faculty of Veterinary Medicine and Animal Science, Federal University of Bahia, according to protocol n°. 59/2017.