I. INTRODUCTION
The synthesis of one-dimensional (1D) nanostructures has recently attracted tremendous interest due to their unique properties.Reference Schoen, Schoen, Hu, Kim, Heilshorn and Cui1 Specifically, nanowires (NWs) often show distinct properties from their bulk counterparts because of radial confinementReference Jung, Lee, Ko and Agarwal2 that makes them promising for numerous applications, mostly in electronics and materials science. Silicon carbide possesses excellent chemical, thermal, mechanical, and electronic properties,Reference Pol, Pol and Gedanken3 and SiC nanowires (SiCNWs) can be used as interconnects in integrated circuits and they are also compatible with the processing of electronic devices. However, all synthesis techniques of SiCNWs involve complicated processes and usually long-duration reactions.
To overcome those drawbacks, we describe a simple, easy to operate, and one-step efficient SiCNWs production via transformation of poly(tetrafluoroethylene) (PTFE) into SiCNWs using elemental Si during self-propagating high-temperature synthesis (SHS).Reference Cao and Rogers4 The very high temperatures/pressures and rapid movement of the reaction front wave, with its resultant local self-quenching, can yield unique micro- and nanostructured compositions.Reference Yermekova, Mansurov and Mukasyan5 PTFE has already been shown to be effectively defluorinated using different reducers by fast combustion synthesis.Reference Huczko, Lange, Chojecki, Cudziło, Zhu, Kroto and Walton6 The use of Si-bearing reducers resulted in the efficient formation of 1D SiC.Reference Huczko, Bystrzejewski, Lange, Fabianowska, Cudziło, Panas and Szala7 The molar ratio of powdered reactants was balanced to produce just salt and soot as byproducts as given in the equation:

The transformation mechanism from starting reactants to SiCNWs has not been clarified yet, and the present study of the growth process and characterization of nanostructures is obviously important. Various SiC growth conditions can affect the reaction yield. These variables include (but are not limited to): growth technique, starting reactant mixture characterization (mass, reducer/oxidizer ratio), gas pressure, and combustion atmosphere. The last one seems to be crucial since the synthesis evidently proceeds via gas phase intermediates, i.e., one can see a significant qualitative difference between Si/PTFE mixtures combusted in air and in argon.
II. EXPERIMENTAL
A. Materials
PTFE (particle size below 1 μm; Aldrich, Steinheim, Germany) and elemental Si (particle size below 43 μm, 99%; Aldrich, Steinheim, Germany) were thoroughly mixed and used in the proper stoichiometric proportion.
B. Methodology for the combustion synthesis
Typically, combustion synthesis was carried out in a stainless steel reaction vessel modeled after a bomb calorimeter under 10 atm initial pressure at either argon or air atmosphere. The high-pressure reactor was provided with an observation port for emission spectroscopy diagnostics since the light emitted during SiC synthesis was used to estimate the reaction temperature. The fast combustion of the starting reactants, placed in a quartz crucible, was ignited by ohmic heating and was completed within a fraction of a second. After the reaction, the reactor was filled with a large amount of a dark, sponge-like product (characteristic for fibrous material), which was collected for the following analyses.
C. Sample characterization
Powder low-angle x-ray diffraction (XRD) (Cu Kα radiation, Siemens diffractometer D500, Munich, Germany) was applied to identify the products. The Raman spectroscopy (514.5-nm Ar laser, 2 cm−1 spectral resolution) was carried out to better characterize SiCNWs. The morphology of the product was studied by scanning electron microscope (SEM) (LeO 500). The purified SiCNWs were subjected to transmission electron microscopy (TEM) (aberration-corrected TEM on a JEOL 2010F, Tokyo, Japan operated at 200 kV and Tecnai F30, Eindhoven, Netherlands operated at 300 kV). The samples for TEM were prepared by first dispersing the material with acetone in an ultrasonic bath. The obtained solution was then dropped onto a standard copper TEM grid. The content of unreacted Si in products was measured using wet chemistry protocol (dissolution in boiling conc. KOHaq and measurement of the volume of evolved H2). The SiCNWs were finally isolated via the two-step chemical treatment: (i) KOHaq removal of unreacted Si and (ii) combustion of free carbon in air (700 °C).
III. RESULTS AND DISCUSSION
A. Emission spectroscopy
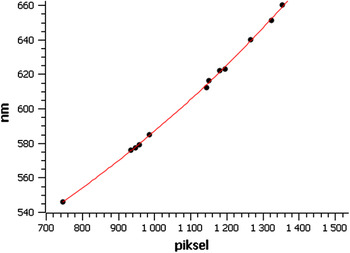
Spectroscopic measurements were carried out to estimate the combustion temperature. Each combustion produced one spectrum, averaged over the combustion duration. To calibrate the system, the emission bands of mercury and neon lamps were used. The well-known Hartmann’s formula was adopted: λ(x) = a +  , where λ is the wave length [nm]; x is the Hg line positions on a charge-coupled device detector; and a, b, c are the adjusted parameters. The obtained dispersion curve is presented in Fig. 1. The registered spectra turned out to be a characteristic of combusted reactants under formerly selected operational parameters. Thus, they could be considered as a diagnostic signal of the system.
Calibration curve for optical emission spectroscopy measurements.

The emission continuum spectra allow for an estimate of the average combustion temperature. For such calculations Planck’s black body radiation model was assumed:

and after transformation for the spectral interval in Fig. 1, the formulae used for temperature determination is as follows:

where c 2 = 1439 cm·K.
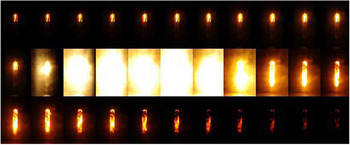
The time-resolved (30 ms) history of the combustion is shown in Fig. 2.
Photographic registration of the sample combusted in air.

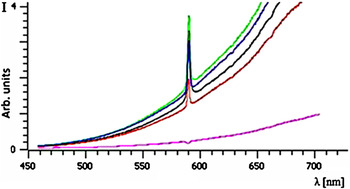
From the measured emission spectra (Fig. 3), one can see a significant qualitative difference between Si/PTFE mixtures combusted in air (four slightly different curves, depending on starting mass of reactants and pressure) and in argon (the lower curve with absorption pick instead of the emission one). The 588-nm sodium line appears broadened by high pressure and results from impurities (previous reactants, e.g., NaN3). The estimated average temperature over the combustion time and volume was ∼1800 ± 100 K. The combustion temperature fits nicely with the well-known thermodynamic “window” for SiC formation and with the initial adiabatic temperature (1600–1700 K) for direct SiC formation.
Emission spectra for the combustion in air (upper curves) and argon (lower curve).

B. Synthesis and characterization of SiCNWs
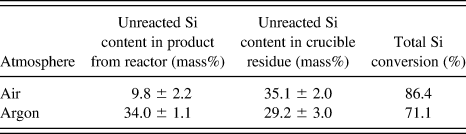
The combustion of Si/PTFE mixtures was carried out either in argon or in an air atmosphere. From the measurements of unreacted elemental silicon content in the product (both the reactor’s material and crucible residue), the total conversion of starting Si was calculated (Table I).
Unreacted Si content and the total Si conversion.

Higher conversion of Si (almost 90%) was observed for the combustion in air with the fibrous material filling the reactor containing below 10 mass% of the starting silicon.
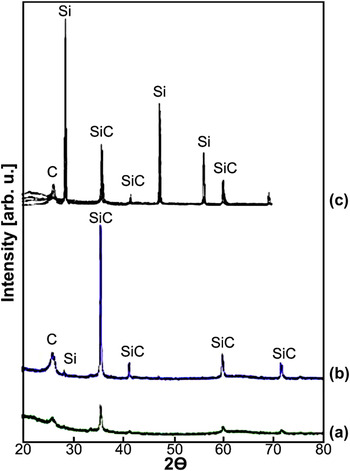
XRD was applied to identify the single-phase crystalline products obtained in air (Fig. 4).
X-ray diffraction patterns of the single-phase crystalline products. (a) Crucible residue, air atmosphere; (b) sponge-like product from the reactor, air atmosphere; (c) product from reactor, argon atmosphere.

The XRD patterns of the as-obtained sample were dominated by strong and sharp main diffraction lines (2θ = 35.6° for SiC (111), 41.4° for SiC (200), 60.0° for SiC (220), and 72.0° for SiC (311), respectively) assigned to the standard β-phase of silicon carbide (3C-SiC polytype, a = 0.4358 nm, JCPDS Card No. 291129). The peak centered at 26.2° corresponds to the (002) plane of graphite. The Si reflection (at 28.4°) comes from the surviving starting silicon. Quantitative composition of the main sponge-like product from the reactor [Fig. 4(b)] is different comparing to the crucible residue [Fig. 4(a)] since the contents of unreacted silicon and carbon are lower. Evidently, the conversion of those components within the reactor was much more pronounced compared to the crucible content within which the gas diffusion was limited. This points to a gas phase mode for the SHS process. A significantly lower Si → SiCNW conversion was observed for the reaction carried out in an argon atmosphere [Fig. 4(c)]; i.e., a relatively low content of SiC is found in the product.
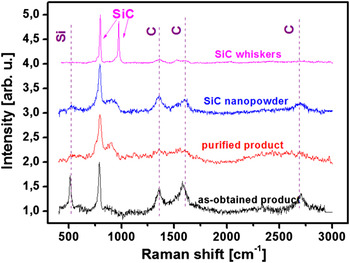
To better characterize the produced SiCNWs, the Raman spectroscopy (514.5-nm Ar laser) was carried out on both the reference materials and experimental samples obtained in combustion in air (Fig. 5).
Raman spectra of as-obtained and purified products (combustion in air). Spectra of commercially available SiC whiskers and nanopowder are shown for comparison.

The spectrum for the as-obtained product shows three phases to be present, i.e., crystalline silicon (519 cm−1), SiC (795 cm−1), and solid carbon (1350, 1590, and 2700 cm−1). This picture is in perfect agreement with the phase composition obtained from the XRD patterns. Interestingly, the occurrence of the second-order Raman band for the solid carbon (2700 cm−1) points to the crystalline character of this phase. As the carbon materials obtained from thermal decomposition of polymers at temperatures 800–1300 K have a very low graphitization degree, the obtained second-order Raman band (2700 cm−1) for combustion in air has to be a consequence of high temperature occurring in the synthesis process. In fact, this statement is supported by the temperature window evaluated from the emission spectroscopy measurements as evidenced above. The spectrum for the purified product has a band located at 795 cm−1 and this feature can be ascribed to β-SiC,Reference Qadri, Iman, Feng, Rath, Yousuf and Singh8 which is in perfect agreement with two reference samples, i.e., commercially available SiC nanopowder (20–25 nm in diameter, according to the manufacturer specification) and microcrystalline SiC whiskers. The Raman band for the microcrystalline sample located at 970 cm−1 is absent in commercial SiC nanopowder and in purified SiCNWs. However, both these samples have a broad band centered at 900–910 cm−1. This could be related to a finite size effect in nanocrystalline samples and may also suggest the presence of multiple polytypes of SiC.Reference Huczko, Lange, Bystrzejewski, Rümmeli, Gemming and Cudziło9
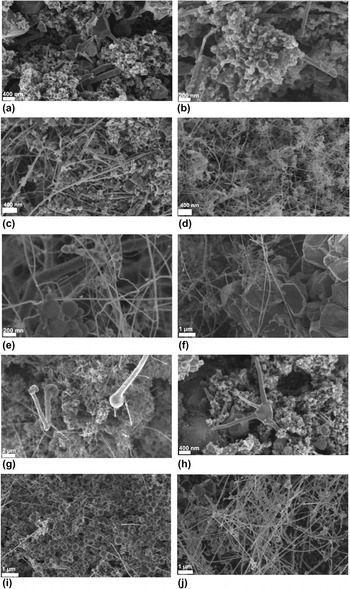
The morphology of the product was studied by SEM (LeO 500). These observations (Fig. 6) provide fascinating examples of different 1D SiC nanostructures produced.
Typical scanning electron microscopy images of products: (a) argon atmosphere, reactor; (b) air atmosphere, crucible residue; (c)–(h) air, reactor; (i) oxygen atmosphere, reactor; (j) purified SiC nanowires (NWs).

In fact, the wide diversity of morphologies formed at high temperature in the Si/C/O system and a variety of growth mechanisms have been already reported.Reference Zhu, Hu, Hsu, Terrones, Grobert, Hare, Kroto, Walton and Terrones10 Only a few nanofibers could be spotted in product from the run carried out in argon [Fig. 6(a)], which are dominated by soot-like material. The nanocrystallites found on the tip of some nanofibers suggest a catalytic growth mechanism. A much higher content of SiCNWs was found in the samples collected from runs in air [Figs. 6(b)–6(h)]. Although 1D nanostructures can be seen in the crucible residue, along with abundant soot [Fig. 6(b)], the product from the reactor [Figs. 6(c)–6(h)] contains the highest concentration of entangled SiCNWs, with the diameters typically in the range of ∼50–100 nm (from the statistical observations, at 95% confidence level, the averaged size was evaluated to be within 60 ± 8 nm). They are several tens of micrometer long. The partial oxidation of unreacted silicon is confirmed by the presence of rarely spotted silica nanoballs [Fig. 6(e)], with diameters from several tens to several hundreds of nanometers. Not only 1D SiC nanostructures but also some three-dimensional (3D) SiC nanocrystallites can be observed [Fig. 6(f)]. Again, 3D nanoparticles (possibly liquid globules) present on the tips of nanofibers [Figs. 6(g) and 6(h)] suggest a vapor–liquid–solid (VLS) catalytic growth mechanism. The product from the run carried out, for comparison, in pure oxygen is dominated by silica nanoballs [Fig. 6(i)]. Surprisingly, some SiCNWs can still be spotted. Thus evidently the combustion process is far from equilibrium and the final product composition is governed by the kinetics of parallel reaction channels. In purified SiCNWs, the abundant SiCNWs [Fig. 6(j)] contain some residual 3D SiC nanostructures, resembling SiC microcrystallites, as reported earlier by Narayan et al.Reference Narayan, Raghunathan, Chowdhury and Jagannadham11 These nanostructures (upper left) exist in relatively low concentrations.
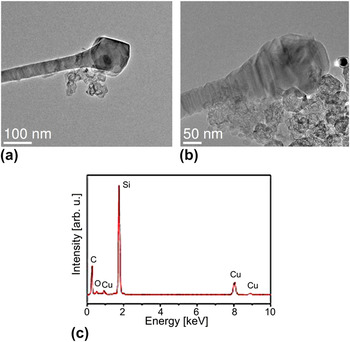
Finally, the purified SiCNWs were subjected to TEM investigations. Previous observationsReference Rümmeli, Adebimpe, Borowiak-Palen, Gemming, Ayala, Iaonnides, Pichler, Huczko, Cudziło, Knupfer and Büchner12 showed that the SiCNWs exhibit various types of growth defects (stacking faults, twin defects), probably arising from the growth process accompanied by thermal stress. The NWs also tend to bend, but such deformation is probably not caused by external forces arising during microscopic observations. Figure 7 shows typical nanofibers with a characteristic expanded head at their tip [visible also in Fig. 6(g)].
Typical transmission electron microscopy (TEM) images of the products: (a, b) the nanofibers with characteristic nanocrystallites on their tips; (c) corresponding energy dispersive x-ray spectroscopy spectrum from expanded head region shown in (b) (Cu signal comes from TEM grid).

Energy dispersive x-ray spectroscopy (EDS) analysis shows strong Si and weak C and O signatures present [Fig. 7(c)]. The Cu signal arises from the TEM grid.
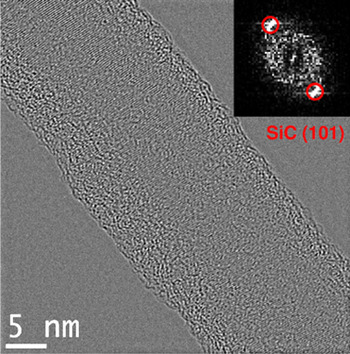
High-resolution transmission electron microscopy crystal lattice image of a SiCNW (Fig. 8) clearly shows that the spacing of lattice fringes is 0.2358 nm, indicating a good crystal direction of {101}. The wire surface is wrapped in a thin amorphous oxide shell. Apart from this, some defects such as stacking faults were also observed.
High-resolution transmission electron microscopic image of SiCNW (inset fast Fourier transform diffraction pattern).

Following those results, we propose here the VLS mechanism for SiCNWs growth. SEM and TEM images show that each wire has an expanded head at one end. In addition, the EDS analysis might support a self-catalytic, Si-mediated mechanism of SiCNW growth following the VLS mode. The presented below mechanism is in line with the study of Belmonte et al.Reference Belmonte, Bonnetain and Ginoux13 who proposed SiC whisker catalytic growth involving the pure silicon or a silicon-rich droplet.
C. Growth mechanism of SiCNWs
The growth of SiCNWs is a complicated process. It is very likely that parallel, intermediate gas phase reactions in an isotropic environment might be involved. When the combustion is initiated, the high-temperature pyrolysis of the PTFE molecules is expected to occur. Thus, the gases at the combustion spot should contain high concentrations of very reactive carbon/fluorine species. PTFE decomposes initially (mostly to relatively stable C2F6, CF4, and some elemental CReference Watanabe, Koyama and Imoto14) at elevated temperature (i.e., at ∼600 °C due to ohmic heating), and evolved CxFy• radicals initiate the exothermic partial gasification/fluorination of silicon:


At the resulting increasing temperature, the following, parallel exothermic oxidation channels (with the residual oxygen involved) are commenced:


SiO2 is formed as an intermediate, which is further reduced to SiO in the presence of carbon (resulting from PTFE pyrolysis) and/or silicon under reducing atmosphere:


In fact, the thermodynamic equilibrium calculations showedReference Huczko, Li and Boulos15 that around 2000 °C the volatile SiO makes a high proportion of gaseous components in Si/O/F systems. Due to rapid quenching by the surrounding gas, the formed silicon and carbon oxides can reactReference Niu and Nong Wang16 and the VLS growth of SiC is initiated:

Acting as a reducing agent, CO can also scavenge O, thereby reducing silicon monoxide to Si element. Chen et al.Reference Chen, Pan, Tang and Shi17 recently studied in detail a SiCNW growth via the screw dislocation manner in the vapor–solid reaction with SiO and CO gas phases involved:

Thus, the oxygen is regenerated and, as a whole, plays the role of a “mass-transfer species.”
A following side channel for SiC formation via Si3N4 intermediateReference Gao, Yang, Fan and An18 can also be taken into consideration. In the presence of nitrogen, the possible reactions involved are listed as following:


In fact, Busiakiewicz et al.Reference Busiakiewicz, Huczko, Dudziak, Puchalski, Kozłowski, Cichomski, Cudziło, Klusek and Olejniczak19 studied recently the defects of purified SiCNWs produced via scanning tunneling spectroscopy (SHS) by scanning tunneling microscope (STM) and STS techniques and pointed to the nitrogen doping in the wire’s sheath as a reason for the metallic behavior in the vicinity of NW’s deformation.
IV. CONCLUSIONS
In summary, mass quantities of pure SiCNWs were successfully and efficiently produced by fast, gas phase SHS process. The data points to SiCNWs growth by a self-catalytic VLS mechanism. The presence of oxygen in the reaction zone assists the NW growth by facilitating mass transport processes of gaseous reactants.
ACKNOWLEDGMENTS
This project is cofinanced by the European Regional Development Fund within the Innovative Economy Operational Programme 2007–2013 (under the project “Development of technology for a new generation of the hydrogen and hydrogen compounds sensor for applications in above normative conditions” No. UDA-POIG.01.03.01-14-071/08-06). A. Bachmatiuk thanks the Alexander von Humboldt Foundation and the Bundesministerium für Bildung und Forschung (BMBF). M.H. Rümmeli acknowledges the European Union (European Center for Emerging Materials and Processes) [EU (ECEMP)] and the Freistaat Sachsen.