Introduction
The elemental and isotopic zoning of minerals is related to their growth and the investigation of zoning patterns in minerals has been demonstrated as an extremely useful tool to reconstruct not only changes in the external parameters P and T during their growth, but also to obtain information about mass transfer processes within a mineral and on absolute time constraints using in situ isotopic age determination techniques (e.g. Kohn, Reference Kohn2014, and references therein). Information about the growth process is also preserved in the ‘realbau’ (real structure) of a crystal, i.e. its defect structure, such as point defects, screw and edge dislocations, and subgrain boundaries. These defects become visible in etched crystals, as dissolution acts preferentially on such defects. Freely grown crystals, either from the pegmatitic stage in open cavities, or from hydrothermal vein assemblages, provide an opportunity to study dissolution phenomena if they have well-developed faces. On the macroscopic to microscopic scale, these dissolution phenomena primarily manifest as etch pits (EP), offering indirect insights into their growth history, which have been studied extensively, particularly in material science (e.g. Sunagawa, Reference Sunagawa2005; Lu et al, Reference Lu, Jiang, Ma, Zhang, Fu and Fan2022).
Hydrothermal vein assemblages are a typical setting where beryl (Be3Al2[Si6O18]) occurs (Grew, Reference Grew2002). Its green gemstone variety, emerald, has been studied extensively (e.g. Groat et al., Reference Groat, Giuliani, Marschall and Turner2008), in part due to its pronounced zoning features. Etch pits (EP) as dissolution phenomena in beryl have been investigated to explore their feasibility as provenance indicators (Kurumathoor and Franz, Reference Kurumathoor and Franz2018; Franz et al., Reference Franz, Vyshnyevskyi, Khomenko, Lyckberg, Wiedenbeck and Gernert2023) and as a complementary tool to inclusion and composition studies (Saeseaw et al., Reference Saeseaw, Refro, Palke, Sun and McClure2019). Growth conditions in terms of pressure, temperature, fluid composition and time, can vary from locality to locality, as described by Scandale et al. (Reference Scandale, Lucchesi and Graziani1990) for pegmatitic beryl. Consequently, the shape and arrangement of EP can be characteristic for a specific locality.
We selected beryl crystals from Colombia for our investigation, sourced from vein assemblages in a low-grade metasedimentary sequence of black shales, limestones and evaporites where temperature–pressure conditions of formation did not exceed ∼300–350°C and 200–300 MPa (e.g. Pignatelli et al., Reference Pignatelli, Guiliani, Ohnenstetter, Agrosi, Mathieu, Morlot and Branquet2015, and references therein). The low temperature excludes significant re-equilibration by diffusion, making the EP and zoning patterns feasible indicators of the realbau. The freely grown crystals show no indications for subsequent deformation such as cracks or subgrain boundaries, and therefore no post-growth deformation modification of the zoning has occurred. According to the growth model for ‘trapiche emeralds’ (Pignatelli et al., Reference Pignatelli, Guiliani, Ohnenstetter, Agrosi, Mathieu, Morlot and Branquet2015), these crystals formed due to sudden opening of veins during faulting and folding associated with extensional vein sets and hydraulic breccias. The basinal brines from the black shales transported the trace elements Be, V and Cr, into the veins, which experienced a rapid pressure drop and a high oversaturation, possibly at near-peak metamorphic conditions.
Emerald samples were obtained from a mineral dealer in Bogotá, Colombia in 2014, however their exact sampling location remains unknown. Five crystals were examined in detail for this study. They exhibit both interior growth phenomena, i.e. compositional zoning of major and trace elements that are analysed by element-distribution maps, and characteristic surface features that are analysed by scanning electron microscopy (SEM). These observations demonstrate rapid growth at strong disequilibrium conditions, resulting in pronounced sector zoning with complex sector boundaries. They indicate changes in relative growth rates parallel to the a- and c-axis, which differ entirely from those predicted for Raleigh fractionation. Dissolution phenomena such as EP are minor, but distinct from those observed in pegmatitic beryl (Franz et al., Reference Franz, Vyshnyevskyi, Khomenko, Lyckberg, Wiedenbeck and Gernert2023).
Methods
A detailed description of the analytical methods applied is available in the deposited supplementary material at Franz et al. (Reference Franz, Schiperski, Khomenko, Gernert and Nissen2025).
Scanning electron microscopy (SEM)
Crystals were mounted on carbon tape, coated with a 16 nm thick carbon layer, and images were obtained using a Hitachi SU8030 cold-field emission SEM, equipped with a 30 mm2 silicon drift detector (SDD) Octane-A Plus from EDAX for energy dispersive analysis (EDS) analysis. Images were obtained with an SE(L) detector, for low magnification in the low magnification mode (LM), some in combination with a back-scattered electron (BSE) detector.
µ-X-ray fluorescence (µXRF)
After SEM imaging, the crystals were cut with a diamond-wire saw (wire diameter 60 µm), parallel to their c- and a-directions through the centre of the crystals, aiming to achieve optimal visibility of zoning in cross sections. Crystal #4 was obtained as a fragment and could only be lapped by hand to obtain a section parallel to [0001]– $\left[ {11\bar 20} \right]$. To minimise mechanical damage, the (0001) face was covered with epoxy resin before sawing. Crystals were then fully embedded in epoxy for surface polishing.
We used the µ-X-ray fluorescence energy dispersive spectrometer “M4 Tornado” (Bruker Nano GmbH) at the MAGMA Lab, TU Berlin, for generating element-distribution maps of the entire sectioned crystal for elements heavier than Na. Analyses were carried out in air. Steps were 20–50 µm (equivalent to pixel size of the map) and an exposure time for each step of 20–100 ms was applied. The instrument is equipped with a Rh anode and a microfocus X-ray tube with Be window, operated at 50 kV and 600 µA. Two 30 mm2 silicon-drift detectors allow for an energy resolution (for MnKα) of ≤145 eV.
Electron probe microanalysis (EPMA)
The JEOL JXA-8530F field emission microprobe at TU Berlin was used for quantitative analyses and element-distribution mapping. The sections were carbon-coated and analysed in wave-length dispersive mode for Na, K, Ca, Mg, Mn, Fe, Al, Sc, V, Cr, Ti and Si. Detection limits for trace and minor elements were (in ppm) Fe 170, Mn 200, Cr 200, V 200, Ti 160, K 80, Ca 100, Rb 4500, Cs 110 and Sc 55. Measuring conditions were 10 and 5 seconds measuring time on peak and background, respectively assuming a fixed BeO content of 13.16 wt.% for ZAF correction, at 15 kV/20 nA probe current. From each crystal at least two representative analyses from core and rim were obtained. Formulae were calculated on the basis of 18 oxygen and adjusting the BeO value to Be = 3.000 cations per formula unit (cpfu). Inclusions were characterised by energy-dispersive spectroscopy. BSE and secondary electron images (SEI) were obtained to gather information on inclusions and particularly on the trace of (0001) in cross section.
The whole-grain maps obtained by µXRF were used to select areas for more detailed EPMA mapping. Data for element-distribution maps in the wave-length dispersive mode of the microprobe were acquired using 15 kV, 20 nA probe current and 100 nA, with a beam diameter of 10 µm. Details about standards and measured X-ray lines are documented in the supplementary material. Mappings were performed in stage scan-modus with pixel resolution between 280–600 × 450–1000 (depending on the total scan area, which was in the order of 600 µm × 2100 µm), with a pixel size of generally 2.12 µm, and a dwell time per pixel of 100 ms. Data on background positions were not collected. Lateral and in-depth resolution was estimated by Monte-Carlo simulation as ∼3.5 µm and 2.5 µm, respectively.
Infrared-spectroscopy (IR)
For IR spectroscopy, the same mounts used for µXRF and EPMA were ground to an approximate thickness of < 30 µm from the reverse side, so that absorption in the region of fundamental vibrations (4000–1500 cm–1) of H2O and CO2 was sufficiently low to obtain spectra of high quality. A Bruker FTIR spectrometer IFS 66 equipped with an IR-microscope was used to obtain polarised spectra at room temperature in the spectral range 7000–1000 cm–1. Spectra were scanned with a measuring spot of 60 µm diameter, at a spectral resolution of 4 cm–1, and the time averaged signal was collected over 150–200 scans. The reference spectra were recorded in air.
Results
A complete set of all results –SEM images, EDX spectra, IR spectra and µXRF maps – is available in the supplementary material deposited under Franz et al. (Reference Franz, Schiperski, Khomenko, Gernert and Nissen2025).
Morphology of samples
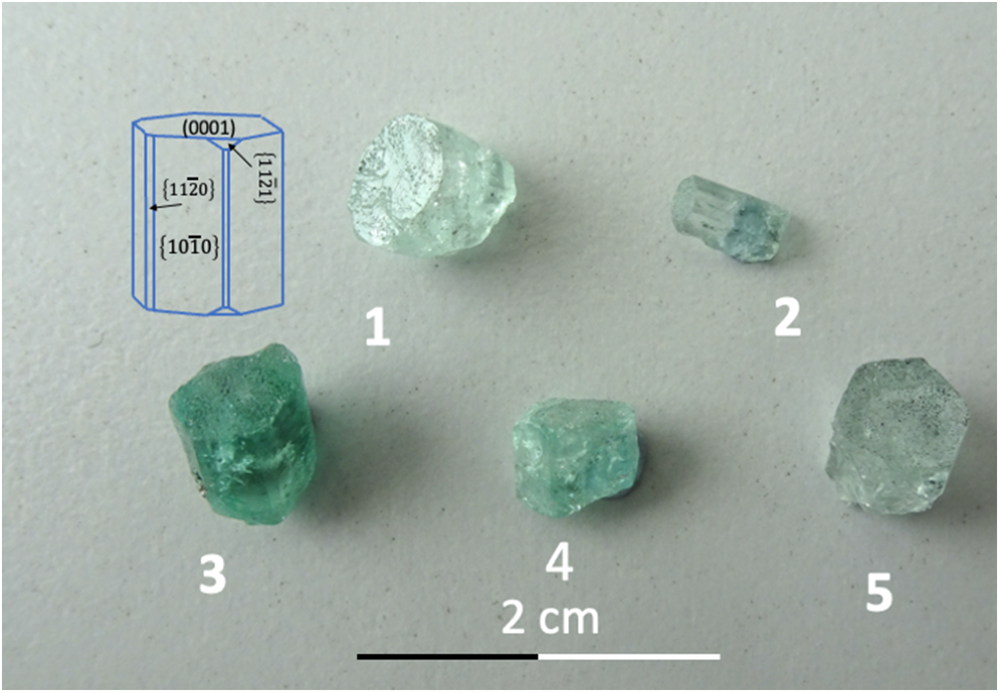
The five crystals (Fig. 1) show a well-developed (0001) face and first-order prisms 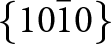 $\left\{ {10\bar 10} \right\}$ and also some smaller second-order prisms
 $\left\{ {11\bar 20} \right\}$. Indentations on (0001) can be seen with a hand lens. The crystals are short prismatic, with an aspect ratio near one; only crystal #2 is elongated along the c-axis (Table 1). The base of the crystals is irregular, and only crystal #3 shows a very small amount of the rock matrix on which it grew. Colour varies between light green and dark green, indicating variable amounts of chromophore substitution. Crystal #5 shows conical growth (resembling sceptre growth) on one side of the crystal.
Photograph of the crystals and crystal drawing; in addition to the major faces (0001) and first-order prism  $\left\{ {10\bar 10} \right\}$, some crystals also showed the second-order prism
 $\left\{ {11\bar 20} \right\}$; only crystal #4 showed the hexagonal di-pyramid
 $\left\{ {11\bar 21} \right\}$. None of the crystals showed the
 $\left( {000\bar 1} \right)$ face.

List of crystals, developed faces and approximate size

Composition
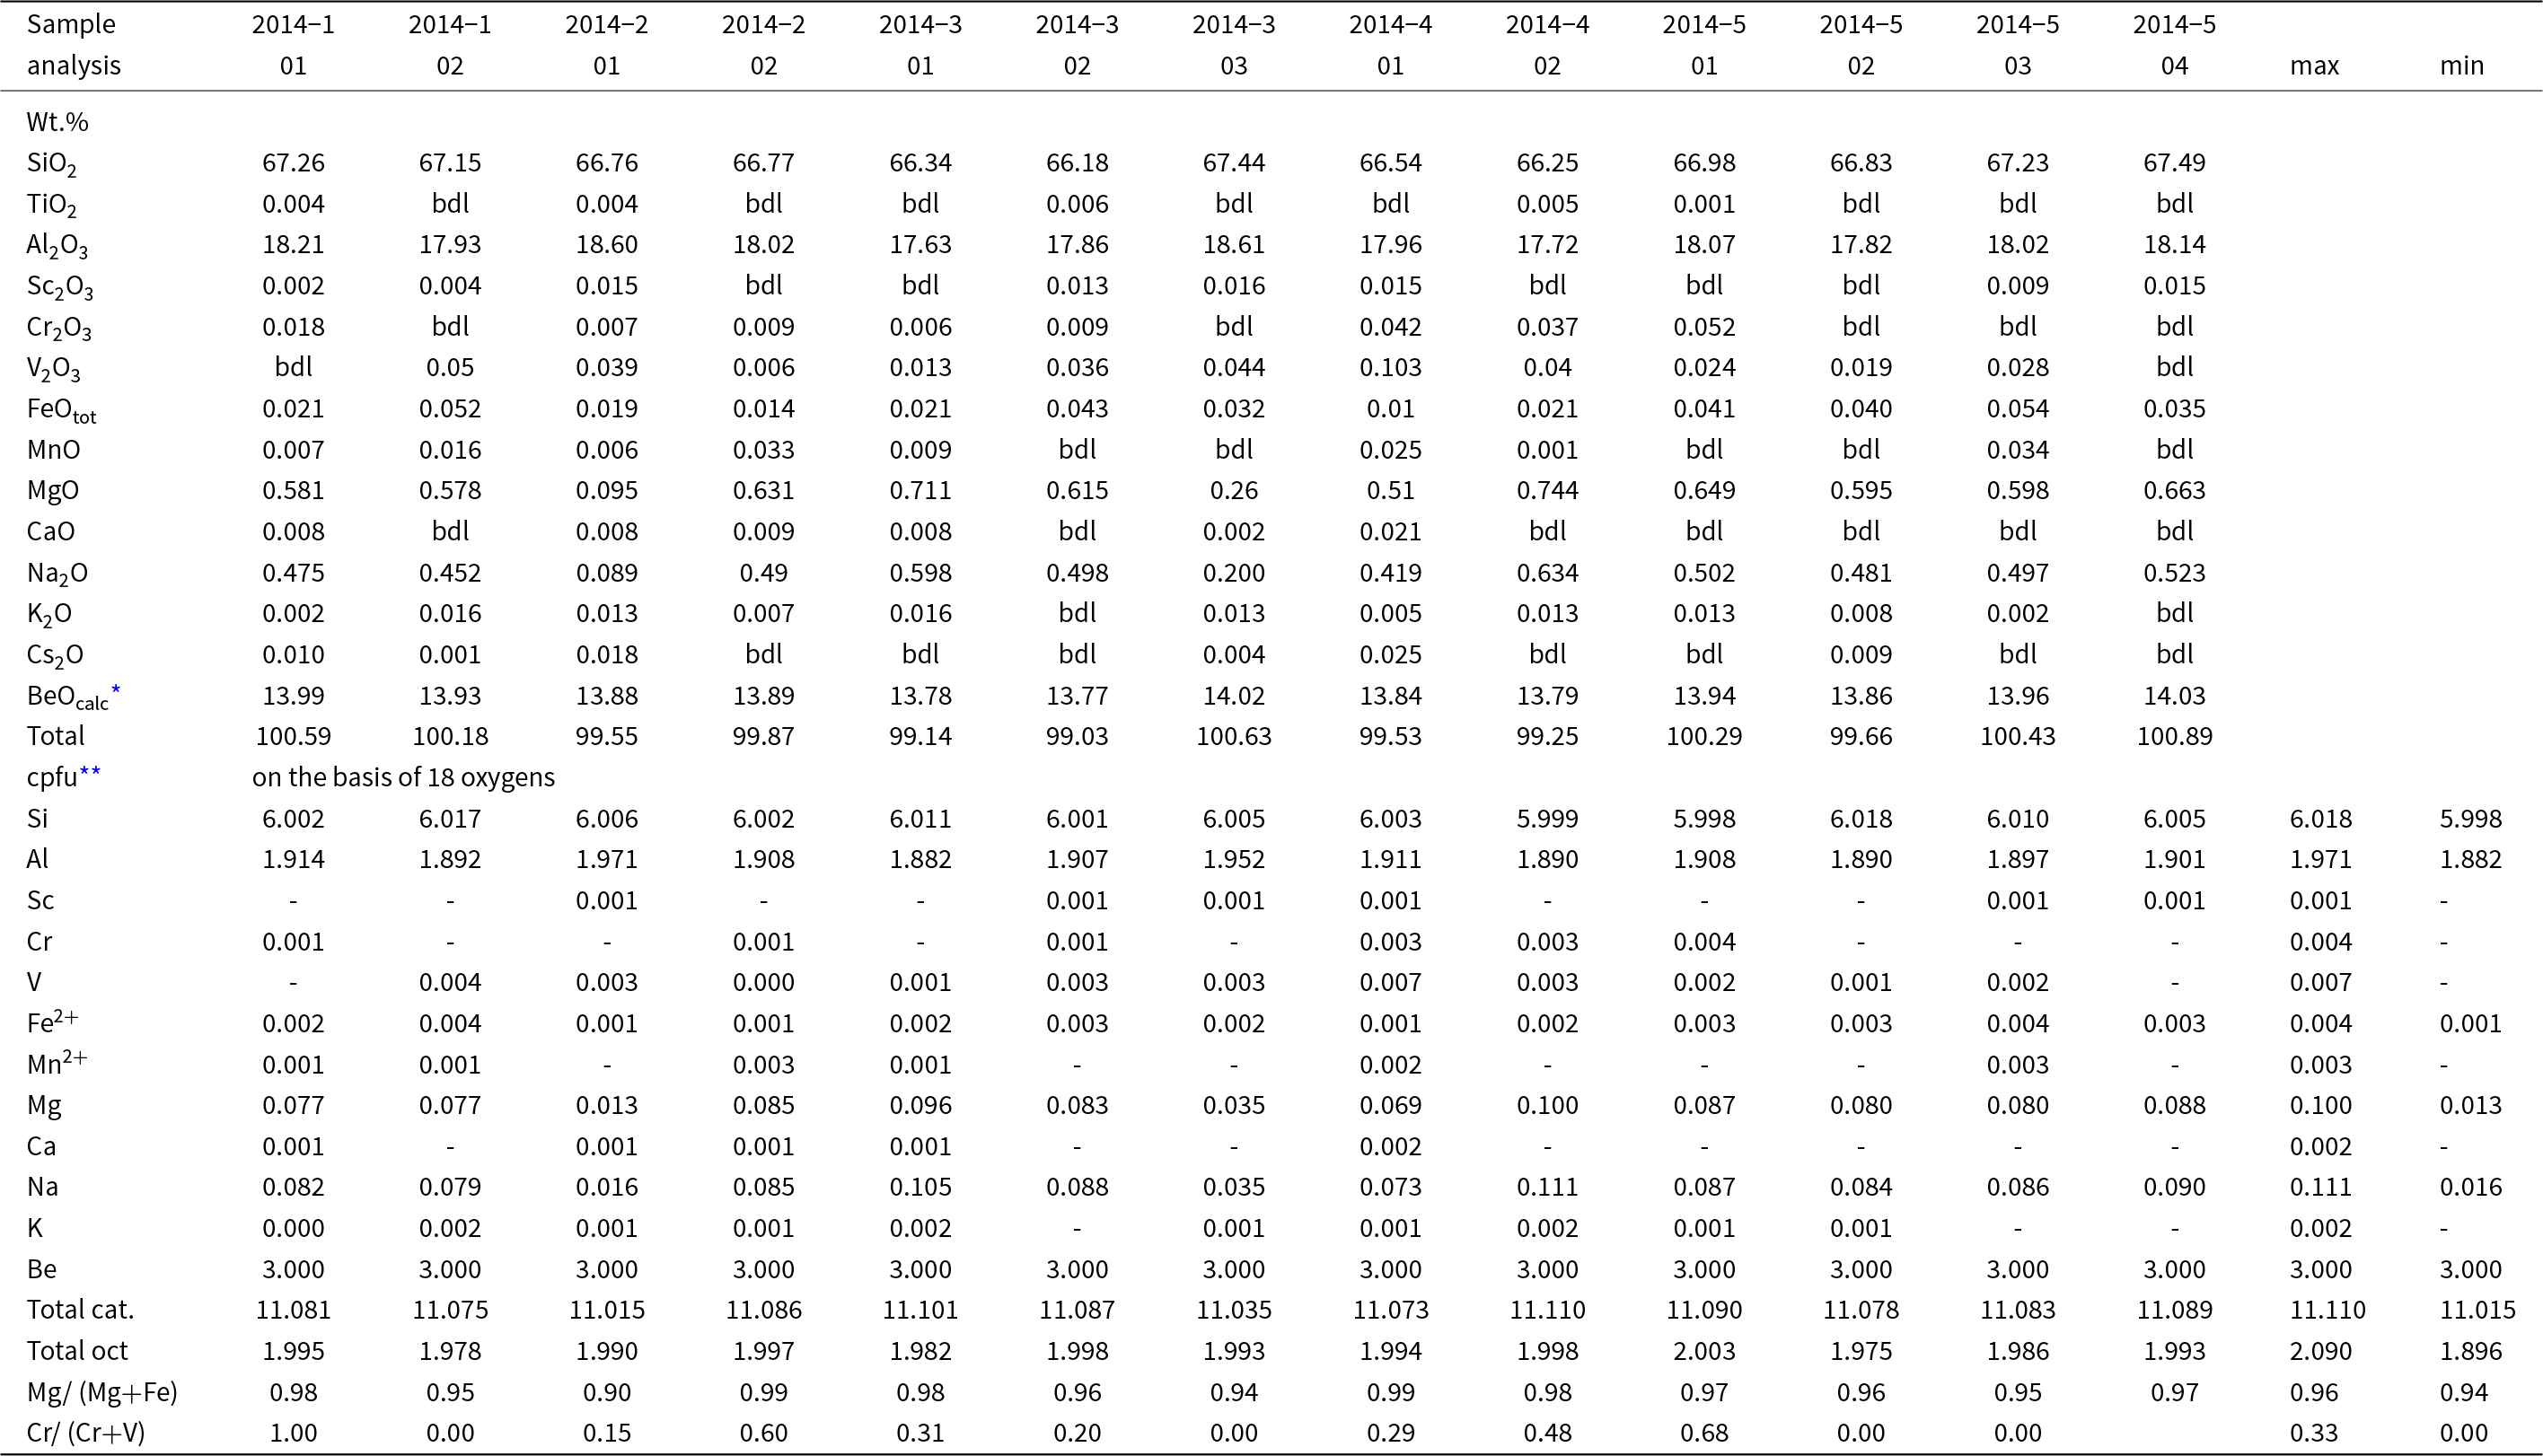
To characterise the beryl crystals, analyses by EPMA were obtained in representative areas, targeting to the largest difference seen in qualitative element-distribution maps (for the location of the analysis see the figure in the supplementary material). All analyses yielded a total between 99.03 and 100.89 wt.%, indicating only minor amounts of undetectable components such as H2O at the channel position (Table 2). Calculation of the water content, using the formula by Henry et al. (Reference Henry, Groat and Evans2022), yields an average value of 0.5 wt.% Na2O and 0.8 wt.% H2O. These data show a well-defined stoichiometry with a sum of octahedral cations between 1.896 and 2.090 cpfu (n = 13), Si(min) = 5.998 cpfu to Si(max) = 6.018 cpfu (calculated with the assumption that Be = 3.000 cpfu), indicating near-ideal composition and no or only very minor substitution at the tetrahedral positions. Only Na and Mg, as substituents at the octahedral and channel positions, respectively, and present in equal amounts (in cpfu), have concentrations above 0.10 wt.%. The difference in Al, Na and Mg between zones of maximum contrast is ≤1 wt.% Al2O3 (max. 0.07 Al cpfu), and ≤0.5 wt.% Na2O and MgO each. Vanadium and Cr, which result in the typical emerald colour (Schwarz and Schmetzer, Reference Schwarz and Schmetzer2002), are present in variable, but minor amounts of ≤0.05 wt.% (≤0.004 cpfu). Iron is minor, and the average Mg# = Mg/(Mg+Fe) is 0.96 and the average Cr# = Cr/(Cr+V) is 0.29, similar to the values reported in the overview for emeralds from Colombia (Franz et al., Reference Franz, Vyshnevskyi, Taran, Khomenko, Wiedenbeck, Schiperski and Nissen2020). Caesium, K and Fe contents are minor as reported for Colombian emeralds in the review about trace elements by Saeseaw et al, (Reference Saeseaw, Refro, Palke, Sun and McClure2019), in addition, because the dominant incorporation of Cs in beryl occurs via substitution with Li (Aurisicchio et al., Reference Aurisicchio, Fioravanti, Grubessi and Zanazzi1988), we infer that Li contents are also minor.
Composition (EPMA) of beryl crystals

Notes: bdl = below detection limit;
* calculated for Be = 3.000 cations per formula unit (cpfu);
** cations per formula unit with minor amounts of Ti and Cs ignored
Morphology of the faces
Face (0001)
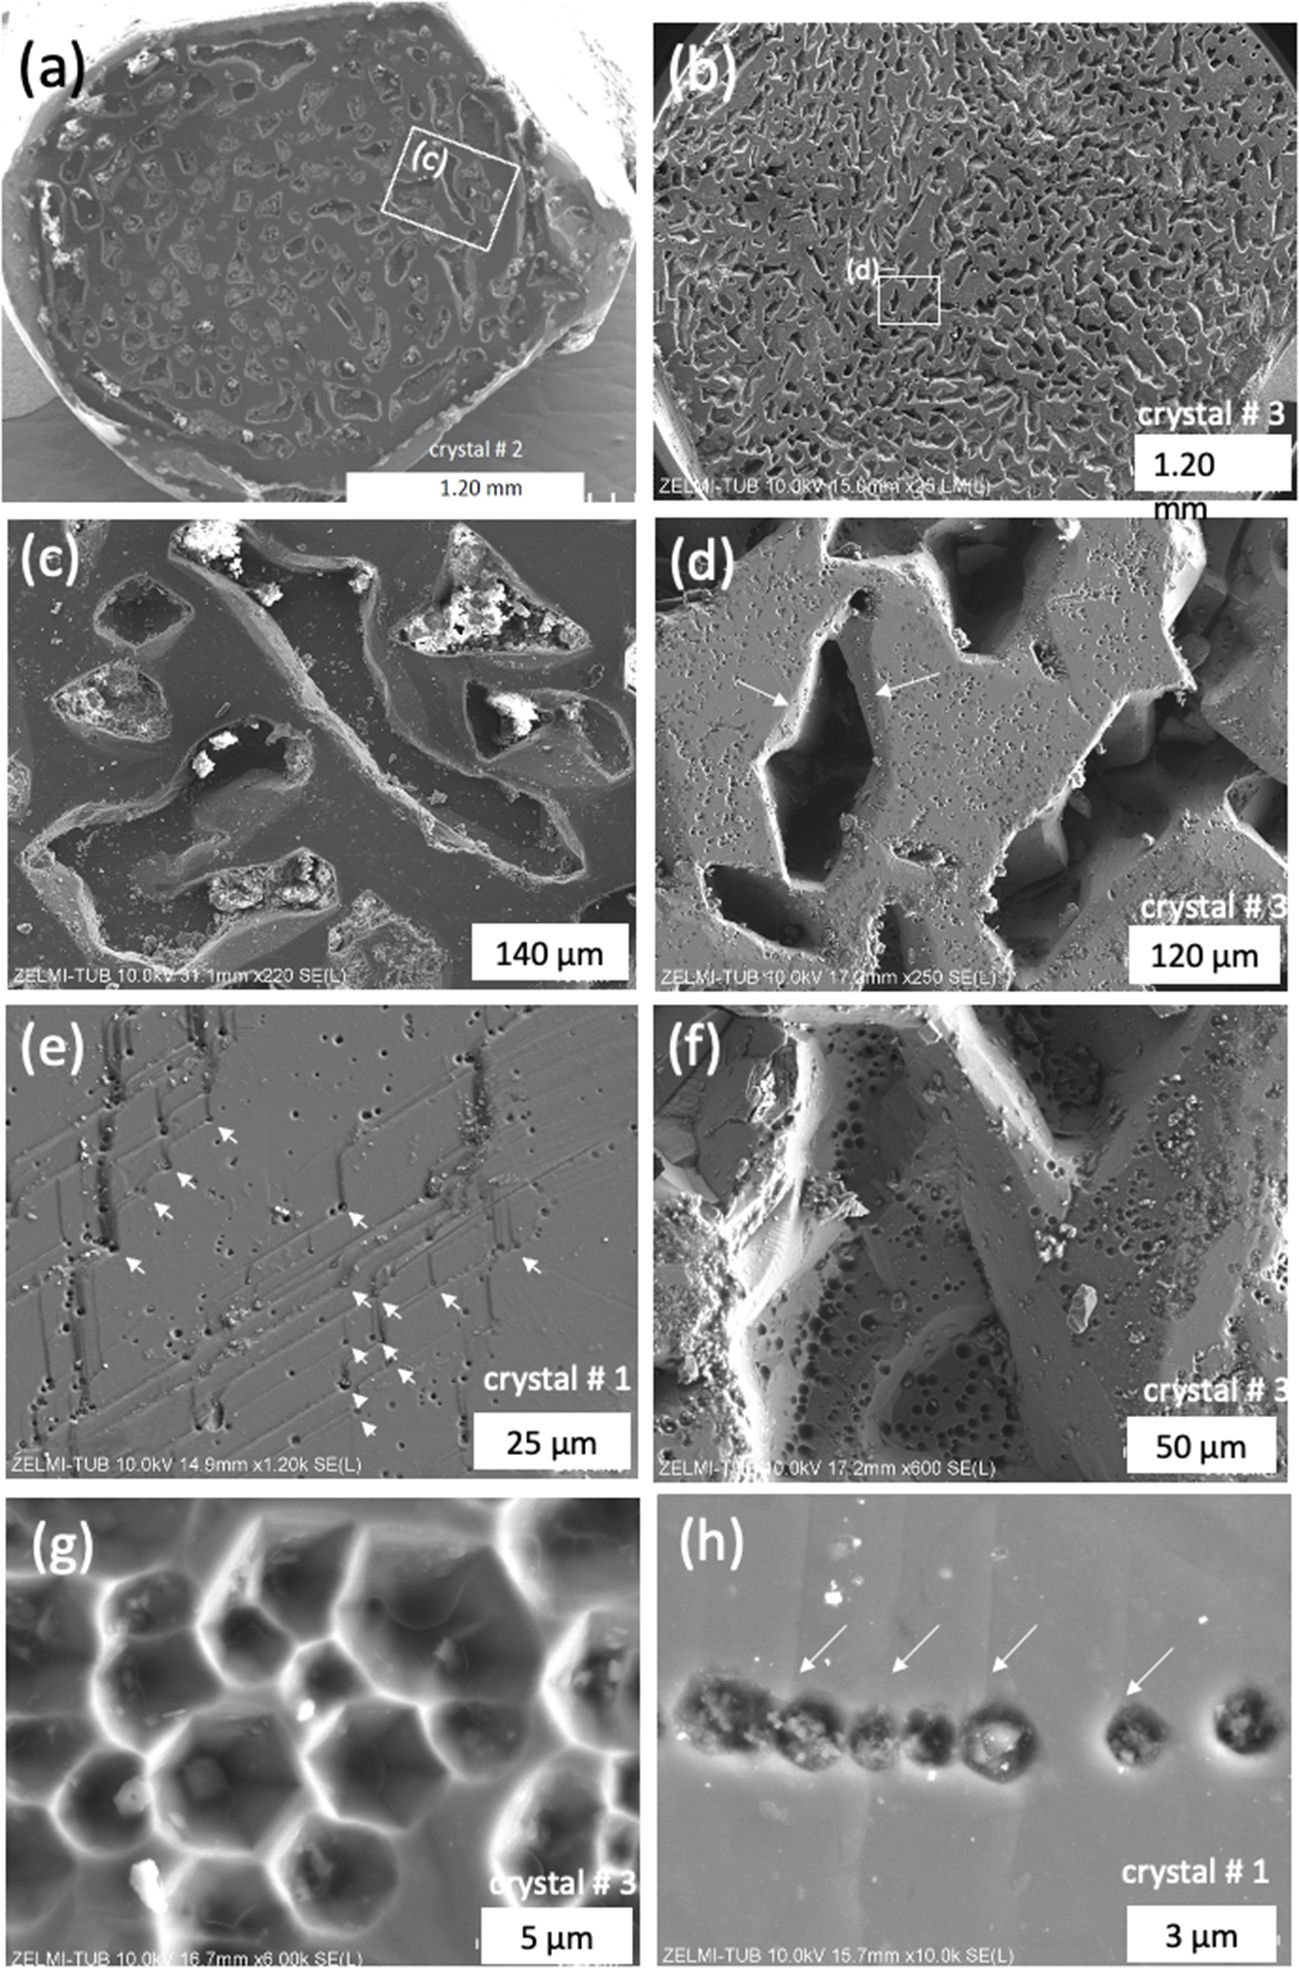
The SEM images of the (0001) faces of all crystals shows flat areas and irregular indentations (Fig. 2); the rim of the crystals is mostly complete. Indentations are of variable diameter (in the order of 40–300 µm) and depth (up to ∼100 µm). Most indentations do not follow the symmetry of the crystal and appear irregular (Fig. 2c). Closer inspection, however, reveals partially straight outlines (Fig. 2d), though a complete hexagonal shape is rarely observed. Many indentations are filled with crystals, or the bottom of these indentations are lined with various minerals, which were identified by EDS as dolomite, halite, ZnS, Na–Ca–Mg–Al-silicates, and organic matter (OM, with some N and S); identification was challenging due to charge accumulation in the deeper cavities. Indentations show steeply inclined, wedge-shaped faces inwards (arrows, Fig. 2d), or vertical, negative prism faces, and then a flat bottom.
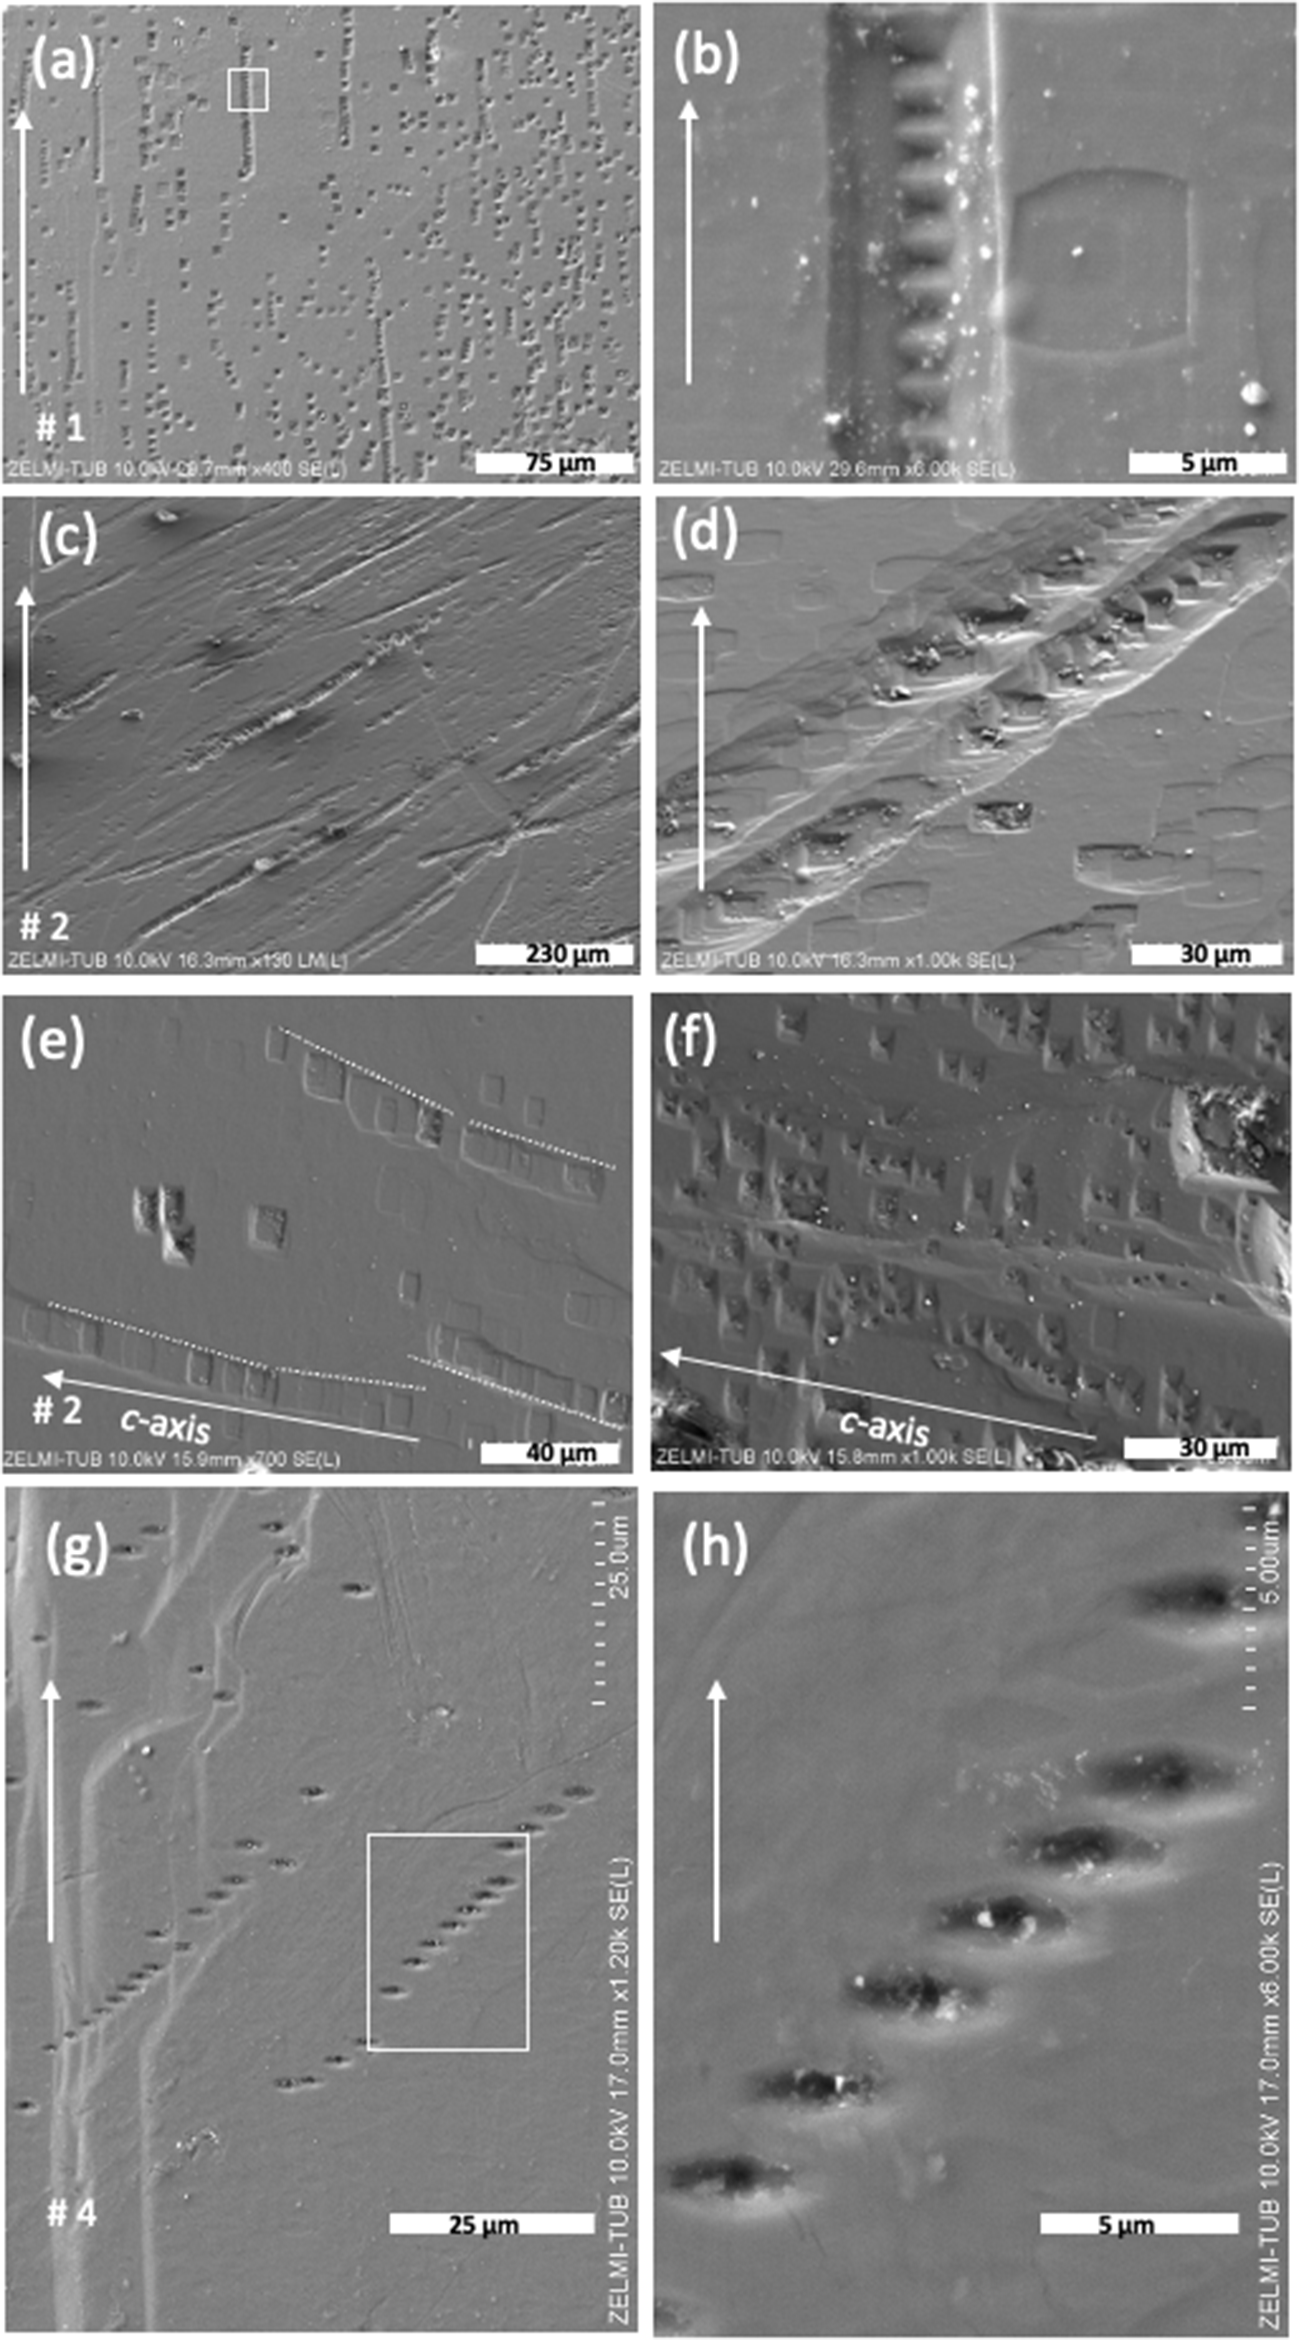
SEM images, with SE(L) detector, (a) and (b) in LM(L) mode of (0001) for crystals #1, 2, and 3. (a, b) Overview, illustrating the irregular shape of indentations. White rectangles indicate position of details in (c, d). (c) Indentations partly show a flat bottom, some are filled with minerals. (d) Indentations show small faces, pointing inwards (arrows). (e) Growth steps on (0001) with a 120° angle, which are decorated with EP (arrows). EP also occur on the flat parts and (f) within the large indentations. (g) EP with the characteristic hexagonal outline which can also be (h) aligned in chains. Arrows point to growth steps.

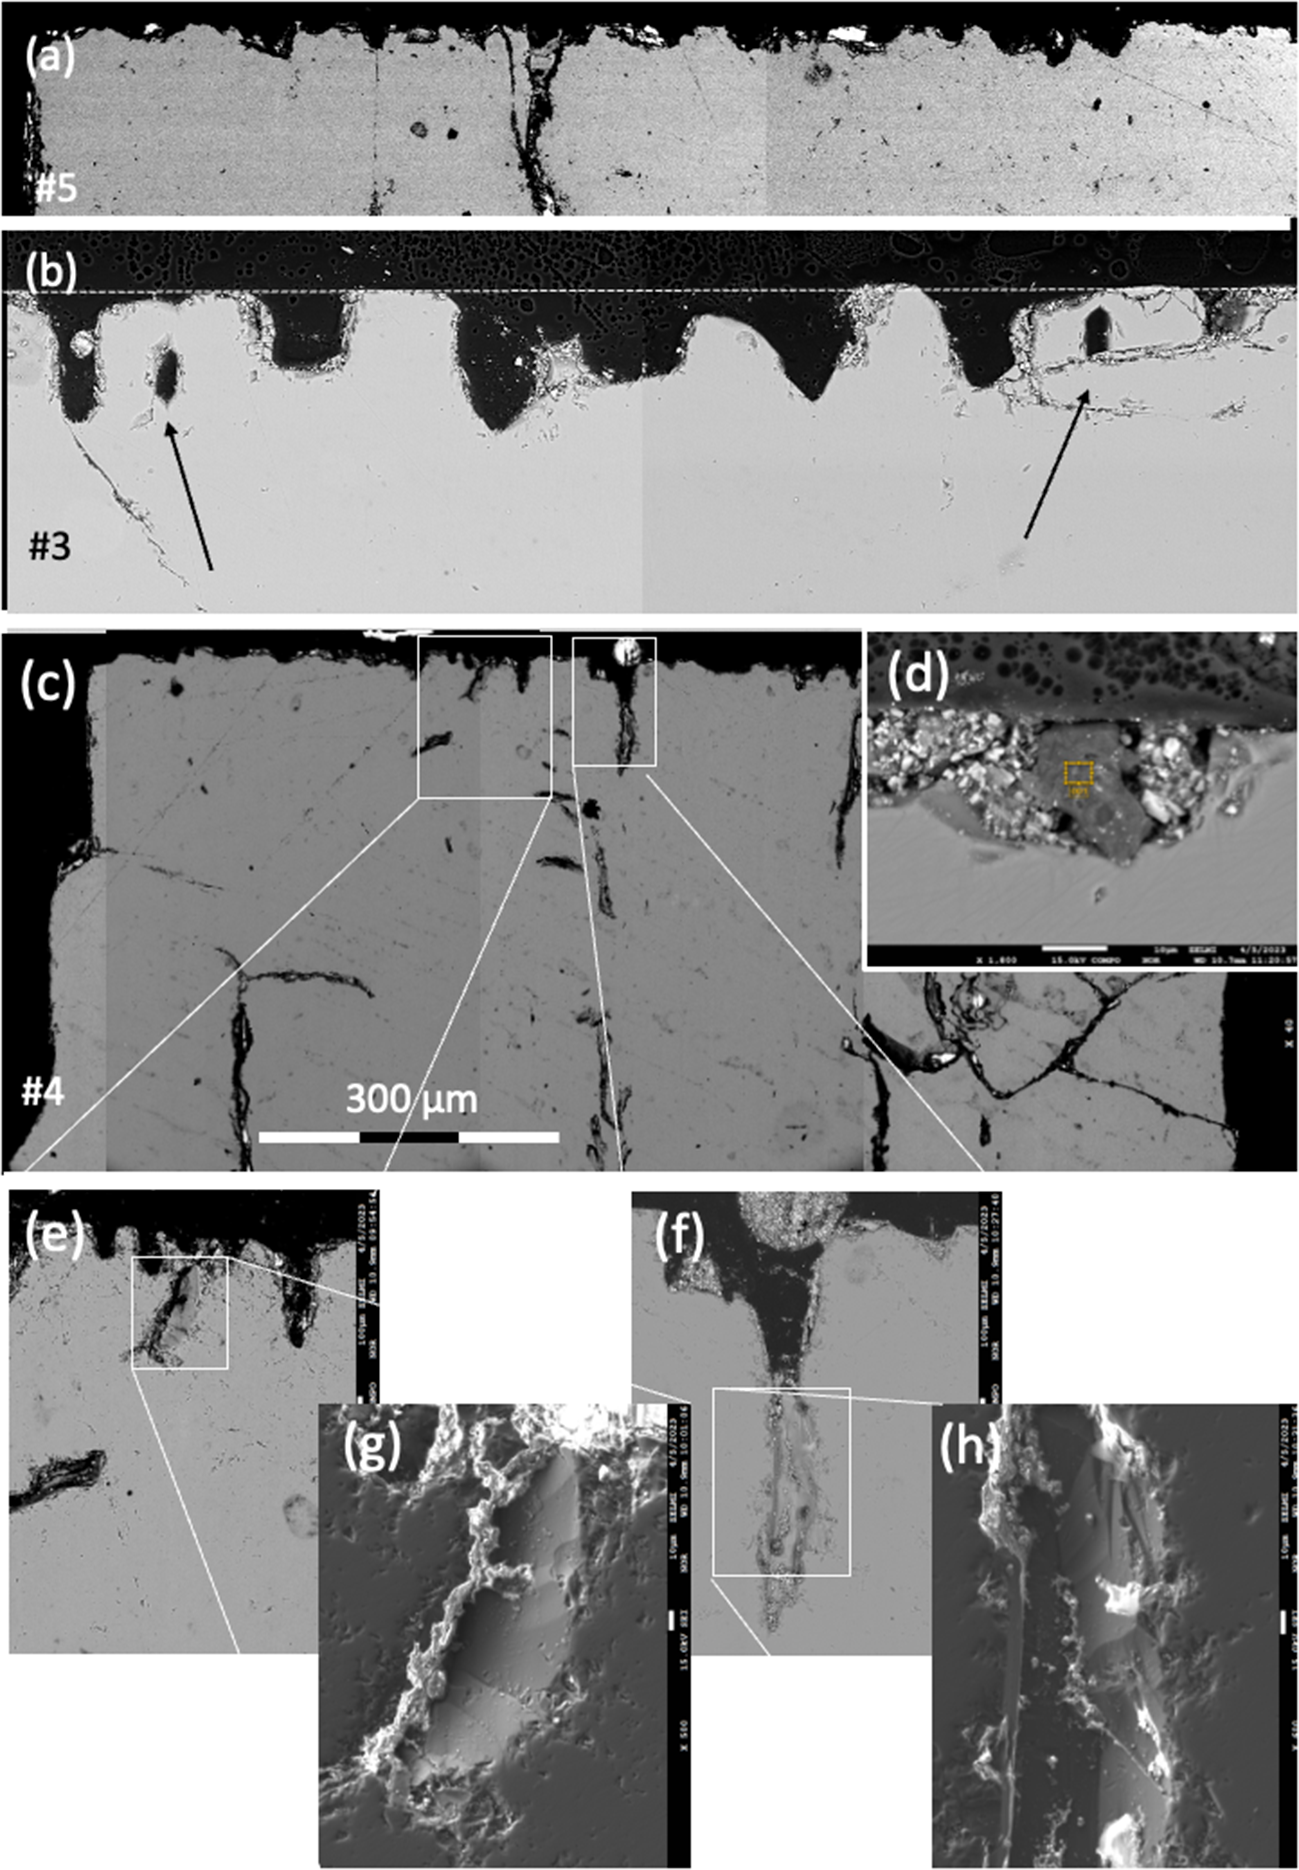
The shape of the indentations is also visible in BSE images of thin sections cut parallel to the c- and a-axes of the beryls (Fig. 3). The surface is irregular (Fig. 3a) or has approximately uniform height (Fig. 3b); indentations can have a flat bottom or terminate at obliquely orientated faces (Fig. 3e–h). They can extend into the interior, where voids, appearing as crack-like features, can also be observed (Fig. 3c).
BSE images of the upper part of crystals #3, 4 and 5 with the c-axis orientated vertically and the a-axis horizontally. (a) The trace of (0001) is irregular; (b) and has approximately the same height (dotted line); indentations can have a flat bottom or end on obliquely orientated faces; arrows point to cavities, which are closed in the upper part. (c) Indentations can continue into the interior, where crack-like features can also be seen. (d) Indentations are partly filled with crystals (white contrast) and with organic matter (centre, dark contrast, yellow frame). (e, f) Details of indentations, with corresponding secondary electron images (SEI detector) (g, h), showing oblique faces extending into the crystal.

The flat and smooth appearing surface of (0001) shows multiple growth steps with the characteristic 120° angle for hexagonal symmetry. Step height is variable, with single steps of <1 µm estimated from the images (Figs 2e, h). At the apex of the inner 120° angle an EP is observed, whereas no EP is present at the outer 120° angle of the growth steps (Fig. 2e).
The EP are 1–2 µm in diameter (Fig. 2g,h) and are distributed irregularly on the flat (0001) surface (Fig. 2c,d) or aligned (Fig. 2h) and are also seen on the inclined inward faces of large indentations (Figs 2d,f). The EP are P-type (with a pointed bottom) with a star-shaped pattern (Fig. 2g) at the bottom, which is not clearly visible in EP with steeply inclined faces. The round appearing EP have only poorly developed hexagonal outlines in many examples (Fig. 2h).
Prism faces
The SEM images of  $\left\{ {10\bar 10} \right\}$ faces (Fig. 4) show isolated EP and EP chains; chains are of different length with just a few EP or up to several tens of EP (Fig. 4a). The chains are orientated parallel to c, but there are also slight deviations ≤6° from c. The close and regular spacing of 1.5–2 µm between individual EP in chains is characteristic, coalescing to an etching channel (Fig. 4b). The EP are both P-type and F-type (with a flat bottom) (Fig. 4c). EP chains can also be orientated obliquely to the c-axis in various angles. These EP are predominantly F-type and also occur as isolated etch pits (Fig. 4d). On a different
 $\left\{ {10\bar 10} \right\}$ face of the same crystal (crystal #2 Fig. 4e,f), the angle of three EP chains towards the c-axis varies from a few degrees to strongly oblique. In one case, EP chains that were crossing the border towards the second order prism (Fig. 4g) with growth steps were observed. Some of the EP are strongly elongated parallel to the crystals a-axis, and with a pointed bottom (Fig. 4h).
SEM images with SE(L) detector of a first-order prism  $\left\{ {10\bar 10} \right\}$; the c-axis is orientated parallel to the white arrow. (a) EP are aligned in chains of different lengths, but isolated EP also occur. The chains are orientated parallel to c, but of note, there are also deviations from c. A white rectangle shows the position of (b), close and regular spacing between individual EP, coalescing to an etching channel. (c) EP chains, orientated oblique to c in various angles. (d) Detail of the same face of two parallel orientated chains, strongly oblique to c; EP are dominantly F-type and also occur in isolation. (e) F-type EP chain on a different
 $\left\{ {10\bar 10} \right\}$ face of the same crystal # 2; variable orientation of the chains is indicated by dotted lines. (f) Irregularly orientated chains of P-type EP. (g) EP chains, crossing the border to the second order prism with growth steps (left part of the image between labels ‘g’ and ‘# 4ʹ; white rectangle indicates position of (h), showing EP significantly elongated parallel to the a-axis, and with a pointed bottom.

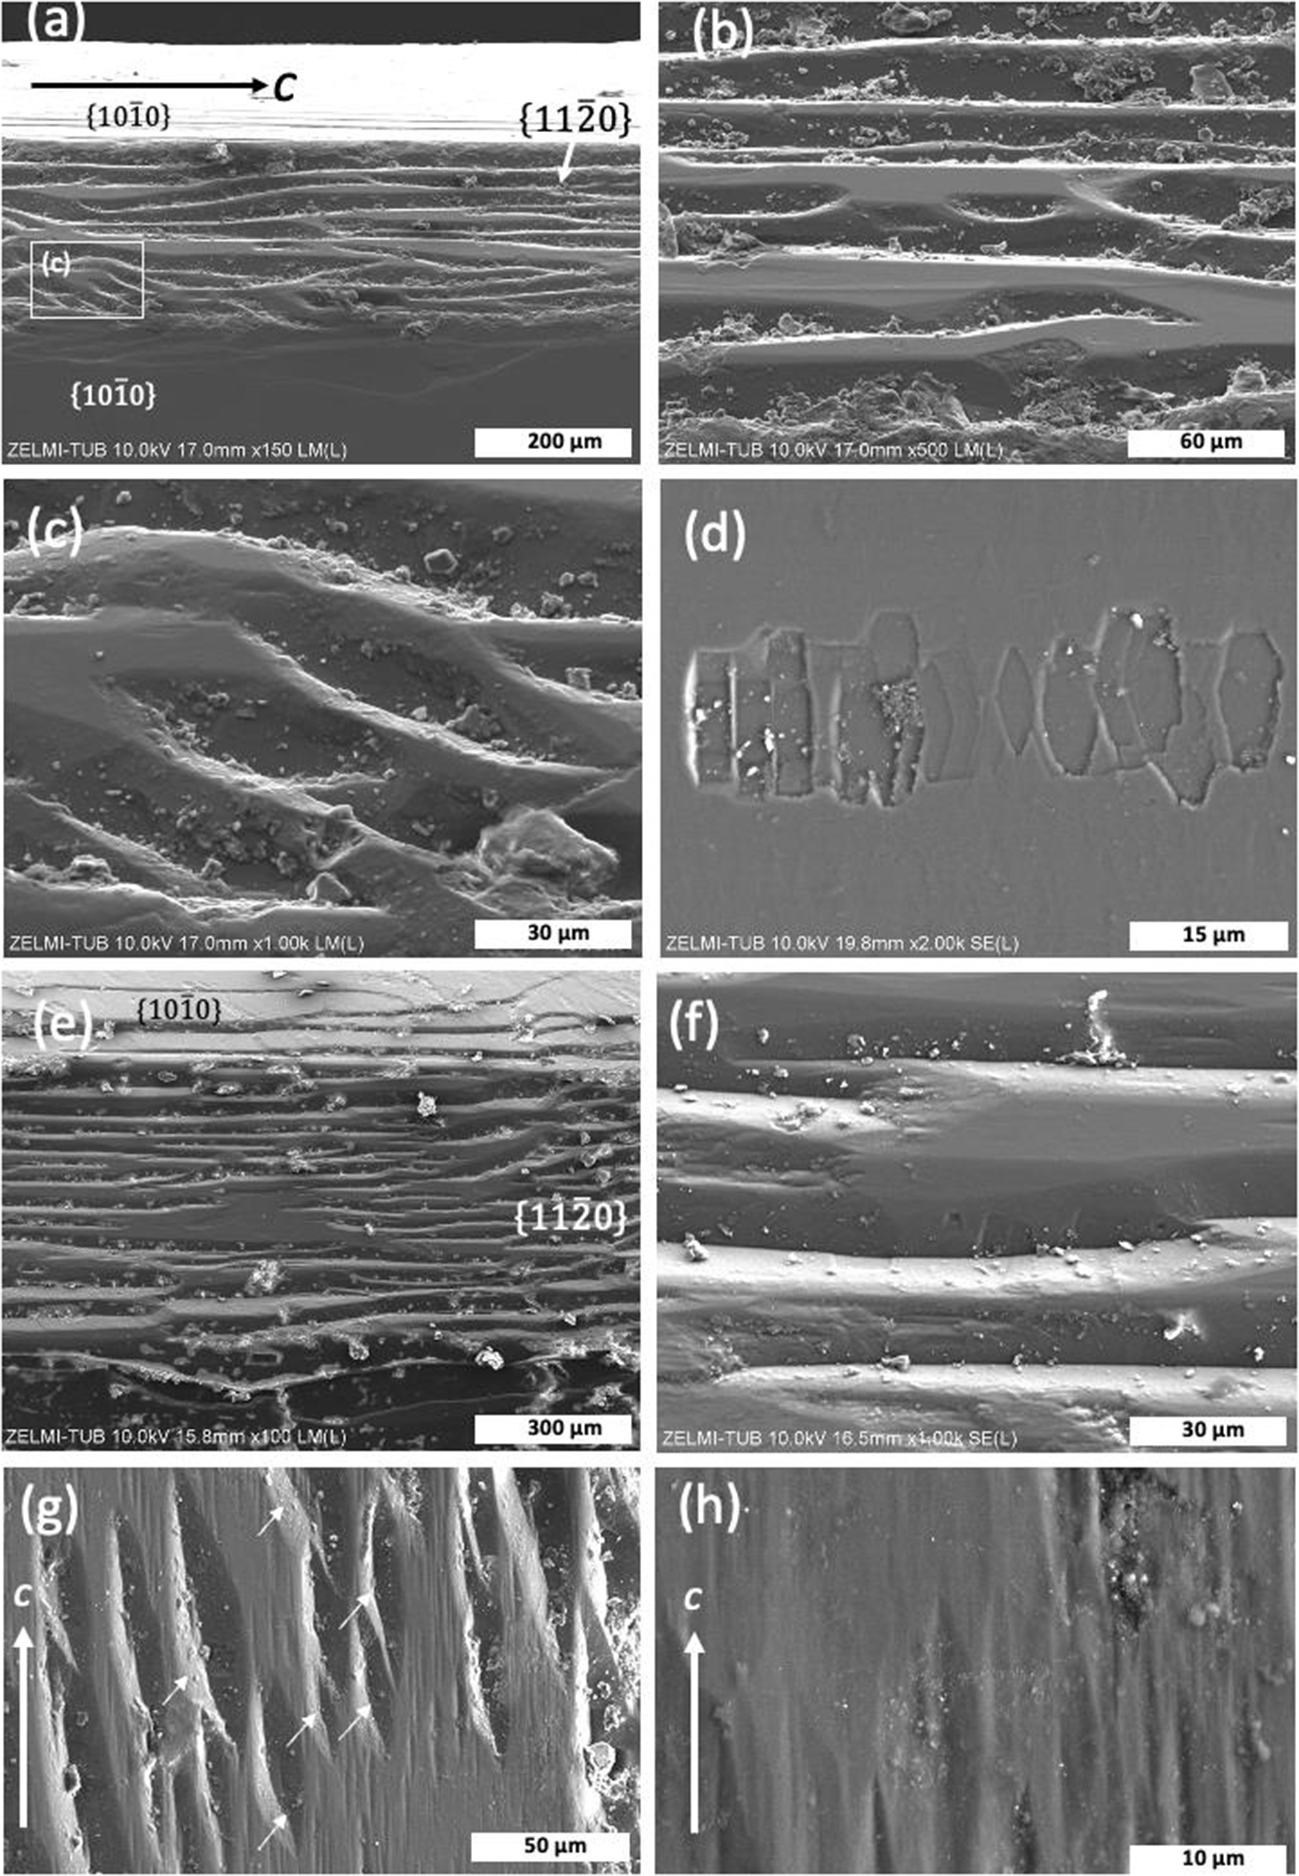
The second-order prism  $\left\{ {11\bar 20} \right\}$ is developed in three of the crystals investigated (Fig. 5). The faces are much smaller than the first-order prisms, are not present on each side of a crystal, and they show a completely different morphology compared to the first-order prisms. Etch pits are absent or rare; instead, the faces are characterised by what we interpret as growth structures. These structures are wedge-shaped, anastomosing grooves, which extend over several hundreds of µm, subparallel to the c-axis (Fig. 5b,e,f), and can have a flat bottom (Fig. 5c). The grooves are created by curved growth steps on the adjacent first-order prisms. Within these grooves, small asymmetric F-type EP are found only rarely (Fig. 5d), arranged in a chain subparallel to the grooves. The wedge-shaped features are orientated in the same direction (Fig. 5g). On the flat area, there are ∼10 µm wide grooves, elongated parallel to the c-axis (Fig. 5h).
SEM images of a second-order prism  $\left\{ {11\bar 20} \right\}$. (a) The second-order prism occurs between two first-order prisms above and below (c-axis is orientated horizontally). The face consists of flat areas and anastomosing wedge-shaped features, shown enlarged in (b). The white rectangle indicates the position of (c), illustrating the subparallel orientated wedge-shaped features. (d) Detail of a flat part of the second-order prism with a chain of F-type EP, elongated in the direction of the a-axis. (e, f) Second-order prism of crystal #4, showing similar features as in crystal #2. (g) Second-order prism of crystal #1 (c-axis orientated vertically), showing the wedge-shaped features with similar orientation (arrows). (h) Detail of (g), showing a flat area with ∼10 µm wide grooves, elongated parallel to c. (e) and (f) with SE(L) detector, all others in LM(L) mode.

Conical growth
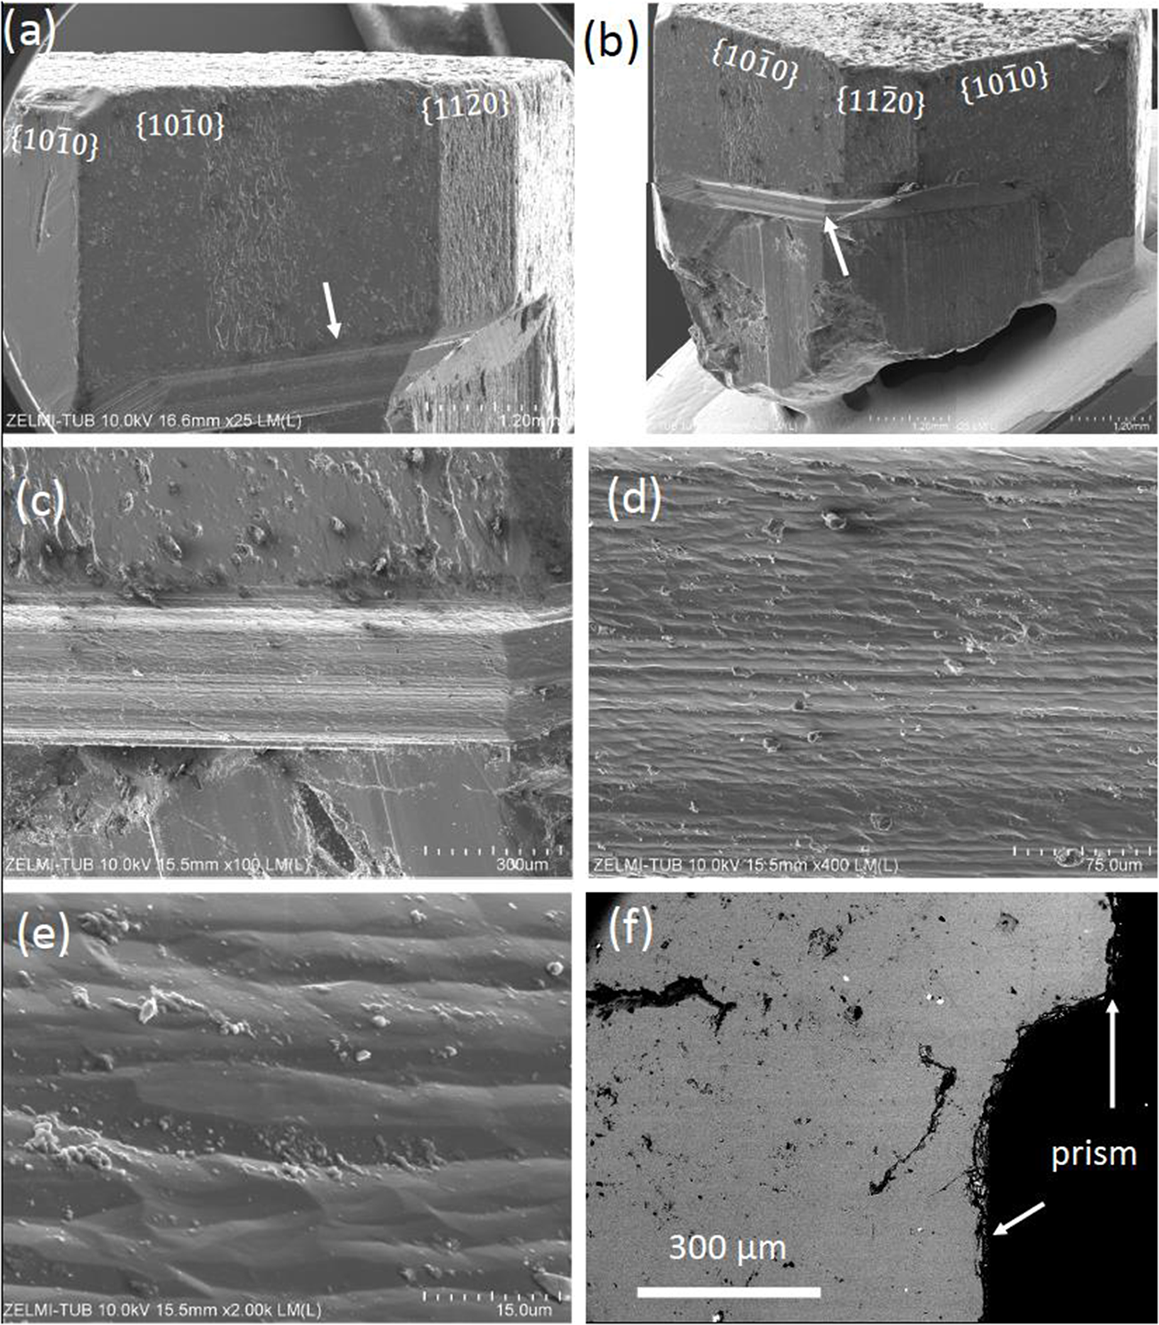
Crystal #5 shows conical growth on one side of the crystal (Fig. 6a,b), ∼200 µm wide and characterised by horizontal stripes. Closer inspection shows that the stripes are undulating ridges and valleys, subparallel to the a-axis (Fig. 6c,d); they are ∼10 to 20 µm wide (Fig. 6e). In cross-section, the transition from the lower part of the first-order prism to the upper part is marked by a smooth, continuous curvature (Fig. 6f).
SEM images (LM(L) mode) of crystal #5 (a-e), and BSE image (f) illustrating conical growth. (a, b) Overview of the crystal with first- and second-order prisms and conical area (arrow). (c, d) Striped surface of the transition from the lower to the upper part of the prism face. (e) Detail, showing undulating ridges and valleys. (f) Cross section, showing a smooth curvature at the transition.

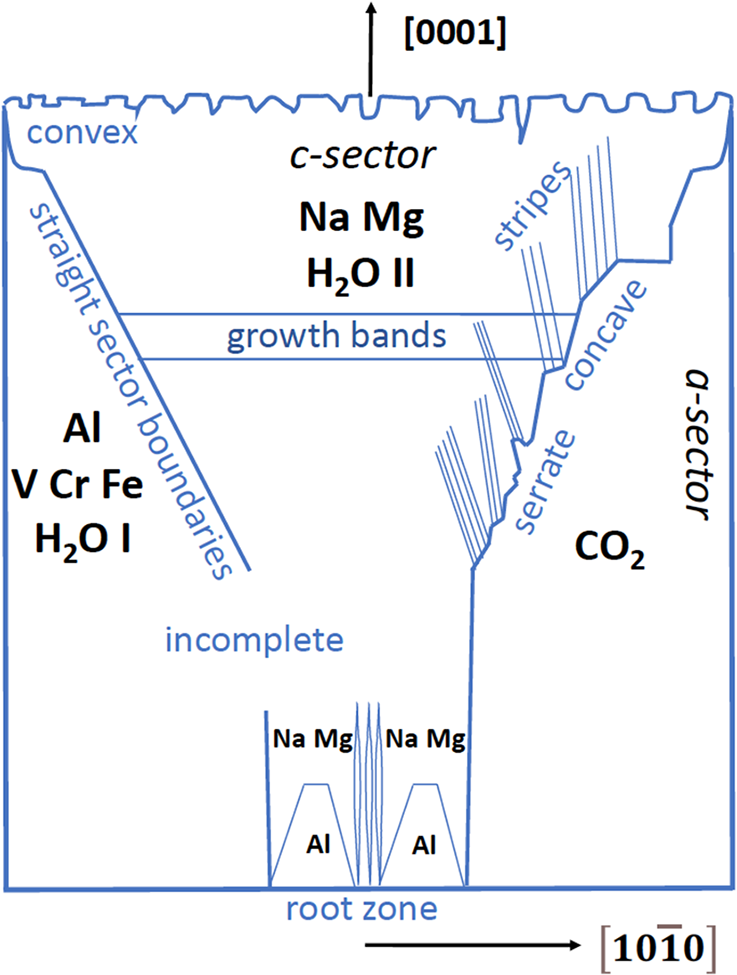
Schematic zoning patterns and summary of results for Colombian beryls, in cross sections parallel to the [1000] and  $\left[ {10\bar 10} \right]$ directions on the crystal. Crystals grew onto a substrate from a root zone in one direction. Sector boundaries can be straight, convex/concave curved, or serrate, and sectors can be incomplete. The c-sectors show zones called growth bands. The a-sectors are enriched in V, Cr, Fe and H2O I and CO2, the c-sectors in Na, Mg (arranged in stripes) and H2O II. The root zone shows enrichment of Al in hillocks and stripes, which disappear with further growth in [1000].

Interior features – chemical zoning
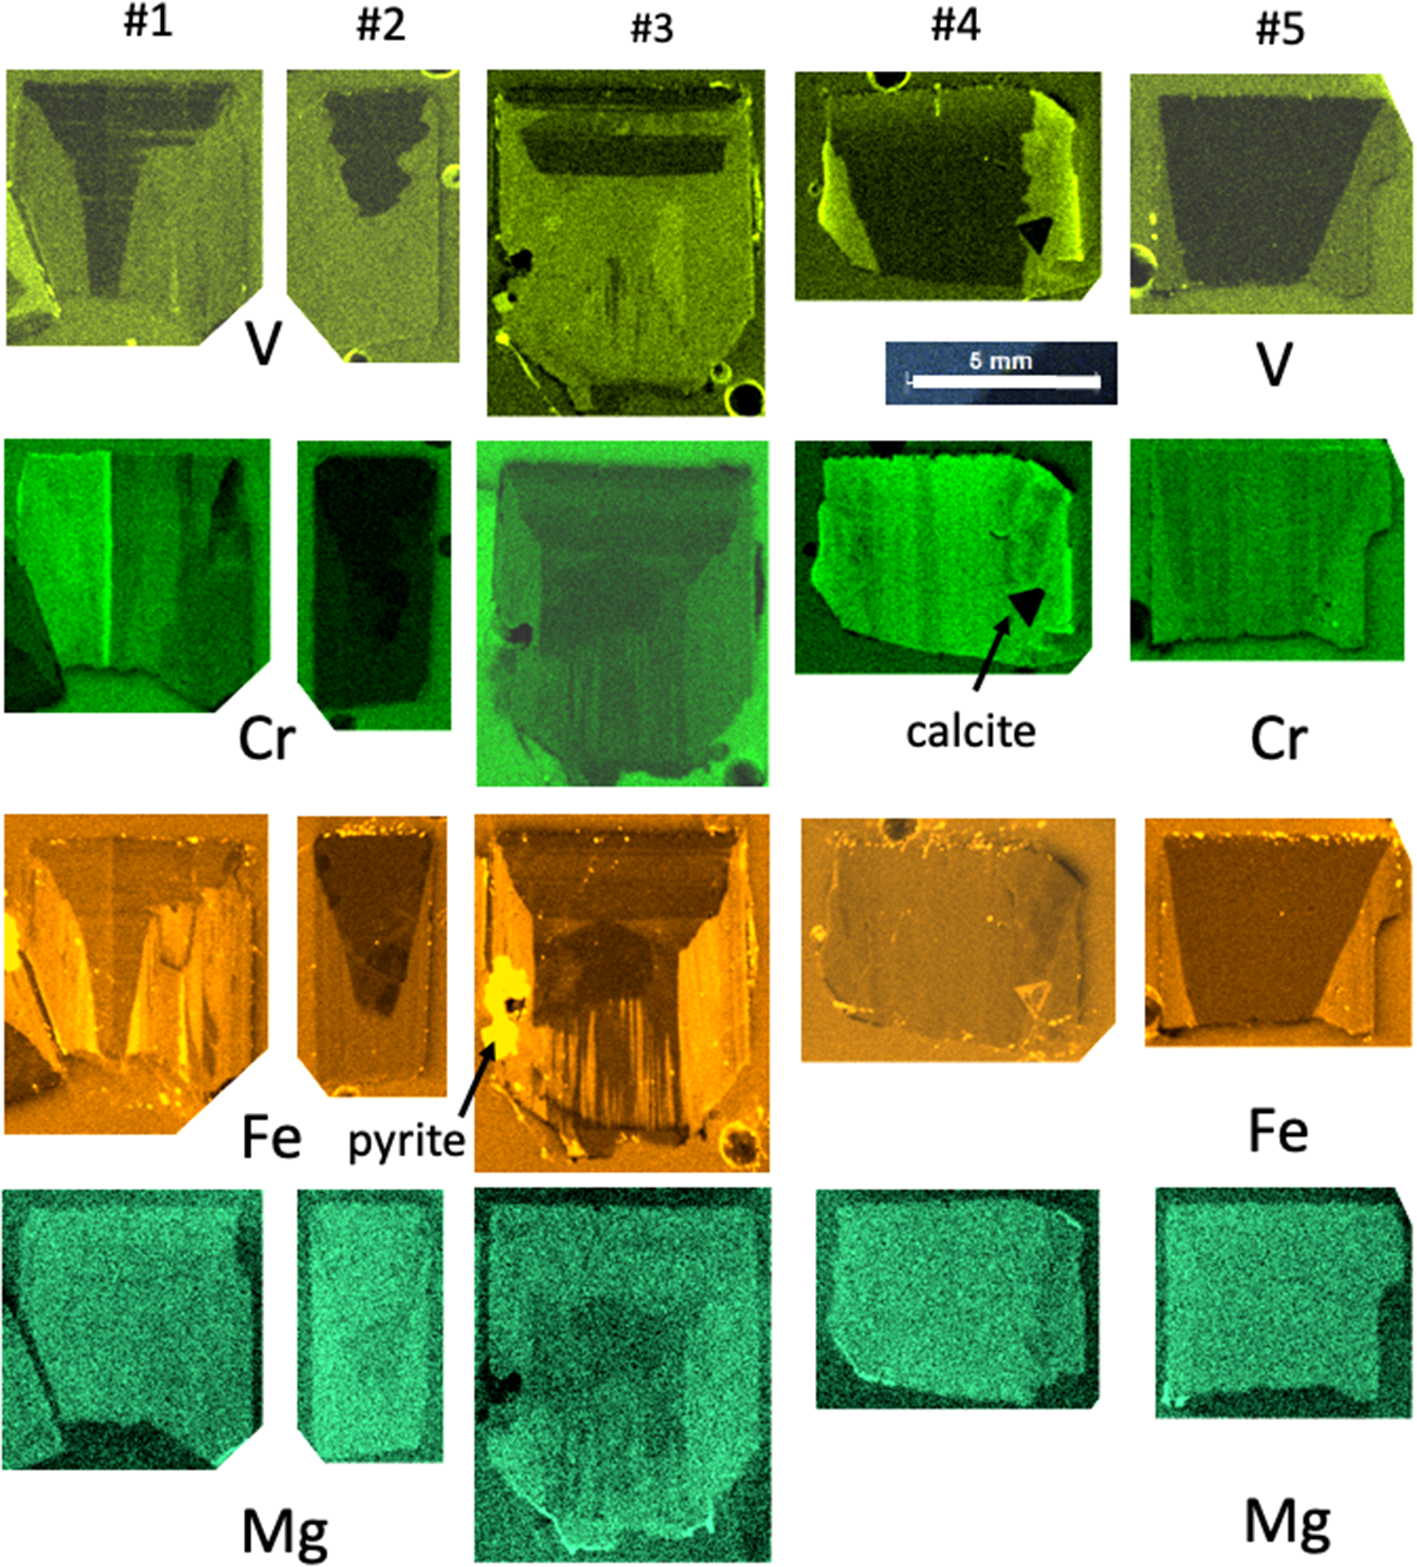
All crystals exhibit sector zoning with c- and a-sectors (or pinacoid- and prism sectors), and the different phenomena of the sector zoning are depicted schematically in Fig. 7. Zoning was investigated with µXRF element-distribution maps (Fig. 8). They are semi-quantitative only, and due to the varying fluorescence yield of elements, no direct information on absolute amounts can be obtained. We distinguish between straight and curved (convex/concave) sector boundaries, and within sectors, we observed stripes parallel and oblique to the c-axis and growth bands parallel to the a-axis. The sector boundaries can be irregular, here described as serrate. On the basis of the sector zoning with lesser truncation of the c-sector, it can be inferred that crystals #1, 2 and 3 are the most complete. Crystal #5 shows a small conical growth (similar to a sceptre) on one side of the crystal.
Element distributions for V, Cr, Fe and Mg, determined by µXRF. All crystals show sector zoning. A root zone is seen in crystal #3. Crystals #3 and 4 contain large inclusions of pyrite (#3) and calcite (#4). Stripes with apparent elemental variation parallel to the c-axis result from orientation-dependent diffraction, falsely quantified by the µXRF software as changes in elemental concentration. For detailed description see text.

In all crystals, the c-sector is enriched in Na and Mg (Fig. 9), whereas the a-sector is enriched in Al, V, Fe and Cr. Sector boundaries as they show up for different elements are straight for V and Fe in crystal #5, concave in crystal #1, convex for Cr in crystal #3, serrate and incomplete for V in crystal #3, but straight and extending further towards the root zone in this crystal. Growth bands are only seen for V and Fe in the c-sectors. Crystal #4 (the most intensely coloured crystal) shows the strongest V-intensities in the outermost rim of the a-sector, parallel with Cr. Stripes with relative enrichment/depletion of elements parallel to the crystal’s c-axis are an artefact of X-ray diffraction in µXRF spectra.
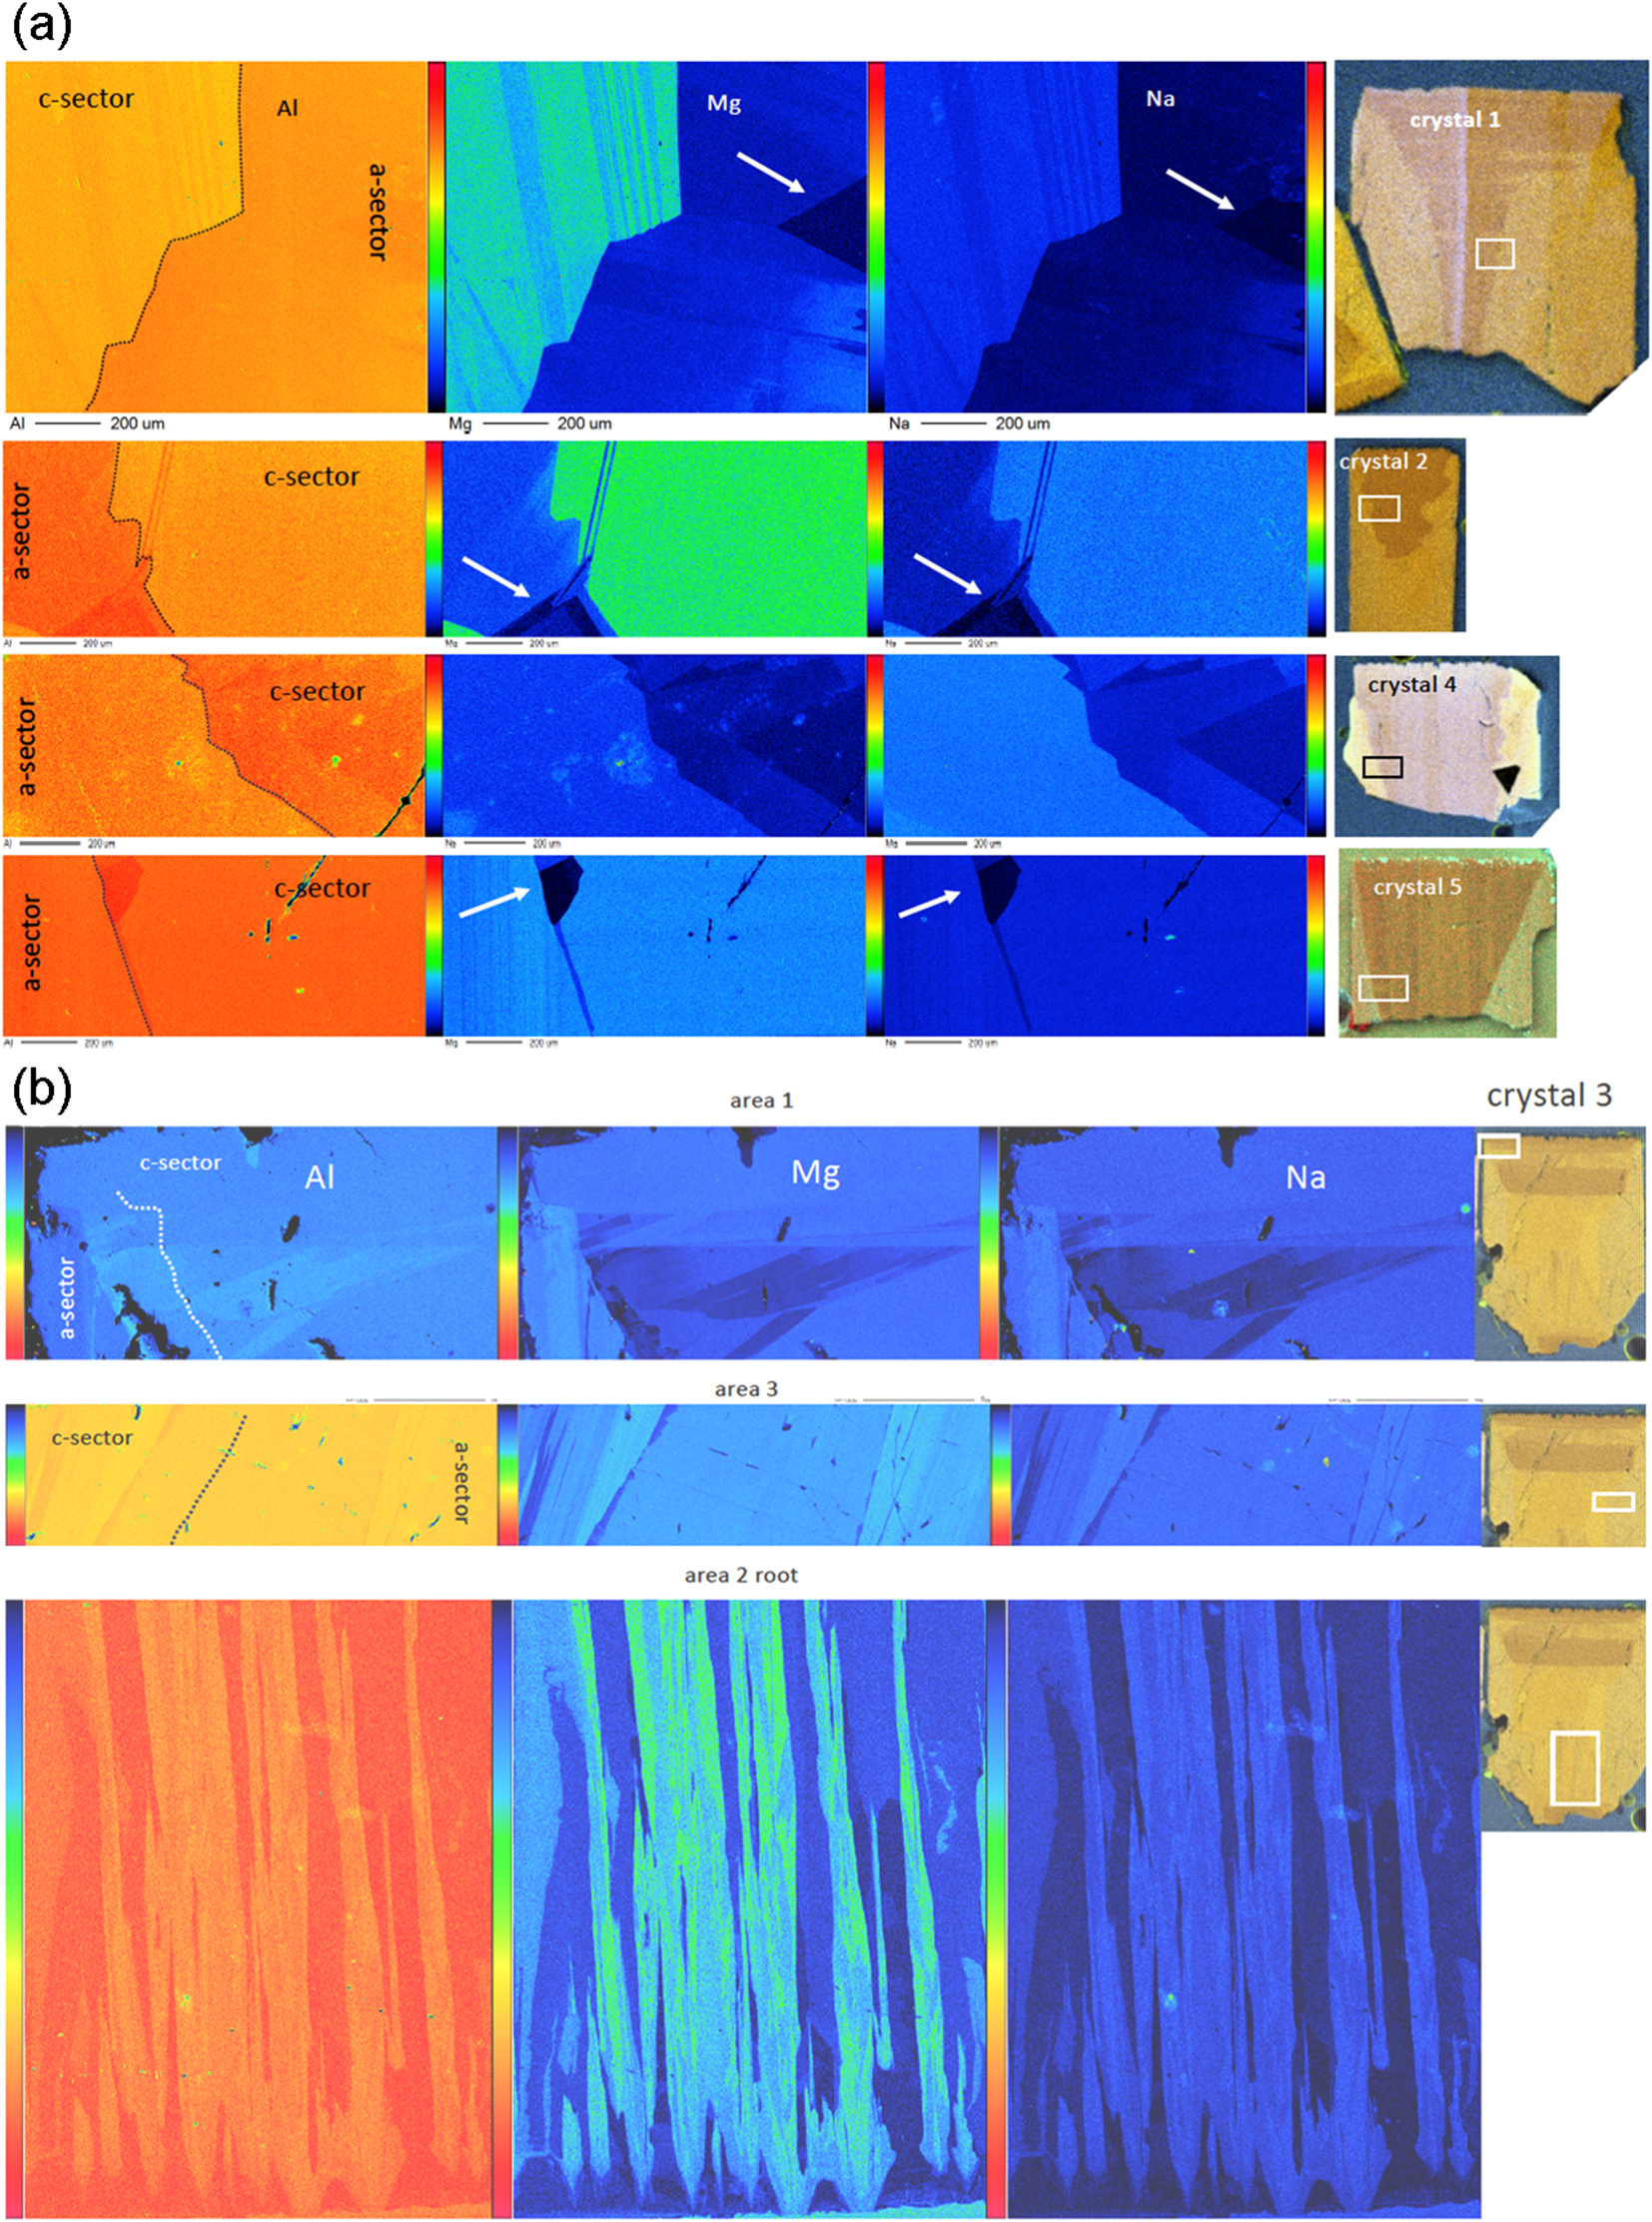
(a,b) Element-distribution maps obtained by EPMA of Al, Mg and Na for selected areas (a) in crystals #1, 2, 4 and 5 and (b) in crystal #3. The position of the mapping is indicated by white rectangles pinning the µXRF mapping for Al. The sector boundaries (outlined) are stepped and show a characteristic stripe pattern with low Mg and Na contents; arrows point to specific areas, rich in Al, and with Mg and Na below detection limits. In crystal #3, area 1 shows the homogeneous upper part with an indentation (black in Mg–Na map, partly filled with an Al-rich mineral), and below this homogeneous part a very complicated pattern of Mg+Na substitution; area 3 shows the sector boundary with the characteristic stripe pattern; area 2 the root zone with Al-rich hillocks and stripes of Mg+Na enrichment.

From the overview of the zoning pattern, as seen in the µXRF data, we selected areas for more detailed mapping by EPMA (Fig. 9), focussing on the sector boundaries, in crystal #3 on the top zone with indentations, and on the root zone. Though Mg- and Al zoning is hardly visible in the µXRF maps, they are most pronounced in EPMA. Magnesium and Na are enriched in areas where Al is relatively low, indicating the substitution VIMg+channelNa = VIAl+channel□. Some areas with a triangular outline seem to be nearly devoid of Mg+Na (marked by arrows in Fig. 9a). A common feature is that what appears as straight or serrate boundaries is, in fact, a stepped boundary, with steps ranging from tens to approximately a hundred µm. Stripes associated with the (Mg+Na)-substitution in the c-sector are parallel, but inclined to the c-axis by variable angles. The steps in the sector boundary are straight lines, but do not follow an obvious crystallographic direction with low Miller’s indices. The upper 200 µm (measured in crystal #3) are homogeneous, indicating that the indentations on (0001) do not show up in the zoning of Al, Na and Mg. However, below this zone the c-sector shows a complicated pattern with zones very poor in Mg+Na.
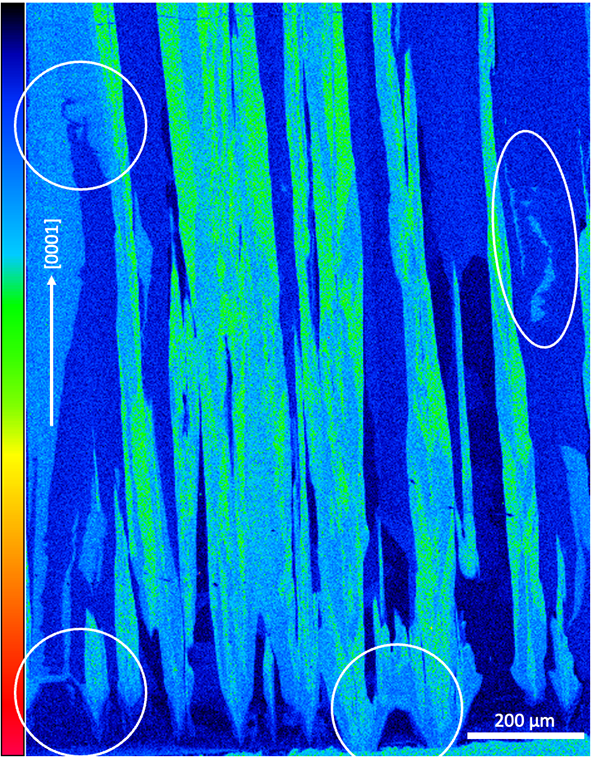
Crystal #3, which shows a root zone (Fig. 9b), started to grow in its central part homogeneously, rich in Al, poor in Mg, Fe, Cr and V (Figs 7, 9). Note, however, that the imaging is 2D, and for a complete picture of the growth features, sections showing the element distribution in the root zone perpendicular to the c-axis would be necessary. Where the a-sectors evolved to the right and left, these sectors are enriched in Fe, Cr and V. The detail of this EPMA mapping (Fig. 10) shows the root zone, with Mg-poor/Al-rich hillocks of up to 100 µm wide and high, forming a bridge-like feature. From these hillocks irregular formed stripes extend in [0001], but not strictly parallel to the c-axis. With further growth in the c-direction, Mg-enrichment suddenly begins at a certain point, continuing upwards and eventually pinching out after several 100 µm of growth. In the upper part of the mapped area, irregular zones appear, which are either depleted (left circle in Fig. 10) or enriched in Mg (right circle).
Magnesium distribution in the root zone of crystal #3. Areas with special features are encircled: the lower two circles indicate growth zones, poor in Mg, with the beginning of c-sectors enriched in Mg, the upper two circles indicate irregular areas enriched/depleted in Mg. Note the variable shape of the Mg-enriched stripes, subparallel to the c-direction

Infrared spectroscopy
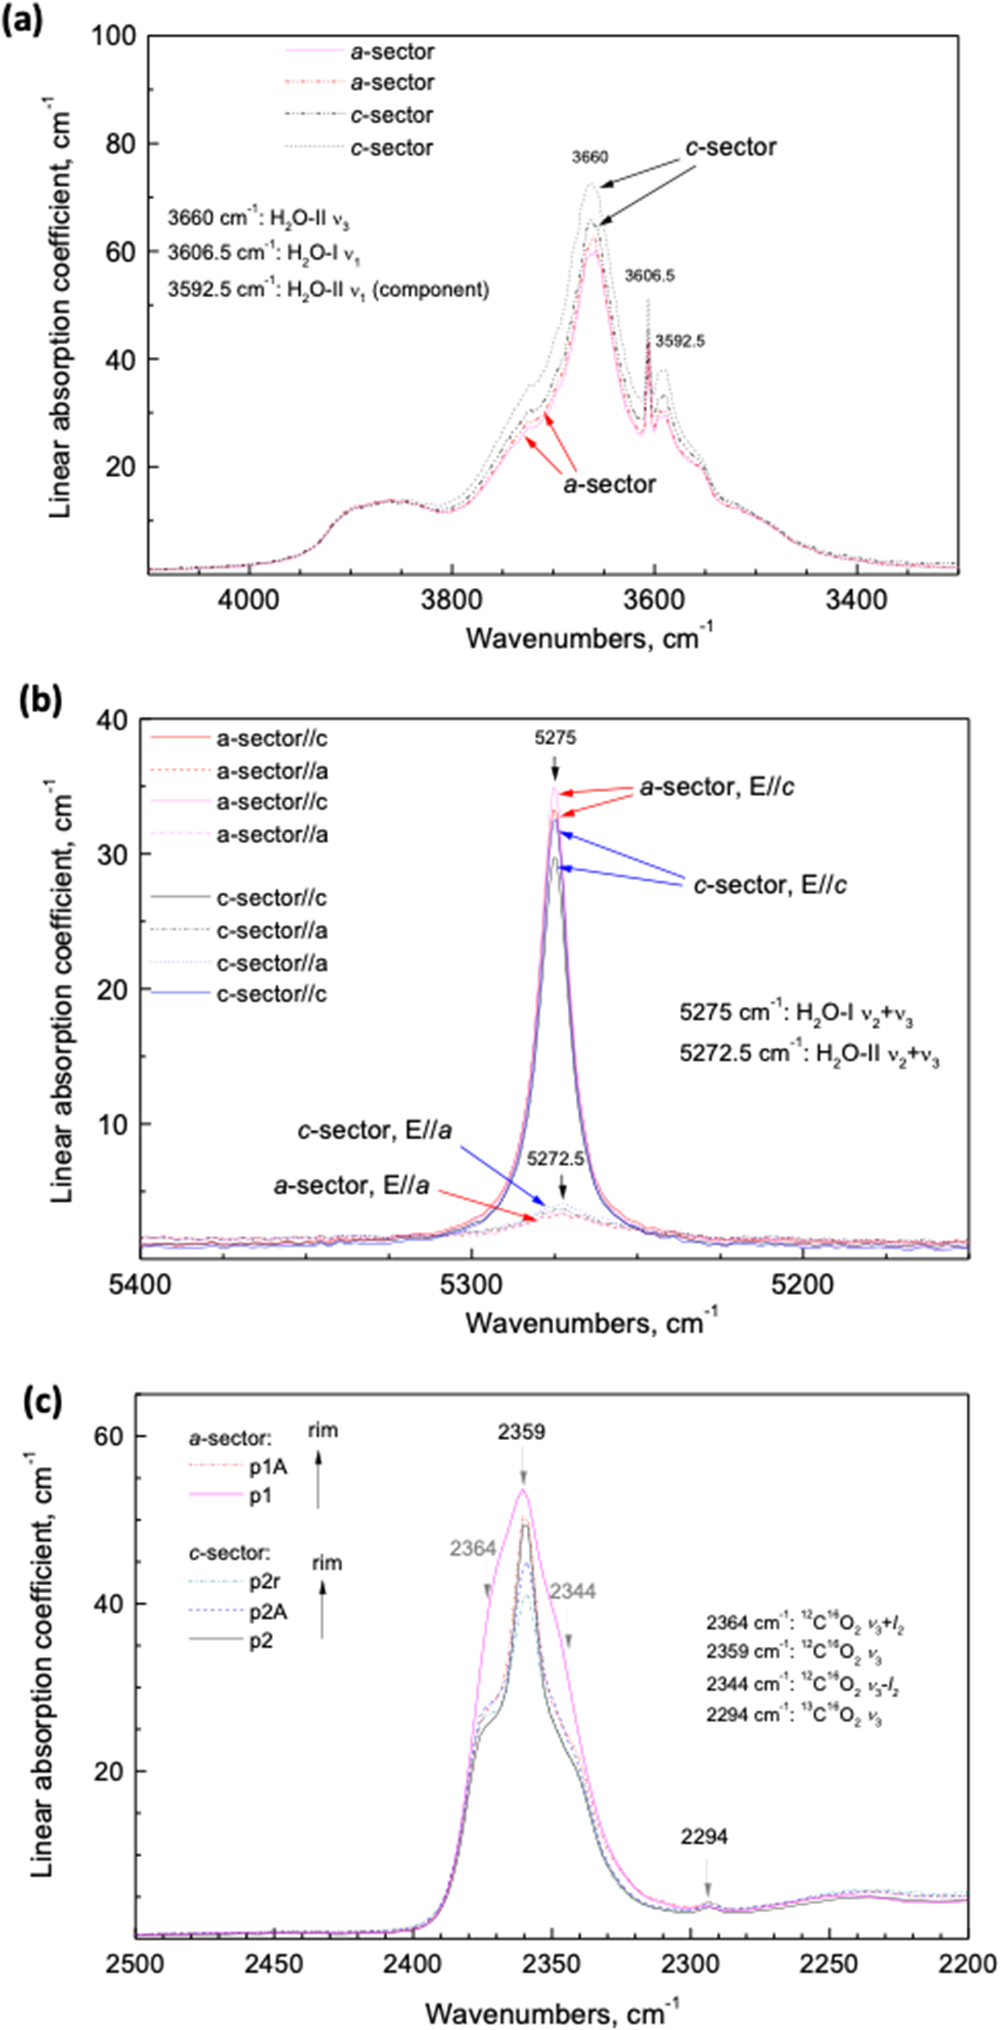
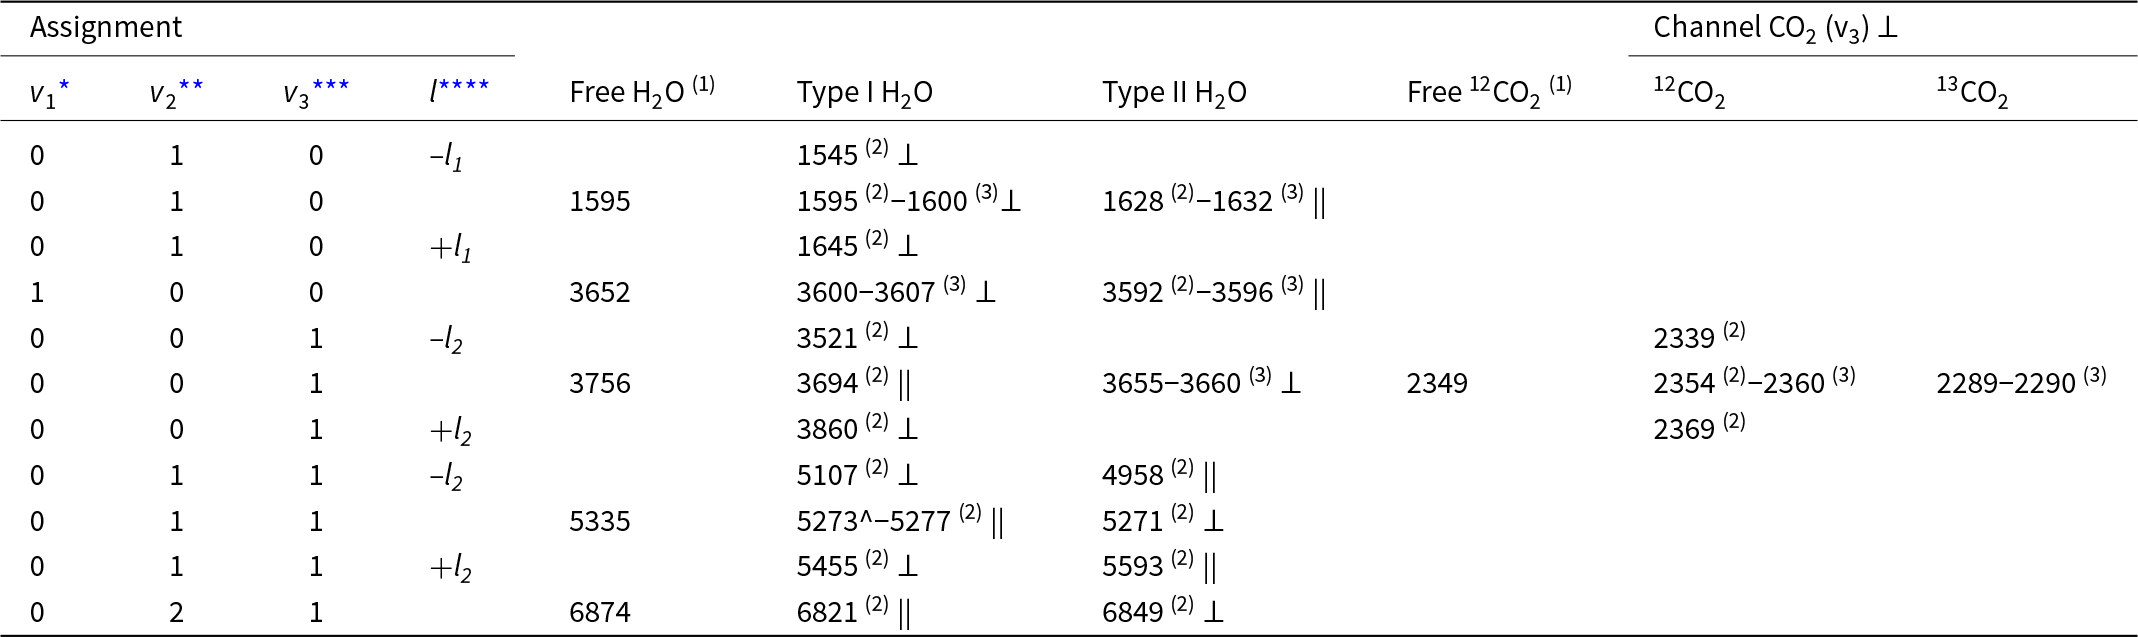
A summary of all observed main vibrational bands and combined vibration-rotation frequencies of trapped molecules in beryl structural channels is given in Table 3. The polarised IR spectra of the orientated samples show the presence of both types of H2O molecules in the channels, type I with the H–H vector parallel to the crystal’s c-axis, and type II, with the H–H vector parallel to the a-axis (Table 3). The presence of two structural types of water molecules with differing bond strength prevents the quantification of H2O content, as can be performed in glasses or for OH– groups in minerals (e.g. Libowitzky and Rossman, Reference Libowitzky and Rossman1997). Each of them gives rise to several bands in two different polarisations and at least some of these bands (ν1 of H2O I) are not linearly dependent on concentration. Additionally, molecules H2O I cause strong liberation side-bands, whereas H2O II does not. Thus, we rely on semi-quantitative assessment of the amounts of each type of water separately, as well as on the H2O I/H2O II ratios in different samples or zones of crystals, rather than determining the exact amount of water. Representative spectra of crystals #1 and 3 are shown in Fig. 11 (for the complete set see supplementary material). In the E||a polarised IR spectra of the H2O stretch bands area, the broad band at 3660 cm–1 results from the H2O II antisymmetric stretch vibrations (Table 3). The c-sector is enriched in H2O II. Comparison of combined ν2+ν3 bands of H2O I and H2O II in the a- and c-sectors show that the c-sector is slightly enriched in H2O II, but depleted in H2O I.
(a) Polarised IR spectra E||a of the H2O stretching bands area of crystal # 1. The broad band at 3660 cm–1 is due to H2O II (H–H vector perpendicular to the a-axis) antisymmetric stretching vibrations. The c-sector is enriched in H2O II, as it is also slightly enriched in Na (+Mg) (see Fig. 9). (b) Comparison of combined ν2+ν3 bands of H2O I (H–H vector parallel to the c-axis) and H2O II in different sectors. The c-sector is slightly enriched in H2O II, but depleted in H2O I. (c) Polarised IR spectra E||a of the CO2 ν3 band area of crystal no. 3 in different sectors. The a-sector is enriched in CO2. In both sectors CO2 concentration decreases clearly from the central part to the rims.

Summary of main vibrational bands and combined vibration-rotation frequencies (cm−1) of trapped molecules in beryl structural channels. Polarisation is given relative to crystal’s c-axis as perpendicular ⊥ and parallel ||

* symmetric stretching, ** bending, *** antisymmetric stretching vibrations, **** side bands due to liberation motion; references: (1) Herzberg (Reference Herzberg1945); (2) Wood and Nassau (Reference Wood and Nassau1967); (3) this study
CO2 molecules are also present, but to a minor extent (Fig. 11c). The polarised IR spectra with E||a of the CO2 ν 3 band area in different sectors indicate that the a-sector is enriched in CO2. In both sectors CO2 concentration decreases from the central part to the rims. As cordierite is isostructural with beryl, and the orientation of the linear CO2 is perpendicular to the c-axis in cordierite (Khomenko and Langer, Reference Khomenko and Langer2005), we assume the same orientation in beryl.
Discussion
Growth
Growth features on (0001) appear as growth steps (Fig. 2e,h). The 120° angle of the steps indicates that they result from growth along screw dislocations. Other growth features on (0001) (Fig. 2a,b) are the indentations, especially when combined with cross sections and corresponding BSE images (Fig. 3). The cross sections show that the indentations with a flat bottom or terminating with obliquely orientated faces are of similar depth, forming a palisade-like structure; indentations can extend into the crystals and continue in features which resemble cracks. Closer inspection shows oblique faces (Fig. 3e–h), which rules out their formation as cracks during brittle deformation (or sample preparation) and instead suggests they are a growth feature. Palisade-like structures formed through preferential growth in the c-direction, followed by growth in the a-direction, which led to the forming of cavities by closing the indentations in the upper part. Indentations are partly filled with crystals and with organic matter (Fig. 3d), which might have prevented further growth in the c-direction. Another argument in favour of a growth feature, rather than a dissolution feature is the shape, which, in the case of dissolution should result in a reversed trumpet form, such as observed in pegmatitic beryl (Bartoshinskiy et al., Reference Bartoshinskiy, Matkovskiy and Srebrodolskiy1969; Franz et al., Reference Franz, Vyshnyevskyi, Khomenko, Lyckberg, Wiedenbeck and Gernert2023; Renfro et al., Reference Renfro, Smith, Koivula, McClure, Schumacher and Shigley2023).
The elevated, continuous rims of (0001) are similar to the vaso- or spongy-type emeralds from the Chivor mining district in Colombia, described by Pignatelli et al. (Reference Pignatelli, Morlot, Salsi, Giuliani and Martayan2022) and Schmetzer and Martayan (Reference Schmetzer and Martayan2023). This rim does not show signs of dissolution; if the indentations on (0001) were formed by dissolution, the crystal edges would typically be the first areas to be attacked (Sunagawa, Reference Sunagawa2005). A pyramidal face (which corresponds to the corner between (0001), first- and second-order prisms) was only observed in crystal #4 (see supplementary material); it also shows an elevated rim and no signs of dissolution. Additionally, the edge between the first-order- and second-order prisms is characterised by growth steps, and not by dissolution (Fig. 4g).
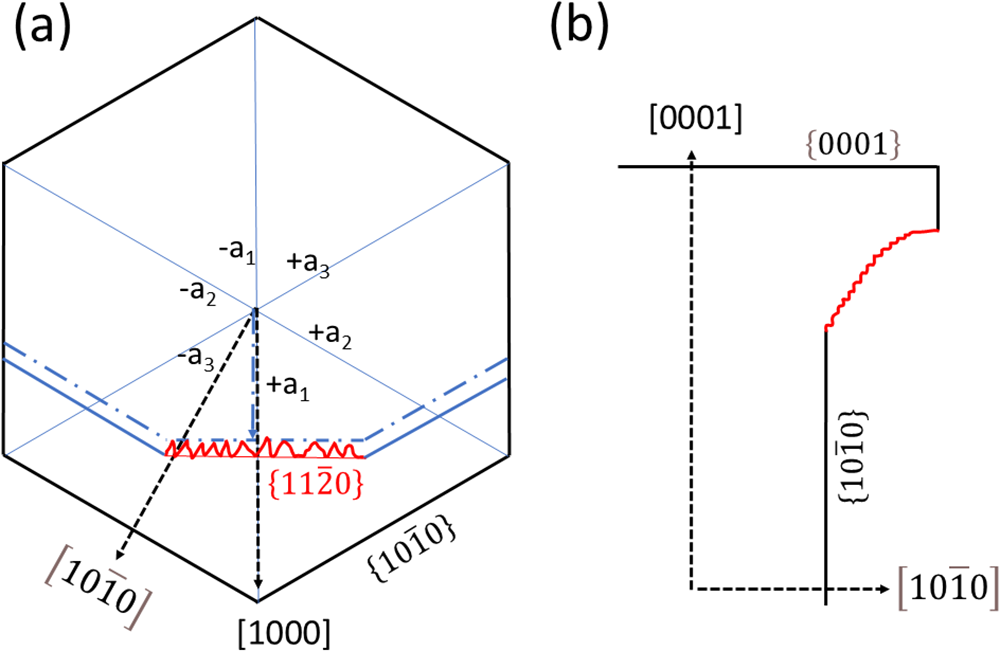
No growth features were observed on the first-order prism; the faces are flat (except for dissolution features, see below). The second-order prism is, however, entirely different (Fig. 5). Their much smaller size, not well developed on all crystals and on all sides of a crystal, and the wedge-shaped, anastomosing grooves, which extend over several hundreds of µm subparallel to the c-axis (Fig. 5b, e, f), indicate that their morphology was shaped by growth. The relative growth rates in [1000] and  $\left[ {10\bar 10} \right]$ determine the presence (and size) or absence of a second-order prism (Fig. 12a). A change in the relative growth rates is probably responsible for producing the observed pattern. The similar phenomenon of a face with ridges and valleys, which we observed on the crystal with conical growth (Fig. 6), is interpreted in the same manner (Fig. 12b) i.e. by repeatedly changing growth rates in the a- and the c-direction. The variation of the growth directions in all three dimensions also explains the anastomosing ridges on the second-order prism (Fig. 5a, b). This type of growth differs from sceptre growth described by Pignatelli et al. (Reference Pignatelli, Morlot, Salsi, Giuliani and Martayan2022), which exhibits a second stage of growth as in sceptre quartz. Our observations align with observations made by Schmetzer and Martayan (Reference Schmetzer and Martayan2023) for conical crystals, which are characterised by what they called macroscopically visible ‘growth lines’ perpendicular to the c-axis on the prism faces. These lines might be misinterpreted as vicinal faces.
Schematic illustration for the formation of (a) the morphology of the second-order prism  $\left\{ {11\bar 20} \right\}$ and (b) the transition from the lower to the upper part of the conical growth. If the growth rate (dashed black arrows) in [1000] is higher than in
 $\left[ {10\bar 10} \right]$, no second-order prism develops; if it is lower (blue arrow) it develops. Changes in the relative growth rates produces a morphology with ridges in the c-direction (red line). An analogous change in the growth directions [1000] and [0001] produces a similar feature on the conical part of the crystal.

Comparison with experimentally grown beryl in hydrothermal solutions (Demianets et al., Reference Demianets, Ivanov-Shitz and Gainutdinov2006) shows that all three commonly developed faces (pinacoids, first- and second-order prisms) grow by a dislocation-mediated layer-by-layer mode, consistent with our observations. The second-order prism shows a higher roughness than the first-order prism, which could also be observed in the natural crystals of this investigation. However, the growth hillocks, step height and step width, as well as the surface roughness of the synthetic crystals are in the order of a few nm, whereas on the natural crystals we observe these features on the µm scale.
Dissolution
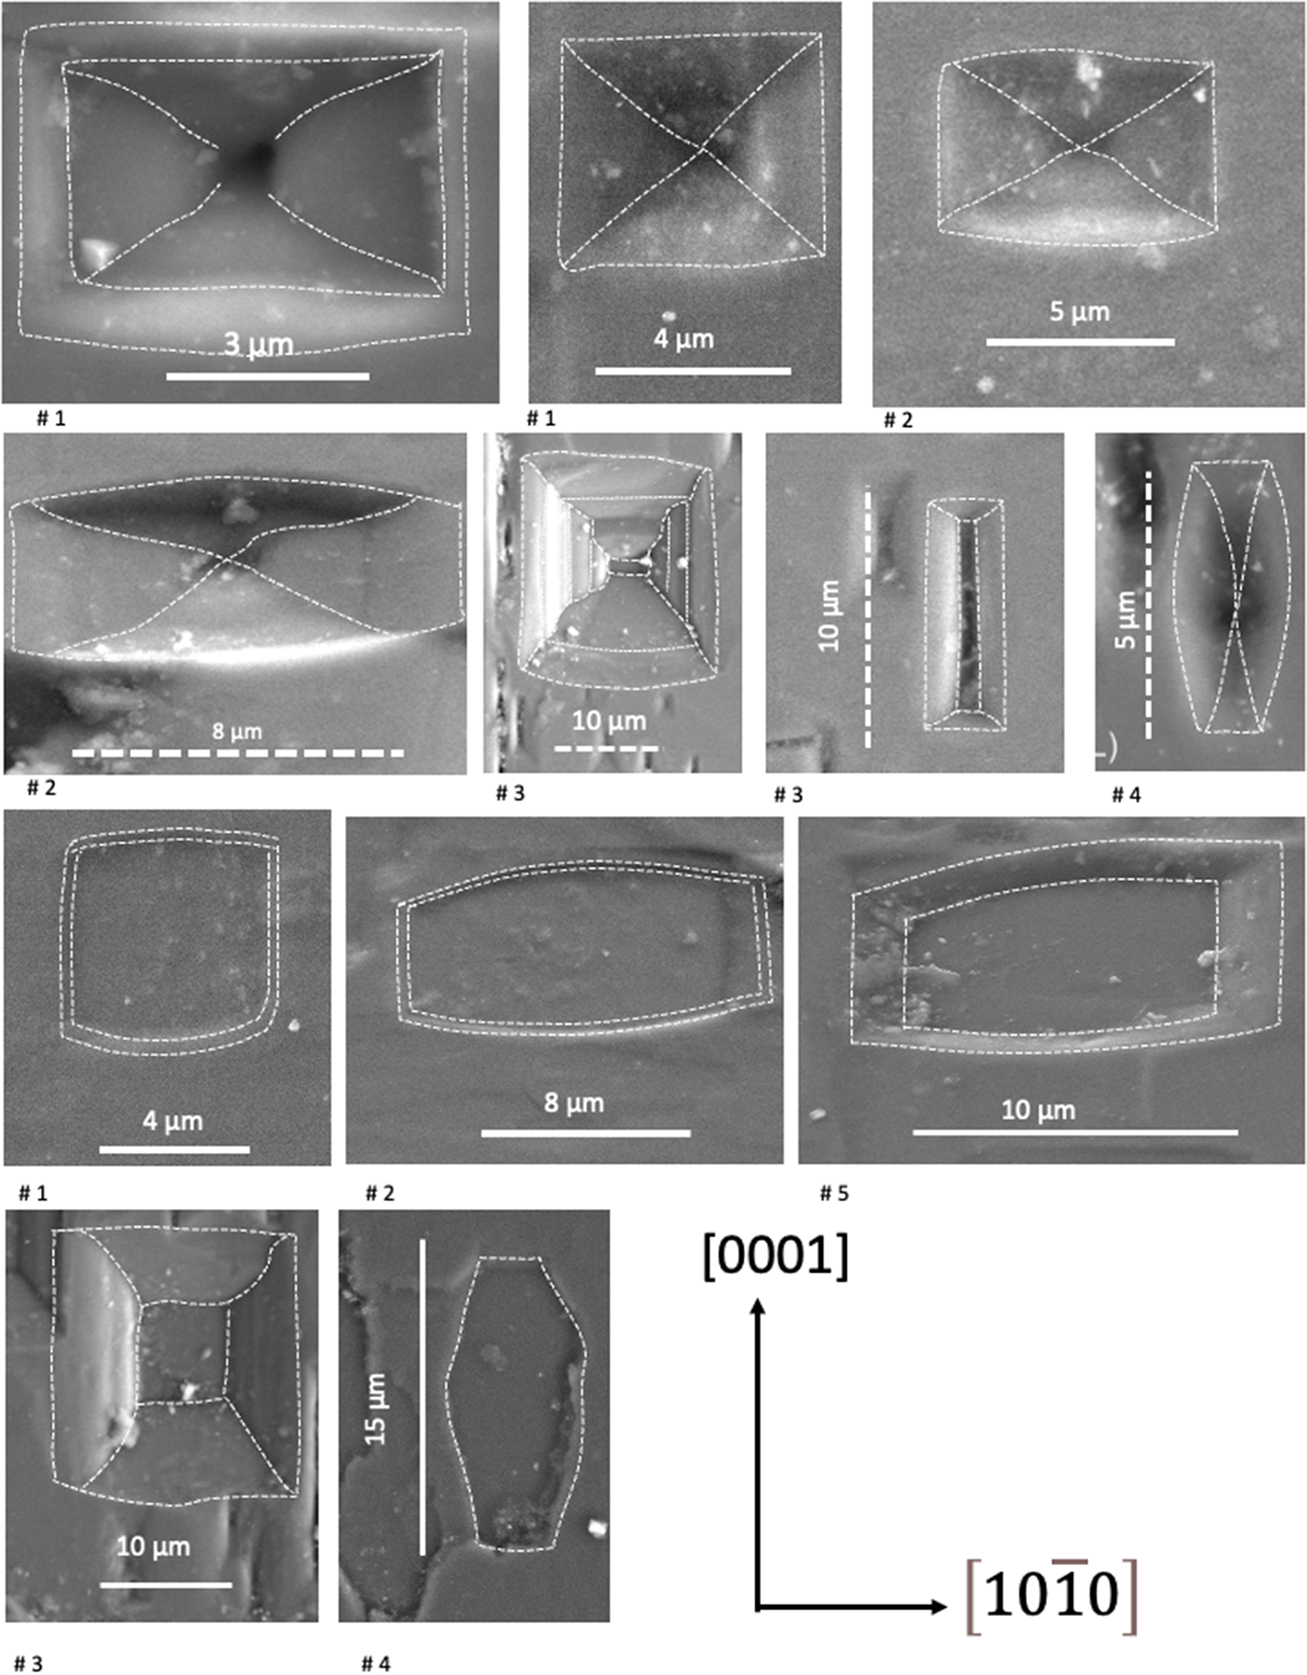
Etch pits are observed in many types and occurrences of beryl (Sunagawa I. and Urano A., Reference Sunagawa and Urano1999; Schmetzer and Martayan, Reference Schmetzer and Martayan2023). The abundant EP on (0001) (Fig. 2e–h) as well as on the first-order prism (Fig. 4), indicate a high density of defects on these planes; on the second-order prism they are rare (Fig. 5d). The fact that EP also overprint the growth features (Figs 2f, 4g) allows distinction between growth and dissolution. Growth steps on (0001) of a few µm height are also overprinted by EP, typically in the inner 120° angle (Fig. 2e,h), indicating screw dislocations, which subsequently act as initiation sites of dissolution. The different outlines of the 5–10 µm wide P- and F-type EP on the first-order prism (Fig. 13) shows that they are square or mostly elongated perpendicular to the c-axis, but also parallel to it, and typically appear with slightly curved outlines, indicating similar dissolution rates, sometimes slightly changing during dissolution, in both directions.
Summary of the outline (highlighted with dashed lines) of EP on the first-order prism. They are P-type (upper part) and F-type (lower part), square or mostly elongated perpendicular to the c-axis, but also parallel to it, and commonly with slightly curved outlines. They are typically in the order of 5–10 µm wide. One example of the P-type in crystal #3 (second row) shows preferred dissolution with a bottom, elongated in c-direction.

The EP can be arranged in chains (Fig. 2h), indicating a large number of parallel orientated dislocations, which has not been observed in other beryls (Schmetzer and Martayan, Reference Schmetzer and Martayan2023; Franz et al., Reference Franz, Vyshnyevskyi, Khomenko, Lyckberg, Wiedenbeck and Gernert2023). This type of EP coalescence has also been described from albite (Beig and Lüttge, Reference Beig and Lüttge2006) and significantly increases the effective surface area for further dissolution (Lüttge, Reference Lüttge2005). The distance of individual P-type EP in a chain varies from 1.3 µm to 4.4 µm and of F-type EP between 4.6 µm and 7.7 µm. In the case of P-type EP, they probably indicate screw dislocations, which can occur in bundles (Sunagawa, Reference Sunagawa2005), dominantly in the c-direction, but also strongly deviating from c in various angles. The occurrence of chains of F-type EP, which are ascribed as due to point defects, requires that point defects are aligned. This could occur along edge dislocations, which are the preferred site for e.g. incorporation of atoms with a different ionic radius.
The variable shape of EP on prism faces (Fig. 13) indicates slight variations in dissolution rates in the two main directions [0001] and  $\left[ {10\bar 10} \right]$. However, as estimated from their size, overall dissolution was minor. The rare EP with strong elongation in [0001] (Fig. 4h) are similar to EP obtained on hydrothermally grown beryl crystals after etching, where etching occurred on gas–liquid inclusions on the first-order prism (Dem’yanets and Ivanov-Schitz, Reference Dem’yanets and A.K2009).
In summary, both the growth and dissolution structures indicate preferred growth in the c-direction with the formation of indentations on (0001), wedge-shaped features on the second-order prism instead of a flat surface due to varying growth rates in different directions, similar to the conical growth. Dissolution is minor and follows the features created by growth: EP are arranged in chains on dislocation bundles. In line with our observations, Schmetzer and Martayan (Reference Schmetzer and Martayan2023) described the large and deep open cavities on (0001) of the vaso-type emeralds from Colombia as a growth feature, whereas Pignatelli et al. (Reference Pignatelli, Morlot, Salsi, Giuliani and Martayan2022) argued for etch pits.
Compositional zoning
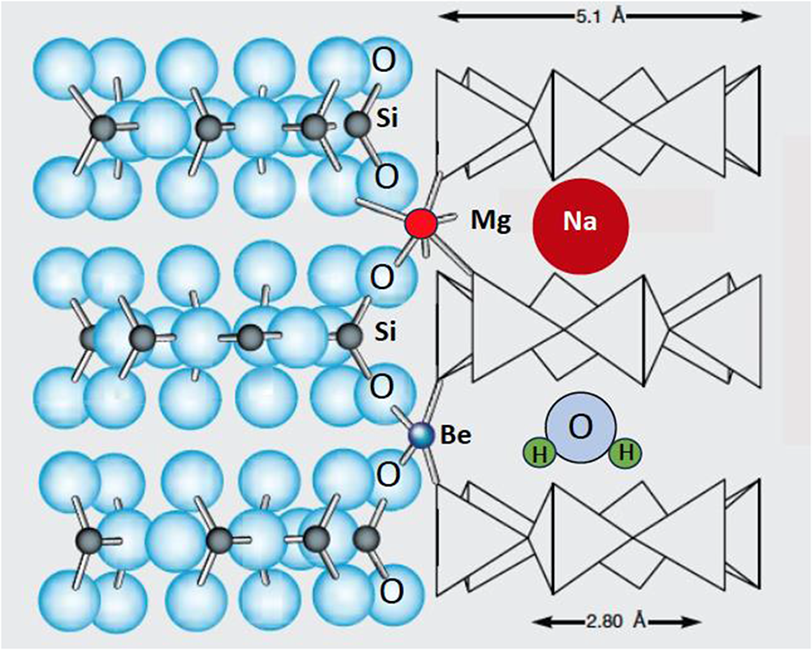
The sector zoning, shown in the Colombian emeralds of this study, results from preferential incorporation of elements in specific growth directions on their respective growth surfaces with different local equilibria at different faces, and these differences are preserved in the crystal bulk. Because the crystals are short prismatic with an aspect ratio near one (Table 1), the final, overall growth rates in a and c are similar (except for the long-prismatic crystal #2). However, the rate of incorporation of certain elements changes, as the sector visibility can be quite distinct for different elements. Sector zoning is well developed in magmatic and metamorphic crystals — especially visible in crystals with a prismatic shape — such as clinopyroxene, tourmaline, andalusite (variety chiastolite) and many others (e.g. van Hinsberg et al., Reference Van Hinsberg, Schumacher, Kearnsi, Mason and Franz2006; Henry and Dutrow, Reference Henry, Dutrow, Grew and Anovitz1996). At high temperature and in crystals and for elements with high diffusion rates, these differences can be equilibrated. However, at low temperature diffusion is insignificant in silicates, as is the case for the Colombian beryls with a formation temperature near 300–350°C. Hexagonal beryl develops a c- and an a-sector in the growth directions [0001] and  $\left[ {10\bar 10} \right]$, (Fig. 7). The trace of the sector boundaries in 2D presents information about relative growth rates in the sectors (Philpotts and Ague, Reference Philpotts and Ague2009); straight boundaries indicate no change, curved boundaries indicate continuous changes, and serrate boundaries irregularly changing relative growth rates. The sector zoning in the Colombian emeralds is easily visible in the main substitution VIMg+channelNa+H2O II = VIAl+channel□, and also in the substitution of chromophores for Al (Figs 8, 11). Aluminium is enriched in the a-sector, together with H2O I, whereas Mg and Na are enriched in the c-sector together with H2O II (Fig. 12b), consistent with the position of Na in the neighbourhood of H2O II (Fig. 14).
Projection of the beryl structure illustrating the 6-membered silica rings, which form channels parallel to the c-axis (adopted from Pignatelli et al., Reference Pignatelli, Guiliani, Ohnenstetter, Agrosi, Mathieu, Morlot and Branquet2015). Local charge balance requires Na near to Mg, when it replaces VIAl, and the H2O molecule in the next vacancy orientates its H–H-vector perpendicular to the c-axis (H2O II).

Growth bands in zoning can occur because of a gap in supply of an element and indicate an element hiatus. It is known in pegmatitic beryls as a characteristic defect (Scandale et al., Reference Scandale, Lucchesi and Graziani1990) and in Colombian emeralds (Pignatelli et al., Reference Pignatelli, Morlot, Salsi, Giuliani and Martayan2022; Schmetzer and Martayan Reference Schmetzer and Martayan2023). Such gaps were observed in the redox-sensitive elements V, Cr and Fe in crystals #1 and 3 (Figs 8, 9). However, they are restricted to the c-sector, and thus, indicate only a preference of incorporation of these elements in one growth direction, not a general gap in availability of these elements. This is different to the case in the emeralds from Eidsvoll, Norway (Loughrey et al., Reference Loughrey, Marshall, Ihlen and Jones2013) with colour zoning in stripes parallel to c, and in the Emmaville occurrence, Australia (Loughrey et al., Reference Loughrey, Groat, Jones, Millsteed and Main2012) with colour zoning in bands parallel to the a-axis. It is also different from Cr- and V-rich overgrowths on the trapiche emeralds from Colombia (Pignatelli et al., Reference Pignatelli, Guiliani, Ohnenstetter, Agrosi, Mathieu, Morlot and Branquet2015), which clearly indicate a gap in supply of elements. In the emeralds from Kruta Balka, Ukraine, Cr also shows common oscillatory growth zoning with stripes parallel to the major growth directions (Franz et al., Reference Franz, Vyshnevskyi, Taran, Khomenko, Wiedenbeck, Schiperski and Nissen2020), indicating growth controlled by diffusion in the fluid/melt reservoir. This model is obviously not applicable to the Colombian emeralds investigated here.
An asymmetric growth is seen in the distribution of V, Cr and Fe in crystal #1. Such a growth feature was postulated for the growth of hydrothermal-pegmatitic beryl with a horse-shoe shape (Graziani et al., Reference Graziani, Scandale and Zarka1981), for emeralds from Colombia (Pignatelli et al., Reference Pignatelli, Morlot, Salsi, Giuliani and Martayan2022), for sector-zoned garnet from a hydrothermal-pegmatitic transition in pegmatoids from the Bohemian Massif, Austria (Kohn et al., Reference Kohn, Alifirova, Daneu, Griffiths, Libowitzky, Linner, Ertl, Abart and Habler2024), and for lawsonite in veins of the Schistes Lustrés in the Western Alps (Lefeuvre et al., Reference Lefeuvre, Dubacq, Verlaguet, Herviou, Walker, Caron, Baxter and Agard2024). It might be a more common feature in vein minerals than previously thought.
Serrate sector boundaries result from changes in the growth rate, with preferred incorporation of elements into the a- and the c-sector, and again is not necessarily a result of a limited supply of these elements. Serrate boundaries are best developed in V in crystals #2 and #4 (Fig. 8), but the detailed mapping by EPMA shows that serrate boundaries are also very prominent in all crystals in Al, Na and Mg, due to the substitution VIMg+channelNa = VIAl+channel□ (Fig. 9). The sector boundaries are irregular, oblique to the a- or c-axis, but with straight borders. However, it does not follow a low-indexed crystal face, but changes the angle of the different zones (shown as stripes in Mg in crystals #1 and #2, producing concentration triangles in in crystals #2 and #5 in the 2D-maps, Fig. 9). The variable direction of the sector boundaries and of the stripes rich in Mg+Na mimics the variable direction of the EP chains, corresponding to dislocation bundles, on the prism faces. Graziani et al. (Reference Graziani, Scandale and Zarka1981) concluded, on the basis of X-ray tomography investigations on pegmatitic beryl, that dislocation bundles are the centres, where the crystal grew in opposite directions, meeting in a straight boundary, which is similar to the observations on the Colombian emeralds.
Summary and conclusions
The emerald crystals, in this investigation, show features not observed in beryl from other localities: a high density of defects, resulting in etch pits aligned in chains, and a substitution VIMg+channelNa+H2O II = VIAl+channel□, orientated in a pattern parallel and oblique to the c-axis. These observations are in line with the growth model presented by Pignatelli et al. (Reference Pignatelli, Guiliani, Ohnenstetter, Agrosi, Mathieu, Morlot and Branquet2015) for sector-zoned trapiche emeralds; in the fold-and-thrust belt of the western Cordillera in Colombia, veins opened during thrusting at low-grade metamorphic conditions. We conclude that the small crystals investigated here grew in the abruptly filled veins from a single batch of fluid from the schist, a confined fluid reservoir. Due to the rapid pressure drop and resulting high oversaturation, the crystals grew and there are no indications that further supply of fluid occurred. In a closed system, changes in parameters such as pH, oxygen fugacity and concentration of trace elements are much more important than in a buffered open system or in a system with a large reservoir such as a magma chamber.
The growth features observed in the emerald crystals differ from those predicted by Raleigh fractionation, which would instead show a smooth and regular profile of core–rim zoning or would show oscillatory zoning due to a diffusion process from the fluid to the crystal-fluid/melt interface. A closed system behaviour is, however, only valid for our observations on the small crystals investigated. In contrast, some of the trapiche emeralds (Pignatelli et al., Reference Pignatelli, Guiliani, Ohnenstetter, Agrosi, Mathieu, Morlot and Branquet2015) clearly show a second stage of growth with new, Cr- and V-rich fluids.
Directed flow from the matrix into the vein might have resulted in asymmetric content in trace elements, which is rapidly incorporated into the growing crystal without homogenisation in the fluid. This process might be more common than previously described and can have important implications for vein minerals in general, particularly when used for age determinations or if they are used as indicators for enrichment processes of critical elements.
The confined reservoir of fluids and absence of clear indications for further supply of fluids also inhibits significant post-growth dissolution, as the fluid would remain beryl-saturated. In the Colombian emeralds, dissolution phenomena such as EP are minor, but quite distinct from what can be observed in pegmatitic beryl. The arrangement in chains is unique and it might be worth checking other vein minerals for this feature.
Supplementary material
The supplementary material for this article can be found at GFZ data services https://doi.org/10.1180/mgm.2025.10121.
Acknowledgements
Alexander von Humboldt-Stiftung and Akademisches Auslandsamt Technische Universität Berlin supported Vladimir Khomenko during his stays in Berlin, and financial support by DFG fund FR557/34-1 is gratefully acknowledged. Thorough reviews by Vincent van Hinsberg, two anonymous reviewers and editorial comments and handling by Barb Dutrow were of great help to improve the manuscript.
Author contribution
GF idea, data acquisition EPMA, SEM, writing of first draft; VK IR, writing; FS µXRF, writing; JN EPMA; UG SEM
Competing interests
The authors declare none.