Introduction
Indigenous breeds, also termed native breeds, originate from and are adapted to and utilized in a particular geographical region, form a sub-set of the locally adapted breeds (FAO, 2001). In Ethiopia, there are about 50.4 million chickens out of which 96.9 percent are indigenous and 3.1 percent are exotics and their crosses (CSA, 2013). The indigenous chickens produce 85.5 million eggs annually (91.8 percent), while a much less amount (8.2 percent) is contributed to the national egg production by improved strains of chickens largely kept in intensive poultry production systems (CSA, 2013). There are no defined breeds as such and they are referred to as ‘ecotypes’ or ‘populations’ and some have been a subject of morphological and genetic characterization studies (Forsido, Reference Forsido1986; Dessie, Reference Dessie2003; Duguma, Reference Duguma2006; Hassen, Reference Hassen2007; Kibret, Reference Kibret2008; Dana et al., Reference Dana, Tadelle, Elisabeth and Johan2010; Moges, Melesse and Dessie, Reference Moges, Melesse and Dessie2010; Melesse and Negesse, Reference Melesse and Negesse2011; Aklilu, Reference Aklilu2013; Desta et al., Reference Desta, Dessie, Bettridge, Lynch, Melese, Collins, Christley, Wigley, Kaiser, Terfa, Mwacharo and Hanotte2013; Nigussie, Reference Nigussie2013; Getu, Alemayehu and Wultaw, Reference Getu, Alemayehu and Wultaw2014). Only ten Ethiopian chicken types, namely Chefe, Gebsima, Horro, Jarso, Kei, Naked neck, Netch, Tepi, Tikur and Tilili have been listed in the Domestic Animal Genetic Resources Information System (DAGRIS) database (DAGRIS, Reference Kemp, Mamo, Asrat and Dessie2007) and a large part of the indigenous chicken genetic diversity still remains non-descript.
Quantitative and qualitative morphological traits are important in the characterization and measurement of indigenous chicken genetic diversity. Metekel zone of Benishangul Gumuz is among areas of Ethiopia where no extensive introduction of exotic chicken germplasm has taken place. Preference for particular chicken phenotypes can be strongly influenced by the culture of the people and specific needs to their unique environments. In this regard, Metekel zone is considered as one of the most ethnically and agro-ecologically diverse areas. The five largest ethnic groups reported in the Zone were the Gumuz (36.78 percent), the Shinasha (21.6 percent), the Amhara (17.39 percent), the Awi (11.33 percent) and the Oromo (11.09 percent) while all other ethnic groups made up 1.81 percent of the population (CSA, 2007).
Except for Dana et al. (Reference Dana, Tadelle, Elisabeth and Johan2010) who studied indigenous chicken populations in Mandura district, populations in other districts of Metekel zone in Northwestern Ethiopia have never been investigated. The present study was therefore carried out to study variations among indigenous chicken populations in three districts of the zone in terms of morphological and productive performance as a basis for the design of future genetic intervention programmes.
Materials and methods
Description of the study area
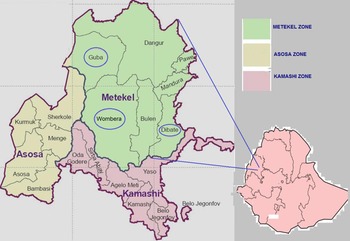
There are nine geopolitical boundaries in the Federal Democratic Republic of Ethiopia, which are referred to us Regional States or Regions. This study was conducted in Guba, Dibate and Wombera districts of Metekel zone, in Benishangul-Gumuz Region, in Northwestern Ethiopia (Figure 1). Metekel zone, one of the three zones in the Region, consists of six districts and is situated within an altitude range of 550–2500 m above sea level. Metekel is the largest zone with an area of 26 272 km2. The average monthly temperature ranges between 20 and 25 °C. During the hottest months (January–May), it reaches between 28 and 34 °C. The amount of annual rainfall varies from 500 to 1800 (MZARDO, 2007). Map of Benishangul Gumuz Region with the three sample districts in Metekel zone of Northwestern Ethiopia is presented in Figure 1.
Map of Metekel zone indicating the study area (adapted from GERDP, 2012).

The agricultural production system in Metekel zone varies with agroecology. Wombera district, which has the highest altitude not only in the zone, but also in the Region, is characterized by mixed crop–livestock production system. The agricultural production system in the mid-altitude and especially lowland districts on the other hand is based on diversified livelihood strategies that include mixed crop–livestock production, hunting and gathering, and traditional gold mining. Chickens are kept as part of a village chicken production system where they subsist on scavenging and mate uncontrolledly. While ploughing with a pair of oxen is a technology being recently introduced to some of the indigenous communities, considerable area of land in the zone is currently being used by private companies for cotton, sesame and other lowland oilseeds production.
Sample size and sampling method
The sampling frame was established following an exploratory survey to all the six districts of the zone and discussions with local livestock extension officers and researchers. Districts were then clustered purposively taking into account of agroecological variability, poultry market-sheds, and the presence of native communities who have been keeping chicken in the area for many generations. Agroecology was considered by the researchers to have implications on indigenous chicken genetic diversity through adaptive divergence, while market-shed was assumed as a major factor for the mix-up of different chicken populations in a village production setting. Selection of districts from a cluster was done randomly. The cluster of lowland districts in the zone was represented by chickens sampled from Guba district, while the mid-altitude and highland clusters were represented by Dibate and Wombera districts, respectively. Villages in each district were located within the same market-shed and were homogenous in terms of agroecology. Hence, it sufficed to sample two villages from each of the three districts on random. Households and villages were sampled through a transect walk. A maximum of three hens and two cocks were sampled from a household. The data were collected in April 2013 and the target number for sample chickens for a study district was 100–300 hens and 10–30 cocks (FAO, 2012). Measurements were taken from males aged at least 1 year and females that have already started laying based on information obtained on each chicken from the owner.
All quantitative and qualitative variables in the standard chicken descriptor list of FAO (2012) were measured in this study. A total of 69 males and 244 females were sampled to record their qualitative and quantitative traits (Table 1). Eight quantitative and 16 qualitative characters were measured. Measurements were made using textile tape in centimetre unit. A hanging spring balance was used to measure live body weight of individual chickens. Information on flock performance of indigenous chickens was collected with the help of structured questionnaires addressed to 75 farmers.
Description of the study districts and number of chickens sampled.

1 District is an administrative domain at the third level down a Region and immediately below a zone.
2 Bureau of Agriculture, Benishangul-Gumuz National Regional State, 2003.
Data management and statistical analysis
All data were entered, and edited using Excel© worksheet (Microsoft Office, 2013). Qualitative data were subjected to chi-square (χ 2) tests. The Statistical Package for Social Sciences (SPSS 20.0, 2011) was used to estimate their frequency and level of association with district. Non-parametric discriminant analysis was also run on qualitative variables to confirm their importance in classifying the populations into phenotypically distinct groups. The general linear model (PROC GLM) of SAS (2003) was employed to examine the importance of quantitative variables in explaining phenotypic differences between sample chicken populations of the three districts. Duncan's multiple range test was performed on district means of body measurement traits. Stepwise discriminant procedure was applied using PROC STEPDISC to determine which morphological traits have more discriminant power than the others. The CANDISC procedure (SAS, 2003) was used to perform canonical analysis to derive canonical functions, linear combinations of the quantitative variables that summarize variation between districts, and compute Mahalanobis distance matrix. The percent assignment of chicken populations into respective districts was made by using DISCRIM procedure. PLOT procedure was used in conjunction with the CANDISC procedure to aid visual interpretation of group differences between districts.
Quantitative data were analysed separately for the two sexes. Taking district and sex as fixed main effects, the following model was used to analyse quantitative data:
 $${Y_{ijk}} = {\rm} \mu {\rm} + {\rm} {S_i} + {\rm} {D_j} + {\rm} {e_{ijk}},$$
where Y ij k is the observed value of the linear body measurements, S i is the fixed effect of district i (i = 1, 2, 3), D j is the effect of the jth sex (j = 1, 2), and e ijk is the residual error. Interaction effect of the ith district with the jth sex was not statistically significant and was dropped out from the final model. Discriminant analysis model used to derive classification function for the female and male sample populations is shown below:
 $$\eqalign{Si &= {C_i} + {w_i}WST{\rm} + {w_i}WSU{\rm} + {w_i}BL{\rm} + {w_i}CC{\rm} + {w_i}SL{\rm} \cr & \quad + {w_i}SC{\rm} + {w_i}SPL{\rm} + {w_i}BW,}$$
where subscript ‘i’ denotes the respective group, C i is a constant for the i th group, w i is the weight of the corresponding variable in the computation of the classification score for the ith group, S i is the resultant classification score, WST is wing span at the top, WSU is wing span under, BL is body length, CC is chest circumference, SL is shank length, SC is shank circumference, SPL is spur length, and BW is body weight.
Flock performance data were also subjected to analysis-of-variance (ANOVA) procedure to identify sources of variance for reproductive and productive traits in hens and cocks (SPSS 20.0, 2011).
Results and discussion
Univariate analyses
Quantitative variation
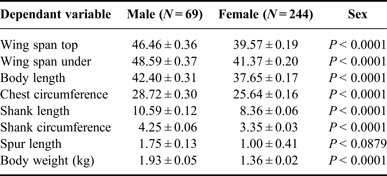
All quantitative variables except spur length (which was mainly absent in female) were highly significantly (P < 0.0001) affected by sex of the animal (Table 2) and the ANOVA on quantitative variables was performed separately for the two sexes.
Least-square means ± SE of quantitative body measurements (cm) for all districts by sex.

Quantitative variation in male sample populations
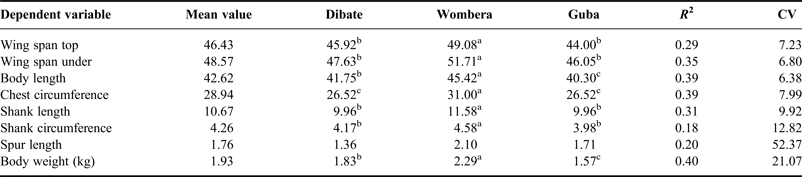
Phenotypic variation of all quantitative traits in males excluding spur length was highly significantly affected by district (Table 3). The highest coefficient of determination (R 2) was calculated for body weight showing that only 40 percent of the variability for this trait is explained by the model. The smallest (18 percent) coefficient of determination for shank circumference indicates that 82 percent of the variability in this trait is accounted for by other variables. Coefficient of variation ranged from 6.38 to 52.37 percent showing high heterogeneity in male sample populations.
Means of linear body measurements (cm), body weight (kg) and associated R 2 values for the male sample population by district.

a,b,cMeans with different superscripts within the same row are significantly (P < 0.05) different.
Pairwise comparisons of the means of variables between districts (Table 3) revealed that male sample populations from Wombera had the largest measurement values for all variables followed by chicken populations from Dibate. This indicates that the chicken populations sampled from the highland and mid-altitude areas were larger in their body weights and linear measurements than those sampled from the lowlands.
The importance of shank length in estimating live body weight was explained by (Dessie, Reference Dessie2003) who found positive phenotypic correlations (r p = 0.64–0.79) between the two traits. Shank length of males from Wombera (11.58 cm) was higher than cocks from Horro (11.32 cm) and Jarso (9.9 cm) (Aklilu et al., Reference Aklilu, Gebreyesus, Kebede and Dessie2014); 9.8 cm from Fogera (Kibret, Reference Kibret2008); 10.31 cm from Northwestern Ethiopia (Hassen, Reference Hassen2007). The average live body weight for cocks at Wombera (2.29 kg) was higher than the reported values for Horro (1.63 kg) and Jarso (1.45 kg) by Desta et al. (Reference Desta, Dessie, Bettridge, Lynch, Melese, Collins, Christley, Wigley, Kaiser, Terfa, Mwacharo and Hanotte2013) from Western and Eastern Ethiopia; from the central highlands (1.5 kg) by Yami and Dessie (Reference Yami and Dessie1997); from Amhara Region of Ethiopia (2.05 kg) by Hassen (Reference Hassen2007). The body weight of sampled chickens from Dibate (1.83 kg) was also higher than reported weight of 1.62 kg by Dana et al. (Reference Dana, Tadelle, Elisabeth and Johan2010) and 1.43 kg by (Melesse and Negesse, Reference Melesse and Negesse2011).
Quantitative variation in female sample populations
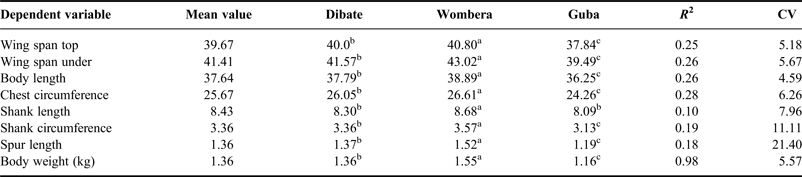
Similar to the male sample populations, the ANOVA showed that district had highly significant (P < 0.0001) effect on the total variation of all quantitative traits except shank length (P < 0.01) for female sample populations (Table 4). R 2 values ranged from 18 percent for spur length to 98 percent for body weight. Only 2 percent of the variability in body weight is accounted for by other variables and the model accounts for 98 percent of the variability for this trait. Small R 2 value for spur length indicates that the model fits the data poorly. Coefficient of variation ranged from 4.59 percent for body length to 21.4 percent for spur length showing larger variability in the latter trait.
Means of linear body measurements (cm), body weight (kg) and associated R 2 values for the female sample population.

a,b,cMeans with different superscripts within the same row are significantly (P < 0.05) different.
Pairwise comparisons between districts showed significant (P < 0.05) differences for all quantitative traits. Like male sample populations, female sample populations from Wombera highlands had the largest measurement. Shank length for the hens from the three districts (8 cm for Dibate, 8.68 cm for Wombera and 8.09 cm for Guba) were comparable with reported values for Horro (9.22 cm) and Jarso (8.51 cm) (Aklilu et al., Reference Aklilu, Gebreyesus, Kebede and Dessie2014) but slightly higher than that of 7.25 cm reported by Kibret (Reference Kibret2008).The average live weight of local adult hens in Dibate and Wombera were 1.36 and 1.55 kg, respectively, which was higher than reported values for 1.24 kg for Horro and 1.16 kg for Jarso (Desta et al., Reference Desta, Dessie, Bettridge, Lynch, Melese, Collins, Christley, Wigley, Kaiser, Terfa, Mwacharo and Hanotte2013); 1.04 kg for central highlands of Ethiopia (Yami and Dessie, 1997); and 0.85 kg for Amhara region of Ethiopia (Hassen, Reference Hassen2007). Higher live body weights for hens were reported from Uganda (1.4 kg) (Ssewannyana et al., Reference Ssewannyana, Ssali, Kasadha, Dhikusooka, Kasoma, Kalema, Kwatotyo and Aziku2008) and for Punjab brown chickens from India (1.57 kg) (Vij, Tantia and Vijh, Reference Vij, Tantia and Vijh2006). Live body weights are affected by genetic and environmental factors. The higher body weights recorded for Wombera chickens could be linked with better feed resources in the area and genetic introgression from improved (exotic) chicken breeds, which were present in a relatively higher number in the highlands.
Qualitative variation
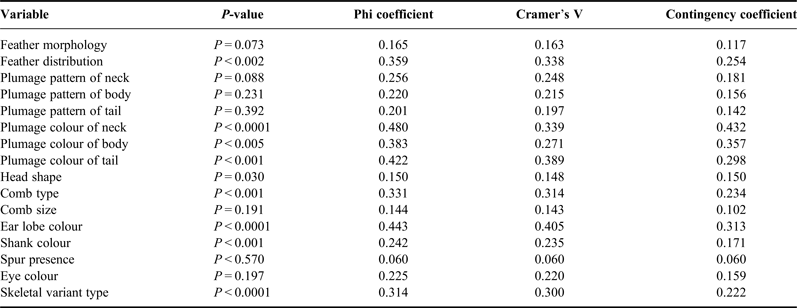
The χ 2 tests for plumage colour of the neck, ear lobe colour and skeletal variant of the feet were highly significant compared with those for feather distribution, plumage colour of body, plumage colour of tail, comb type and shank colour (Table 5). All the rest were not significant (P > 0.05). The least association of qualitative variable with district was observed for spur presence. The highest was for plumage colour of neck (0.48) using Phi coefficient, for ear lobe colour (0.41) using Cramer's V and for plumage colour of neck (0.43) using Contingency coefficient.
Chi-square tests and levels of association of districts with the qualitative variables.

Feather distribution
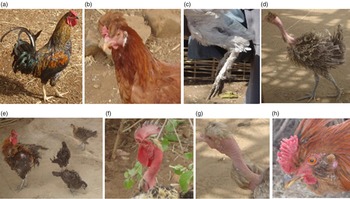
Normal and crested feathers (Figure 2a–h) were most common in all the three districts. In Dibate 47 crested chickens (44.8 percent), in Wombera 46 (43.4 percent) and in Guba 59 (57.8 percent) were sampled. The proportion of crested feather in this study is larger than the one reported by Desta et al. (Reference Desta, Dessie, Bettridge, Lynch, Melese, Collins, Christley, Wigley, Kaiser, Terfa, Mwacharo and Hanotte2013) in Horro (27.9 percent) and Jarso (4.1 percent) districts; Egahi et al. (Reference Egahi, Dim, Momoh and Gwaza2010), who reported 17.05 percent for Nigerian chicken; Ssewannyana et al., who reported 12 percent for Ugandan chicken; Dana et al. (Reference Dana, Tadelle, Elisabeth and Johan2010), who reported 34 percent for five chicken populations of Ethiopia; and Negassa, Melesse and Banerjee (Reference Negassa, Melesse and Banerjee2014) who reported 27.8 for hens sampled from Southeastern Oromia region of Ethiopia; but slightly smaller than Hassen (Reference Hassen2007) who reported 48.8 percent in Amhara region of Northwest Ethiopia.
Feather distribution: (a) normal, (b) crested, (c) feathered shank and feet, (d) naked neck and frizzle, (e) frizzle, (f) naked neck, (g) naked neck and crested, (h) muffs and beard.

Plumage colour of neck and body
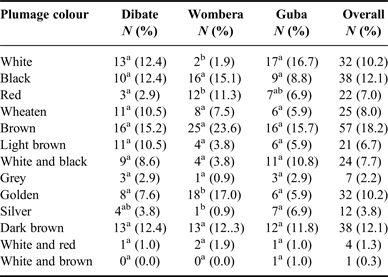
The village chickens displayed high diversity in plumage colour of the neck and the body, which varied significantly at (χ 2 < 0.05) across districts (Table 6). Most of the chickens had brown plumage colour on the neck (48.6 percent) and on the body (18.2 percent). Dana et al. (Reference Dana, Tadelle, Elisabeth and Johan2010) also found out brown as the predominant (19 percent) body plumage colour for five chicken populations of Ethiopia. Black and dark brown colours were the second prevalent plumage colours on the body (each 12.1 percent).
Variation of plumage colour of body in sample chicken populations.

a,b,abIndicated values among traits significantly differ at χ 2 < 0.05.
Comb type
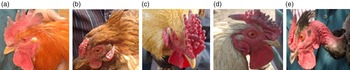
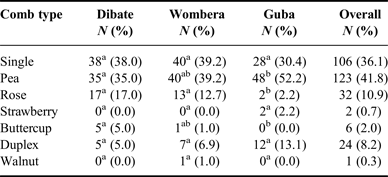
Seven types of comb shapes (single, pea, rose, and strawberry, buttercup, duplex and walnut) were observed in the three districts (Table 7 and Figure 3a–e). The proportion of the different types was significantly different (χ 2 < 0.05). Pea (41.8 percent), single (36.1 percent) and rose (10.9 percent) combs were the most common comb shapes across the three districts. This finding is in line with Dana et al. (Reference Dana, Tadelle, Elisabeth and Johan2010) and Dong Xuan et al. (Reference Dong Xuan, Szalay, Su, Tieu and Dang Vang2006) who reported 55 and 90 percent pea combs for Ethiopian and Vietnamese Dong Tao chickens, respectively. Hassen (Reference Hassen2007) correspondingly reported pea comb as the common variant in Northwestern Ethiopian chickens, while Moges, Melesse and Dessie (Reference Moges, Melesse and Dessie2010) found a similar result in Bure district of Amhara region in Ethiopia.
Comb types: (a) single, (b) pea, (c) duplex, (d) rose, (e) walnut.

Variation of comb type in sample chicken populations.

a,b,abIndicated values among traits significantly differ at χ 2 < 0.05.
Earlobe colour
We observed six types of earlobe colours and chickens with white and red earlobe had the highest proportion (46.3 percent) across the three districts. Red (24.9 percent) and white (20.4 percent) earlobes were also more frequent. This result disagrees with Desta et al. (Reference Desta, Dessie, Bettridge, Lynch, Melese, Collins, Christley, Wigley, Kaiser, Terfa, Mwacharo and Hanotte2013) who stated (40.7 percent) and (31.7 percent) of Horro and Jarso chicken populations from Ethiopia; and Orheruata, Adegite and Okpeku (Reference Orheruata, Adegite and Okpeku2006) who found (60 percent) of chicken populations from Edo State in Nigeria had red as their most dominant earlobe colour.
Shank colour
Three shank colour variants were observed in the study area. Slate blue/black was the commonest colour in Dibate (36.2 percent) and Guba (48 percent) districts and even from the overall population (39.3 percent) followed by white shank (31.6 percent). Slate blue was also the most prevalent phenotype among Beninese chickens (43.3 percent, Youssao et al., Reference Youssao, Tobada, Koutinhouin, Dahouda, Idrissou, Bonou, Tougan, Ahounou, Yapi-Gnaoré, Kayang, Rognon and Tixier-Boichard2010). Unlike our study populations, however, yellow was reported as the predominant shank colour by Hassen (Reference Hassen2007, 64.4 percent), Dana et al. (2010, 60 percent), Melesse and Negesse (Reference Melesse and Negesse2011, 52.5 percent) and Negassa, Melesse and Banerjee (Reference Negassa, Melesse and Banerjee2014, 80 percent of cocks) from different parts of Ethiopia.
Skeletal variants of the foot
Most of the sample populations (94.6 percent) had the wild-type foot skeleton. The frequency of chickens with extra toes was higher in Dibate (6.7 percent).
Multivariate analyses
Stepwise discriminant analysis
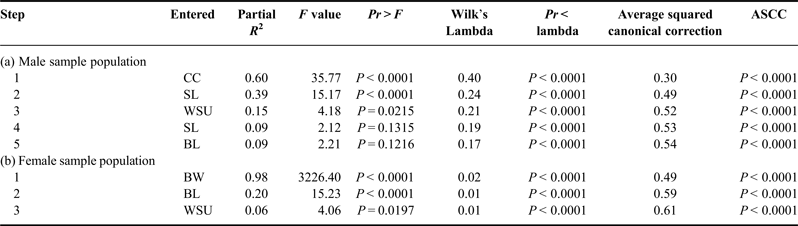
Eight quantitative variables for both sexes were separately subjected to the STEPDISC procedure of SAS (2003). Five variables for males and three variables for females were identified as the best discriminating variables on stepwise selection summary. Wilk's lambda test confirmed that all the selected variables had highly significant (P < 0.0001) contribution to discriminate the total population into separate groups. The variables with the highest discriminating power for males were chest circumference, shank length, wing span under, spur length and body length (Table 8a). Body weight, body length and wing span under were the three variables with superior discriminating power for female sample populations (Table 8b). The remaining five variables had poor discriminating power and were removed.
Stepwise selection summary indicating most discriminating variables for male and female sample populations.

Note: CC, chest circumference; SL, shank length; WSU, wing span under; SL, spur length; BL, body length; BW, body weight.
Discriminant analysis
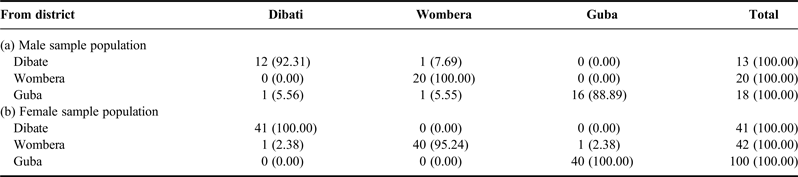
The correct classification for male sample population into their district ranged from 88.89 to 100 percent (Table 9a). The overall average error count estimate was 6.27 percent for all observations and 93.73 percent of the samples were correctly classified indicating the homogeneity of chicken populations within districts for those variables included in the discriminant analysis. Even higher correct classification percentages were calculated for female sample populations than males (Table 9b). All individuals were correctly classified within district for Dibate and Guba districts while 95 percent were correctly classified for Wombera. The overall correct classification percentage for female sample populations was 98.41.
Number of observations and percent classified (in bracket) in different districts using discriminant analysis.

Canonical discriminant analysis
The pairwise squared Mahalanobis distances between districts for male sample populations were highly significant (P < 0.0001) indicating that population from each district has distinct and measurable group difference for considered quantitative variables. The shortest distance was measured between Dibate and Wombera, while the longest distance (12.94) was between Wombera and Guba districts on those quantitative variables.
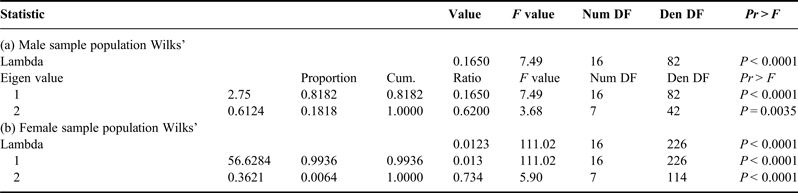
The univariate statistics testing the hypothesis that class means are equal shows that each quantitative variable in male sample populations except spur length is a highly significant (P < 0.0001) contributor to the total variation. The multivariate statistics for differences between the districts was also significant (P < 0.0001) (Table 10). Wilks’ lambda, the ratio of within-group variability to total variability on the discriminator variables, is an inverse measure of the importance of the discriminant functions. The Wilks’ lambda test for the male sample population was 0.1650. This reflects that most (83.5 percent) of the variability in the discriminator variables was because of the differences between populations rather than variation within the population.
Multivariate statistics and F approximation.

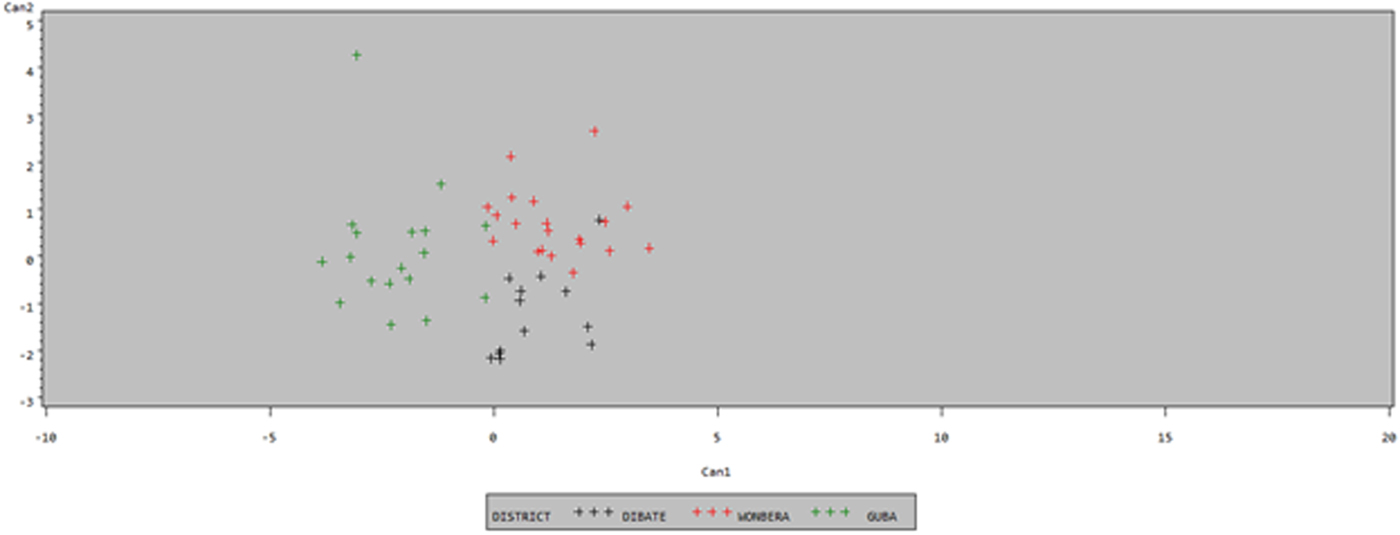
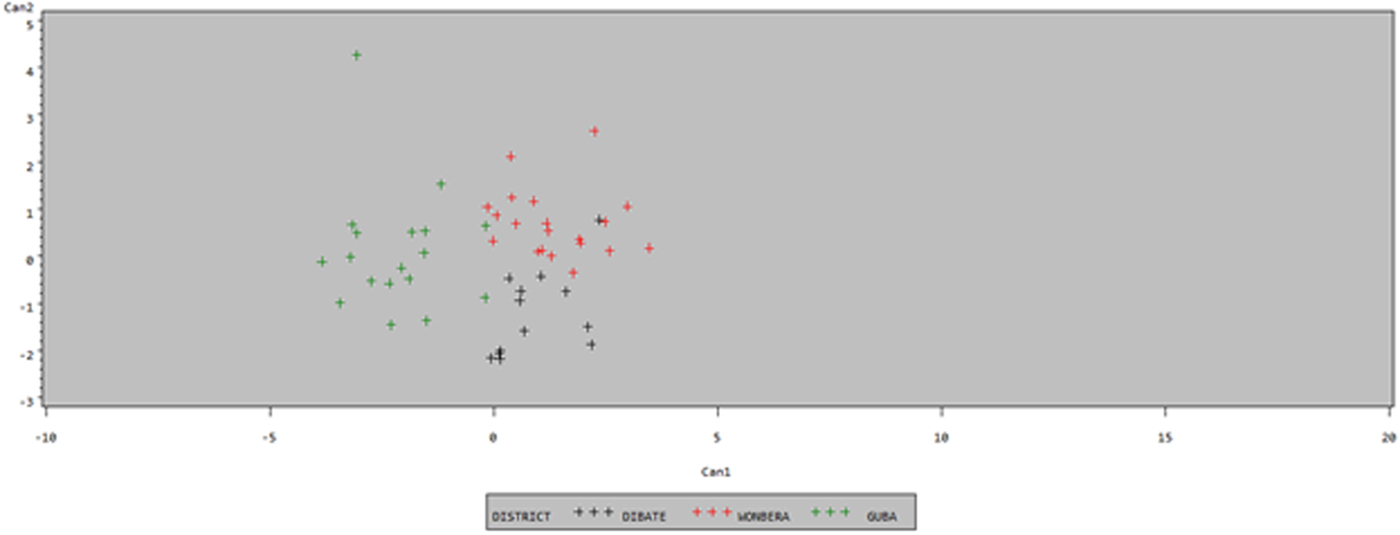
The canonical discriminant analysis extracted two canonical variates for male sample population, of which the first canonical variate (can 1) accounted for about 81.82 percent of the total variation (Table 10a). The remaining canonical variate accounted for only 18.18 percent of the total variance. The plot for the first canonical variate for male sample populations (Figure 4) depicts that can 1 discriminated between the two groups: (1) Guba, and (2) Dibatie and Wombera. Can2 poorly separated the three populations.
Plot of the two canonical variates for male sample populations.
The pairwise squared Mahalanobis distances for females were considerably higher than for males. The distances between districts for female sample populations were highly significant (P < 0.0001) between Guba and Dibate and between Guba and Wombera chicken populations. The distance between Dibate and Wombera was also significant (P < 0.01). The shortest distance was measured between Guba and Wombera (84.61). The longest was between Dibate and Guba (335.59) implying female sample populations from the two districts were much different in quantitative features under consideration.
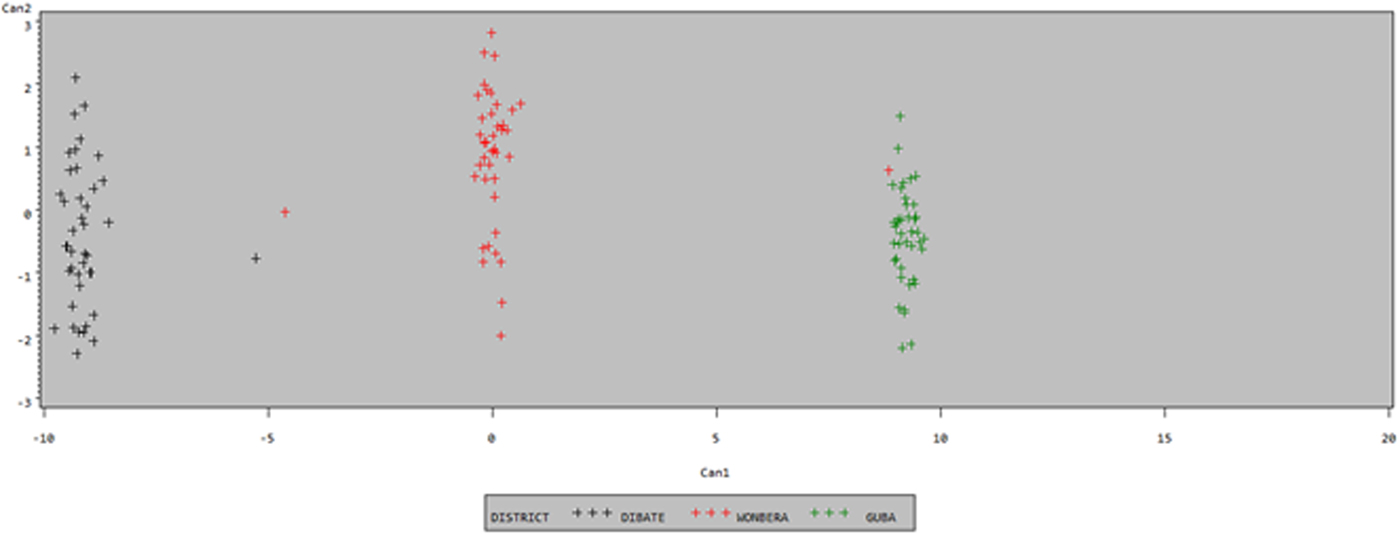
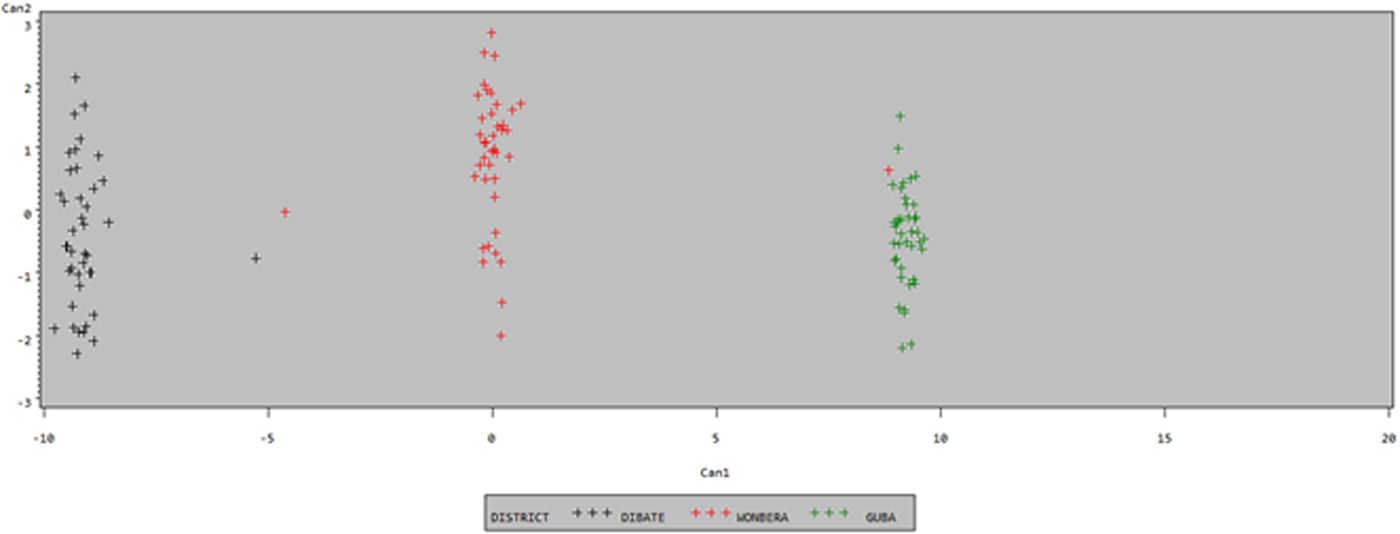
Two canonical variates were also extracted from canonical discriminant analysis on the female sample populations similar to the male population. The first canonical variate (can 1) explained 99.36 percent of the total variation, with the remaining one accounting for only 0.64 percent of the total variation (Table 10b). A plot of the first two canonical variables for the female sample populations (Figure 5) shows that Can1 clearly discriminated the three chicken populations. Can2 failed to make any discrimination among the chicken populations of the three districts.
Plot of the two canonical variates for female sample populations.
Non-parametric discriminant analysis
The overall hit ratio and the hit ratio for each sampling district obtained from non-parametric discriminant classification was 100 percent. Similar to the quantitative variables, the qualitative variables have classified the sample populations from the three districts into distinct groups.
Flock performance of chicken populations
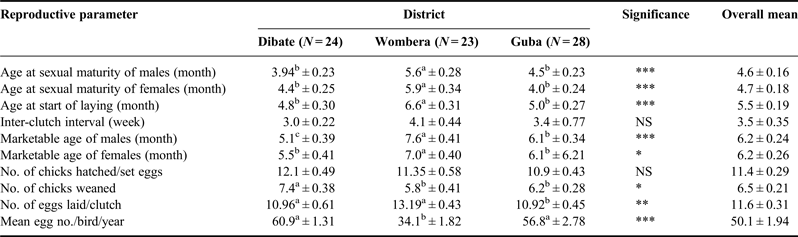
The means and overall means for flock performance are presented in Table 11. The age at sexual maturity and marketable age varied highly significantly across districts (P < 0.001) and were the highest at Wombera. In addition to the cold temperature with possible negative effect on growth rate (Blahova et al., Reference Blahova, Dobsikova, Strakova and Suchy2007), the low disease prevalence and better availability of feed may have allowed the farmers in these highland areas to sell their chickens at a later age. The mean number of eggs produced by a hen per year was the lowest (P < 0.001) for Wombera (34.1) and the highest for Dibate (60.9). This may be attributed to the high emphasis farmers put on incubation in the highland areas resulting in significant increase of broody cycle days. Eltayeb, Wani and Yousif (Reference Eltayeb, Wani and Yousif2010) also observed on native Sudanese chicken that broodiness significantly affected feed intake and egg production. Analysis on hen performance history as recalled by farmers revealed that mean number of chicks hatched/set eggs (11.4), number of chicks weaned (6.5) and egg number laid/bird/year (50.1) were higher than the findings of Dessie (Reference Dessie2003) who reported 9.3, 4.8 and 46.4 for the three reproductive parameters respectively as an average performance of five Ethiopian chicken ecotypes. The average number of eggs/clutch of local hens in the study population (11.6) was comparable with the 12 eggs produced in Burkina Faso (Kondombo, Reference Kondombo2005) but higher than that of 10 eggs/clutch reported by Mourad and Gbanamou (Reference Mourad and Gbanamou1997) in Guinea and 9 eggs/clutch by Kuit, Traore and Wilson (Reference Kuit, Traore and Wilson1986) in Mali. Hassen (Reference Hassen2007) reported an average productivity of 9–19 eggs/clutch with an average total egg production ranging from 18 to 57 eggs/year per hen for local hens in Northwest Ethiopia.
Flock performance of indigenous chicken populations in sample households (mean ± SE).

a,b,cMeans within a row followed by different superscripts show the presence of significant difference: significant level * = P < 0.05, ** = P < 0.01, *** = P < 0.001, NS, non-significant.
Conclusion
Univariate and multivariate analyses revealed that the chicken populations in the three districts of Metekel zone are significantly different in terms of qualitative and quantitative morphological traits and flock performance. Higher between populations and lower within population variation were observed. Chicken populations sampled from the highland and mid-altitude areas had larger linear and body weight measurements compared with those from the lowlands. In the absence of comparison of animals from the different districts raised in the same environmental conditions, however, it cannot be concluded that phenotypic differences have a genetic basis. All chicken populations in the study area were extensively managed and their on-farm reproductive and productive performances generally low, implying the need for interventions in management and genetics.
Acknowledgements
This study was financed by the Food and Agriculture Organization of the United Nations (FAO) and the Ethiopian Biodiversity Institute (EBI) through the Funding Strategy for Implementation of the Global Plan of Action. Visited farmers kindly allowed us to sample their chickens. Staff at District Offices of Agriculture facilitated the fieldwork. We would also like to thank anonymous reviewers and journal editor(s) for their valuable comments.
Conflict of interest
No conflict of interest was identified in this study.