1. Introduction
The last glacial maximum (LGM) that occurred at c. 21 ka ago represents the maximum extent of the most recent ice age in Earth’s history. Due to the large-scale development of ice sheets in the Northern Hemisphere, global surface temperatures experienced drastic cooling, atmospheric greenhouse gas concentrations were significantly lower than the present day, and the weather was extremely cold and dry at that time. The LGM is therefore an ideal period for studying the dynamics of glacial climates. During the LGM, c. 24% of the Earth’s land surface was covered with ice sheets compared with 11% in the present day. The surface temperature of Antarctica was 10° lower than the present day, while the surface temperature of Greenland was 20° lower. Sea-level height was more than 120 m lower than the present day (CLIMAP Project members, 1981; Clark et al. Reference Clark, Dyke, Shakun, Carlson, Clark, Wohlfarth, Mitrovica, Hostetler and McCabe2009). Due to the effects of changes in climate and dust source regions, dust emissions during the LGM were extremely high. In general, dust emissions during the glacial periods were significantly higher than those during interglacial periods (Petit et al. Reference Petit, Mounier, Jouzel, Korotkevich, Kotyakov and Lorius1990). Ice core, loess and marine sediment records show that the mean global dust concentration during the glacial period was approximately 3–4-fold higher than that of the Holocene period (Kohfeld & Harrison, Reference Kohfeld, Graham, De Boer, Sime, Wolff, Le Quéré and Bopp2001; Maher et al. Reference Maher, Prospero, Mackie, Gaiero, Hesse and Balkanski2010), approximately 2–3-fold higher in tropical regions (Winckler et al. Reference Winckler, Anderson, Fleisher, McGee and Mahowald2008; Kohfeld et al. Reference Kohfeld and Harrison2013; Lamy et al. Reference Lamy, Gersonde, Winckler, Esper, Jaeschke, Kuhn, Ullermann, Martine-Garcia and Kilian2014) and a maximum of 20–30-fold higher in polar regions (Steffensen, Reference Steffensen1997; Lambert et al. Reference Lambert, Delmonte, Petit, Bigler, Kaufmann, Hutterli, Stocker, Ruth, Steffensen and Maggi2008, Reference Lambert, Kug, Park, Mahowald, Winckler, Abe-Ouchi, O’ishi, Takemura and Lee2013). Asian dust activities during the LGM were abnormally high and were mainly manifest as increased dust emissions and the expansion of desert boundaries (Zhang et al. Reference Zhang, Arimoto and An1997). Given the direct and indirect effects of dust suspended in the atmosphere on the surface energy balance (Shell & Somerville, Reference Shell and Somerville2007; Yue et al. Reference Yue, Wang, Liao and Jiang2011) and precipitation by changing the size and lifespan of cloud droplets (Levin & Ganor Reference Levin, Ganor, Guerzoni and Chester1996), it is reasonable to speculate that large amounts of dust may have played a significant role in the formation of glacial climate. In fact, the geological records show that changes in dust concentrations and fluctuations in Earth’s temperature have an obvious corresponding relationship (Petit et al. Reference Petit, Mounier, Jouzel, Korotkevich, Kotyakov and Lorius1990; Fischer et al. Reference Fischer, Fundel, Ruth, Twarloh, Wegner, Udisti, Becagli, Castellano, Morganti, Severi, Wolff, Littot, Röthlisberger, Mulvaney, Hutterli, Kaufmann, Federer, Lambert, Bigler, Hansson, Jonsell, Angelis, Bountron, Siggaard-Andersen, Steffensen, Barbante, Gaspari, Gabrielli and Wagenbach2007; Bar-Or et al. Reference Bar-Or, Erlick and Gildor2008), that is, periods with high (low) dust concentrations correspond to glacial or cold (interglacial or warm) periods. Compared with the present day the climate boundary conditions of the LGM are significantly different, such as the presence of large high-latitude ice sheets, increased erosion of underlying surfaces in dust source regions, lower atmospheric greenhouse gas contents, lower sea level and differences in Earth’s orbital parameters. However, the effects of these different forcing factors on the climate during the LGM (temperature, precipitation, atmospheric circulation) and dust cycles are not completely understood and require further clarification (Braconnot et al. Reference Braconnot, Harrison, Kageyama, Bartlein, Masson-Delmotte, Abe-Ouchi, Otto-Bliesner and Zhao2012).
With the rapid development of climate numerical models in recent years, particularly those coupled with the dust cycle module including dust emission, transport and deposition processes, great progress has been made in simulating the LGM climate changes from the geological records (Pinot et al. Reference Pinot, Ramstein, Harrison, Prentice, Guiot, Stute and Joussaume1999; Li et al. Reference Li, Pan and Liu2016). The effects of dust aerosols on the glacial climate evolution (e.g. Harrison et al. Reference Harrison, Kohfeld, Roelandt and Claquin2001; Claquin et al. Reference Claquin, Roelandt, Kohfeld, Harrison, Tegen, Prentice, Balkanski, Bergametti, Hansson, Mahowald, Rodhe and Schulz2003; Mahowald et al. Reference Mahowald, Yoshioka, Collins, Conley, Fillmore and Coleman2006) have also attracted widespread attention. Numerical simulation results show that the integrated effects of various forcing factors during the LGM caused dust aerosol concentrations to be globally 3-fold higher than the present day and more than 20-fold higher in local regions (Mahowald et al. Reference Mahowald, Yoshioka, Collins, Conley, Fillmore and Coleman2006; Albani et al. Reference Albani, Mahowald, Delmonte, Maggi and Winckler2012). Both observations (Kang et al. Reference Kang, Roberts, Wang, An and Wang2015) and simulations (Werner et al. Reference Werner, Tegen, Harrison, Kohfeld, Prentice, Balkanski, Rodhe and Roelandt2002) have shown that Asian inland dust activities during the LGM increased significantly, and some modelling studies have shown that the increased dust content in Asia may have depended on the expansion of the source region (Shi et al. Reference Shi, Liu, An, Yi, Yang and Mahowald2011), vegetation degeneration (Hopcroft & Valdes, Reference Hopcroft and Valdes2015) or increased atmospheric circulation (Unterman et al. Reference Unterman, Crowley, Hodges, Kim and Erickson2011). However, the relative contributions of different forcing factors on the Asian dust cycle during the LGM and their dynamic mechanisms are not yet completely understood. We therefore conducted a series of sensitivity experiments by using an Earth system model to further explore the effects of high-latitude ice sheets, erosion in the dust source region and other factors on the Asian dust cycle. This may help to provide an improved understanding of the glacial Asian dust activity patterns and related mechanisms.
2. Numerical model and experimental design
2.a. Numerical model
The Community Earth System Model (CESM) used in this paper was released by the US National Center for Atmospheric Research in 2010. The CESM is composed of six modules, namely the Community Climate System Model (CAM), Community Land Model (CLM), Parallel Ocean Program (POP), Community Sea-Ice Component (CICE), Community Land-Ice Component, and Coupler. The CESM was based on the Community Climate System Model and is currently one of the most advanced air–sea coupled models in the world (Hurrell et al. Reference Hurrell, Holland, Gent, Ghan, Kay, Kushner, Lamarque, Large, Lawrence, Lindsay, Lipscomb, Long, Mahowald, Marsh, Neale, Rasch, Vavrus, Vertenstein, Bader, Collins, Hack, Kiehl and Marshall2013). In this paper, we used the latest version of CESM1.2. The modules used in this paper are CAM4, CLM4, POP2, CICE4 and Coupler6. The horizontal resolutions of CAM4 and CLM4 are 0.9×1.25, and the vertical directions contain 26 and 15 layers, respectively. The POP2 and CICE4 horizontal resolutions are 0.5×0.5, and the vertical direction contains 40 layers.
In order to analyse the dust cycle activity process, all numerical experiments were carried out using the bulk aerosol model parameterization (BAM) module in CAM4, which is known as CAM4-BAM (Neale et al. Reference Neale, Chen, Gettelman, Lauritzen, Park, Williamson, Conley, Garcia, Kinnison, Lamarque, Marsh, Mills, Smith, Tilmes, Vitt, Cameron-Smith, Collins, Iacono, Easter, Ghan, Liu, Rasch and Taylor2010). In the model, the dust particle distribution comprises four grain sizes: 0.1–1.0, 1.0–2.5, 2.5–5.0 and 5.0–10.0 µm. Analysis conducted by Albani et al. (Reference Albani, Mahowald, Perry, Scanza, Zender, Heavens, Maggi, Kok and Otto-Bliesner2014) showed that the CAM4-BAM simulation of the dust cycle and radiation forcing had some errors; the grain size proportions in dust emissions, rate of soil erosion, and the short- and long-wavelength optical characteristics of sand were adjusted to improve the accuracy of the simulation results (Xie et al. Reference Xie, Liu, Che, Xie, Wang, Li, Shi and Liu2018). In this paper, the improved CAM4-BAM (Albani et al. Reference Albani, Mahowald, Perry, Scanza, Zender, Heavens, Maggi, Kok and Otto-Bliesner2014; Xie et al. Reference Xie, Liu, Che, Xie, Wang, Li, Shi and Liu2018) was used.
2.b. Experimental design
We conducted six experiments, including a modern controlled experiment, a full-forcing LGM experiment and four sensitivity experiments. The latest improved version of CAM4-BAM (Albani et al. Reference Albani, Mahowald, Perry, Scanza, Zender, Heavens, Maggi, Kok and Otto-Bliesner2014) was used for the calculation of surface dust activity (including the effects of surface dust erosion and distribution of vegetation types). In the modern controlled experiment (CTL), the values of all forcing factors such as the Earth’s orbital parameters, the abnormal characteristics of surface erosion in the dust source region and the extent of high-latitude ice sheets are contemporary, and the atmospheric greenhouse gas concentrations are set at pre-industrial values (i.e. atmospheric CO2 concentration of 284 ppm, CH4 concentration of 791 ppb and N2O concentration of 275 ppb). The modern controlled experiment uses current surface conditions predicted by the CESM model as the abnormal surface erosion factor (Mahowald, Reference Mahowald2007). In the full-forcing LGM experiment (ExpA), the orbital parameters, greenhouse gas concentrations, abnormal surface erosion and high-latitude ice-sheet factors are reconstructed for the period of the LGM. The abnormal surface erosion and its corresponding calculation of surface dust activity are from Albani et al. (Reference Albani, Mahowald, Perry, Scanza, Zender, Heavens, Maggi, Kok and Otto-Bliesner2014). Figure 1 shows the high-latitude ice-sheet distribution and height above sea level (ASL) of the modern controlled and ExpA experiments. During the LGM, Euramerica was covered by large areas of ice sheets; maximum ice-sheet thickness was > 3000 m (Fig. 1).
(Colour online) Ice sheet (shaded blue) distribution and height above sea level (red contours, kilometres) in (a) the modern controlled simulation (CTL) and (b) ExpA.

The first sensitivity experiment was an orbital forcing experiment (Exp1) in which the LGM orbital parameters factor (i.e. the change in solar radiation caused by the Earth’s orbital parameters) was considered while the greenhouse gas concentrations, extent of high-latitude ice sheets and abnormal surface erosion factors were as for the modern controlled experiment. LGM greenhouse gas concentrations as well as LGM orbital parameters were included in the second sensitivity experiment (Exp2), in which abnormal surface erosion and high-latitude ice-sheet extent were as for the modern controlled experiment. In Exp2, levels of carbon dioxide, methane and nitrous oxide levels were 185 ppm, 350 ppb and 200 ppb, respectively. In the third experiment (Exp3), the dust source region forcing experiment, the LGM abnormal surface erosion factor was included with LGM greenhouse gas concentrations and LGM orbital parameters, with present-day high-latitude ice-sheet extent. In the fourth experiment (Exp4), the ice-sheet forcing experiment, the LGM high-latitude ice-sheet extent as well as LGM greenhouse gas concentrations and LGM orbital parameters were used, with the present-day abnormal surface erosion. In Exp4, the high-latitude ice-sheet distribution was represented by ICE6Gv2 data (Peltier, Reference Peltier2009), obtained from Paleoclimate Modeling Intercomparison Project 3 (PMIP3)/Coupled Model Intercomparison Project 5 (CMIP5).
Table 1 summarizes the numerical experiments and their major forcing factors. In order to achieve stable and reliable experimental results, all numerical experiments were continuously integrated for 50 years; the average for the last 20 years was used for our analysis.
Name of numerical experiments and driving factors. PD – present day; PI – pre-industrial; LGM – last glacial maximum

3. Climate and dust cycle at the LGM
3.a. Climate differences
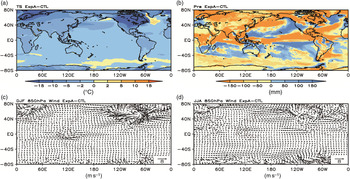
There were many differences in climate properties during the LGM compared with the present-day climate (Fig. 2). The global surface temperatures during the LGM were all lower than those of the present day; the differences in LGM and present-day temperatures in North America and Europe were the greatest at > 15°, while the temperature difference in equatorial regions was < 2°. This is similar to the results of a previous study (Weaver et al. Reference Weaver, Eby, Fanning and Wiebe1998). Global precipitation during the LGM was also significantly lower than compared with the present day; annual precipitation on land and at the equator was, on average, > 150 mm less than that of the present day. Only mid-latitude oceans had small areas with higher precipitation than that recorded today. It is noted that the difference in surface temperature and precipitation are significant almost everywhere globally (not shown in the figures). The LGM low-altitude wind speeds during winter (December to February, DJF) and summer (June to August, JJA) were also different from those of the present day. In particular, the wind fields of ice-sheet-covered North America and Europe were significantly greater than those of the present day. It should be noted that, compared with the present day, the LGM East Asian winter monsoon was significantly stronger (Fig. 2c) while the summer monsoon was weaker (Fig. 2d). This result is consistent with the results of a previous study (Jiang et al. Reference Jiang, Tian, Lang, Kageyama and Ramstein2015).
(Colour online) Difference in (a) average annual surface temperature (TS, °C), (b) precipitation (Pre, mm), and (c) winter and (d) summer 850 hPa wind fields (m s–1) between ExpA and the modern controlled simulation (CTL). DJF – December, January, February; JJA – June, July, August.

3.b. Dust cycle differences
Due to the joint effects of the orbital parameters, greenhouse gas concentrations, abnormal surface erosion and high-latitude ice-sheet extent, the dust emission flux (DSTSF) and column content (DSTCC) during the LGM were significantly different from those of the contemporary climate. The LGM dust emission fluxes in the major dust emission regions of the world were significantly stronger than those of the present day (Fig. 3a). Among these regions, Asia is the region with the most significant difference in dust emissions worldwide. In comparison, in North Africa, the difference between the LGM and present-day emission flux is relatively small. Dust column concentrations in the Asian dust source region was significantly higher during the LGM, but dust column concentrations in North Africa during the LGM were lower (Fig. 3b) with a maximum difference value of −0.06 kg m–2. This could be a model error or an error in the reconstruction of surface erosion in the North African source region for the LGM. Large areas of dust emission zones also appeared in the Bering Strait, and dust emission in southern Europe and arid regions in Central Asia were also significantly higher than for the present day. The differences between LGM and present-day dust emission flux and column concentration in Figure 3 have statistical significance above the 99% level.
(Colour online) Difference in (a) average annual surface dust emission flux (DSTSF, g a–1) and (b) column content (DSTCC, kg m–2) between ExpA and the modern controlled simulation (CTL).

Table 2 provides the global, Asian and North African annual dust emissions as predicted from the modern controlled (2600.54, 299.04 and 1590.96 Tg a–1, respectively) and ExpA (7099.81, 1348.64 and 1488.38 Tg a–1, respectively) experiments. The simulation results are generally reasonable, but the annual dust emission flux was slightly higher than that measured in previous studies (Ginoux et al. Reference Ginoux, Chin, Tegen, Prospero, Holben, Dubovik and Lin2001; Werner et al. Reference Werner, Tegen, Harrison, Kohfeld, Prentice, Balkanski, Rodhe and Roelandt2002; Zender et al. Reference Zender, Miller and Tegen2004; Tanaka & Chiba Reference Tanaka and Chiba2006). For example, Liu et al. (Reference Liu, Zhao, Liu, Han and Xiong2014) measured a global dust emission of c. 1000–2100 Tg a–1, which may have been caused by the simulation results of individual regions being lower. Global dust emissions during the LGM were 2.73-fold higher than those of the present day. Asian dust emissions during the LGM were 4.51-fold higher than those of the present day, whereas North African dust emissions were slightly lower. It can be seen that Asian dust activities during the LGM period contributed greatly to global dust emission, and we can calculate this changing contribution. From the data in Table 2, the Asian dust emission contribution fell from 19.00% during the LGM (ExpA) to 11.50% in the present day (modern controlled).
Annual global, Asian (25–50° N, 70–110° E) and North African (10–35° N, 20° W–50° E) dust emission fluxes (Tg a–1) calculated from the modern controlled simulation (CTL) and full-forcing simulation (ExpA)

The arid and semi-arid regions of Asia and North Africa are the world’s two largest dust source regions, and the North Pacific (adjacent to Eurasia) is often considered to be an important deposition region for Asian dust. Figure 4 shows the dust emission flux for Asia and North Africa, as well as seasonal changes in dust column content in the North Pacific, from the ExpA and modern controlled simulations and their difference. It can be seen that dust emission and dust concentrations in the Asian source region and North Pacific show significant seasonal changes, that is, dust emissions during spring (March to May, MAM) are highest, followed by autumn, and winter has the lowest dust emissions. Dust emissions during spring and autumn were higher in the ExpA simulation than for the modern controlled experiment. In contrast, the seasonal changes in North African dust emissions are relatively lower, with higher dust emissions during winter and spring and lower dust emissions during summer and autumn. Comparing the LGM with the present day, it can be seen that spring LGM dust emissions were significantly higher while summer and autumn LGM dust emissions were significantly lower than those for the present day.
(Colour online) Seasonal dust emission fluxes (g m–2 d–1) in (a) Asia and (b) North Africa, and (c) dust column content (kg m–2) in North Pacific and their differences with respect to the present-day values (CTL).

In the following sections we analyse the effects of the different forcing factors on Asian dust emissions during the LGM, and discuss the relevant properties of the climate and atmospheric circulation compared with those of the present day.
4. Effects of different forcing factors on the LGM dust cycles
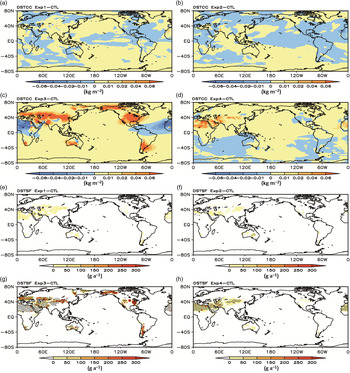
The various forcing factors make different contributions to regional dust emissions. Figure 5 depicts the differences in annual dust column contents (a–d) and emission fluxes (e–h) between the modern controlled simulation and the Exp1, Exp2, Exp3 and Exp4 simulations, respectively. We can see that the contribution of the abnormal surface erosion to dust emission flux (Fig. 5g) is significantly different from that of the high-latitude ice-sheet extent (Fig. 5h). The dust column content in the Sahara Desert in North Africa and its western coastal regions was lower in comparison with that of the present day, whereas the dust column content in other regions in the world was higher during the LGM. A belt of significantly higher dust column concentrations was evident from southern Europe to northern China during the LGM. In addition, the Bering Strait, North America, western Australia and southern South America also showed higher dust column concentrations compared with the present day. Under the effects of forcing by high-latitude ice sheets (Exp4), global inland dust emissions were higher during the LGM compared with present day. These regions are mainly located in mid-latitude arid and semi-arid regions. Among these regions, higher dust column concentrations were observed in arid and semi-arid regions in Central Asia and North Africa (Fig. 5d) and slightly higher dust concentrations were observed in the Southern Hemisphere during the LGM. Compared with the results of Exp3 and Exp4, dust concentration differences between modern controlled and Exp1 (Fig. 5a) and Exp2 (Fig. 5b) simulations were not significant. However, when considering the LGM abnormal surface erosion (Fig. 5c) and high-latitude ice-sheet (Fig. 5d) factors, dust concentrations in Asia were observed to be higher than for the present day. The Asian dust emission flux calculated from the four different forcing experiments was 1.04-, 1.02-, 3.77- and 1.26-fold higher during the LGM than that of the present day.
(Colour online) Differences in (a–d) annual dust column content (DSTCC, kg m–2) and (e–h) emission flux (DSTSF, g a–1) between the four forcing simulations and the modern controlled simulation (CTL). The areas highlighted with angled lines in (e–h) represent those with statistical significance above the 99% level.

Table 3 lists the global, Asian and North African mean annual dust emission flux results for the four sensitivity numerical experiments. Exp1 shows that the orbital parameters forcing yielded values for global, Asian, and North Africa annual mean dust emission flux that are comparable to or slightly higher than that of the present day. This is mainly because the LGM orbital parameters are similar to that of the present day. In Exp2, LGM greenhouse gas concentrations were significantly lower than those of the pre-industrial period, meaning that the climate was cooler. However, as Exp2 did not include the abnormal surface erosion factor, dust activity was not significantly higher, and the dust emission fluxes from the Asian and North African source regions were either comparable to or slightly lower than those of the present day. Exp3 considered the LGM abnormal surface erosion, and the dust emission flux was significantly increased and even exceeded that observed in ExpA. The global and Asian mean dust emission fluxes were 2.85- and 3.77-fold higher, respectively, than those of the present day, whereas the North African dust emission flux was reduced. Dust emission may have been higher in Exp3 than in ExpA because Exp3 did not consider the high-latitude ice-sheet extent in the Northern Hemisphere, and the relatively barren, arid land acts as a source of dust emissions. It can be seen that dust emissions in Asia are significantly increased when abnormal surface erosion during the LGM is taken into consideration. Compared with ExpA, the global and Asian dust emission fluxes in Exp4 were 1.25- and 1.26-fold higher, respectively, than those of the present day, and the North African dust emission flux in Exp4 was 1.27-fold higher than that of the present day. In other words, the high-latitude ice-sheet forcing experiment was observed to increase global dust emissions by 25%. The abnormal surface erosion factor in Asia is the main reason that Asian dust emissions were observed to be higher by a factor of 3.77 during the LGM.
Global, Asian and North African annual dust emission fluxes (Tg a–1) calculated from the four sensitivity simulations, Exp1–Exp4

Quantitatively, when considering the four forcing factors individually (Table 3) their effect on Asian dust emissions are as follows: orbital parameters (Exp1 relative to the modern controlled simulation), 3.64%; greenhouse gas concentrations (Exp2 relative to Exp1), –1.80%; abnormal surface erosion (Exp3 relative to Exp2), 270.60%; and high-latitude ice-sheet extent (Exp4 relative to Exp2), 23.61%. The respective figures for the effect of the four forcing factors considered individually on global dust emissions are 2.02%, –2.89%, 25.86% and 25.86%. The effect of abnormal surface erosion on Asian dust emissions was greater than that of the high-latitude ice-sheet extent during the LGM, while these factors were not significantly different in North Africa.
The various forcing factors also have different seasonal effects on dust activities. Figure 6 shows the seasonal changes in the Asian dust emission flux (a) and North Pacific dust column content (c) from the four sensitivity experiments, and their difference from the modern controlled simulation (b and d, respectively). Results show that the Exp3 calculation of the Asian dust emission was slightly lower than that for ExpA, and the dust emission fluxes calculated from Exp4 were far lower than those of ExpA and Exp3 but slightly higher than those of the modern controlled simulation. The Exp2 and Exp1 results were comparable to those of the modern controlled experiment. The seasonal changes in dust concentrations in the North Pacific are similar to the Asian source region, that is, highest concentration during spring and lowest concentration during winter. These results showed that the degree of erosion of underlying surfaces in Asian source regions directly determines the Asian dust emission flux. Temperature cooling caused by high-latitude ice sheets increased Asian dust emissions, while the effects of changing greenhouse gas concentrations and orbital parameters are minor.
(Colour online) Seasonal changes in (a) Asian dust emission flux (g m–2 d–1) and (c) North Pacific dust column content (g m–2), and (b, d) their respective differences from the modern controlled simulations (CTL).

In contrast to Asian dust emissions, the seasonal changes in North African dust emissions are not significant (data not shown). Among all forcing factors, the dust emission flux caused by the extent of high-latitude ice sheets was the highest, while the dust emission flux caused by the abnormal surface erosion was the lowest. Regarding seasonal changes, summer and autumn dust emission differences caused by high-latitude ice-sheet extent were slightly higher than those in spring and winter.
As the two major dust source regions in Asia, the Taklimakan Desert and Badain Jaran Desert (Sun et al. Reference Sun, Zhang and Liu2001; Uno et al. Reference Uno, Yumimoto, Shimizu, Hara, Sugimoto, Wang, Liu and Winker2008) have large differences in dust emission, transport and deposition properties (Chen et al. Reference Chen, Huang, Li, Jia, Jiang, Kang, Ma and Xie2017; Huang et al. Reference Huang, Minnis, Chen, Huang, Liu, Zhao, Yi and Ayers2008). We have compared the seasonal changes of dust column content in the Taklimakan and Badain Jaran deserts caused by different forcing factors (Fig. 7). In the Taklimakan region, dust concentrations gradually increased from winter to summer, with summer showing the highest dust concentration in the year. In the Badain Jaran region, dust concentrations were the highest during spring followed by autumn, and winter had the lowest concentration. Seasonal changes in the Taklimakan and Badain Jaran dust concentrations were significant. The effects of the different forcing factors on dust concentrations were greater for abnormal surface erosion and high-latitude ice-sheet extent in both dust source regions.
(Colour online) Seasonal changes in dust column content (kg m–2) for (a) Taklimakan Desert and (c) Badain Jaran Desert, and (b, d) their respective differences from the modern controlled simulations (CTL).

5. Climate and atmospheric circulation changes associated with the dust cycle
5.a. Global climate differences associated with the dust cycle
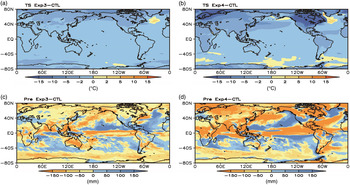
Extreme drought and cold climate are the major characteristics of the LGM. The results of multi-model comparison show that the Northern Hemisphere high-latitude ice-sheet extent and other factors caused the global mean surface temperature to be lower than that of the present day by 4.4°C. A temperature decrease of 1°C has been reported to cause global mean precipitation and monsoon precipitation to decrease by 2.26% and 2.11%, respectively (Yan et al. Reference Yan, Wang and Liu2016). A comparison of the ExpA and modern controlled experiment results shows that the global mean surface temperature during the LGM was lower than the present day by 2.89°C, and the mean global precipitation was lower than the present day by 69.80 mm (Fig. 2b). Reduced precipitation is an important factor in increasing the dust cycle, but the effects of the various forcing factors are different. Figure 8 shows the differences in surface temperature (a and b) and precipitation (c and d) in Exp3 and Exp4 compared with the output of the modern controlled simulation, respectively. In Exp3, the global mean surface temperature and precipitation were lower than the present day by 1.39°C and 26.79 mm, respectively. In Exp4, the global mean surface temperature and precipitation were lower than the present day by 2.88°C and 68.77 mm, respectively. The LGM abnormal surface erosion factor caused a significant reduction in precipitation compared with the present day, and had a slightly lower effect than the forcing caused by the high-latitude ice-sheet extent. Increased high-latitude ice-sheet extent and higher dust emissions will cause global surface cooling, thereby weakening the global water cycle and aggravating aridification.
(Colour online) Differences from modern control simulation (CTL) in annual surface temperature (TS, °C) for (a) Exp3 and (b) Exp4 and in precipitation (Pre, mm) for (c) Exp3 and (d) Exp4.

The different levels of solar radiation caused by the different orbital parameters during the LGM are small compared with the present day. The global mean surface temperature and precipitation calculated in Exp1 are therefore similar to those of the present day (higher by 0.12°C and 0.39 mm, respectively). Exp2 results show that the global mean surface temperature and precipitation were lower than those in the present day (by 1.32°C and 23.46 mm, respectively), similar to the results of Exp3. However, there were no significant differences between dust emission calculated for Exp2 and the present-day values. Lower greenhouse gas concentrations meant that precipitation and surface temperature were much lower during the LGM. However, as Exp2 did not include the abnormal surface erosion and high-latitude ice-sheet forcing factors, no large differences in dust emissions were calculated. In other words, although the concentration of atmospheric greenhouse gases was lower during the LGM, the effect of this on dust emission is lower than that of the high-latitude ice-sheet distribution and the characteristics of surface erosion in the dust source region.
5.b. Climate differences in the Asian dust source region
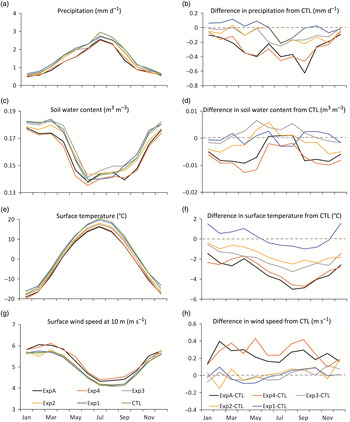
Precipitation, temperature, soil moisture and surface wind speed are all major climatic factors that determine dust emissions. Generally speaking, lower precipitation and soil water content, colder surface temperatures and stronger wind speeds will increase dust emissions and vice versa. Figure 9 depicts the seasonally changing climatic factors in the Asian source region calculated according to the various simulations (Fig. 9a, c, e, g), and the differences between these simulations and that of the modern controlled simulation (Fig. 9b, d, f, h). Regarding seasonal changes, precipitation and surface temperature in Asian dust source regions gradually increase from winter to summer and gradually decrease from summer to winter, while seasonal changes in the soil water content and the surface wind speed at 10 m (U10) follow the opposite pattern. The highest values of the soil water content and surface wind speed are observed in spring, the most likely time for dust storms.
(Colour online) Seasonal evolution of (a) precipitation (mm d–1), (c) soil water content (m3 m–3), (e) surface temperature (°C) and (g) surface wind speed at 10 m (U10, m s–1), and (b, d, f, h) their respective differences from the modern controlled simulations (CTL).

The differences in modelled climate parameters when different forcing factors were taken into account were significant. The observed variations in climate parameters were greatest when comparing data predicted by Exp4 and the modern controlled simulation, that is, incorporating the LGM high-latitude ice-sheet extent had the greatest effect on precipitation, surface temperature, soil water content and surface wind speed in the dust source regions. Precipitation, soil water content and surface temperature were significantly lower and surface 10-m wind speed was higher as calculated by Exp4 relative to the modern controlled simulation. The effects of the abnormal surface erosion (Exp3) on precipitation and surface temperature were greater than the forcing of the high-latitude ice-sheet extent, and seasonal changes were similar to those observed for Exp4. In contrast, the effect of considering abnormal surface erosion was to calculate higher spring and summer soil moisture content in the dust source region compared with present-day conditions, while the difference in surface wind speed was not significant. Considering LGM greenhouse gas concentrations (Exp2) generated lower surface temperatures in Asian dust source regions, but these differences were lower than those seen in Exp3 and Exp4. Results from Exp2 yielded similar surface wind speeds to those calculated from the modern controlled simulation. The forcing effects of the orbital parameters were the smallest among all forcing factors, yielding values for precipitation, surface temperature, soil water content and surface wind speeds similar to those of the present day. The simulation incorporating high-latitude ice-sheet extent (Exp4) generated higher precipitation, lower soil moisture, lower surface temperature and higher surface wind speed during the LGM compared with the present day, and these factors affected dust emissions. Incorporating the abnormal surface erosion factor in the dust source regions had a smaller effect on climate variables than incorporating high-latitude ice-sheet extent, while incorporation of orbital parameters and greenhouse gas concentrations had the smallest effects on climate.
5.c. Association between Asian dust activity and large-scale atmospheric circulation
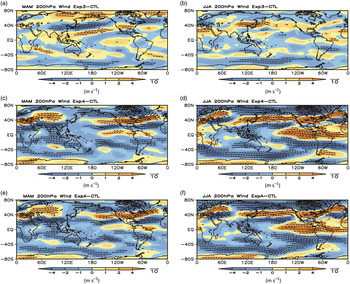
Upper-atmosphere wind speed changes above the Asian dust source regions are important circulation factors that affect dust emissions. The differences in the horizontal distribution of the 200 hPa zonal winds during spring and summer between the different models further demonstrates the effects of different forcing factors on the circulation field (Fig. 10). The high-latitude ice-sheet forcing may be the primary reason for the increased wind speed above the Asian dust source regions. Increased zonal winds further promote dust emission and long-distance transport through dynamics. The high-latitude ice-sheet forcing also resulted in the appearance of a westerly anomaly belt above Japan along the North Pacific Ocean as far as North America during summer, which facilitated the long-distance transport of dust (Fig. 10b, d). However, different levels of abnormal surface erosion did not have large effects on westerlies, while changes in dust concentrations caused some anomalies in the circulation field to appear (e.g. easterly wind anomalies in the jet centre above Japan during spring and westerly wind anomalies during summer).
(Colour online) Differences from the modern controlled simulation (CTL) of the 200 hPa wind field in (a, c, e) spring (March, April May or MAM) and (b, d, f) summer (June, July, August or JJA) for (a, b) Exp3, (c, d) Exp4 and (e, f) the full-forcing experiment (ExpA).

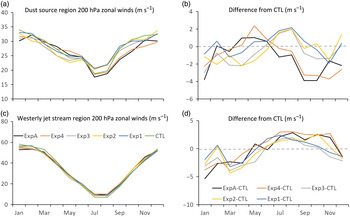
Figure 11 shows the seasonal changes in the 200 hPa zonal winds above the Asian dust source regions and Japan westerly jet stream regions for the four sensitivity experiments, and their differences when compared with the modern controlled simulation. This is consistent with the zonal winds in the jet centre above Japan. The different forcing factor experiments yielded significantly different zonal winds above the dust source regions and above the jet centres compared with those of the present day. Incorporating high-latitude ice-sheet extent (Exp4) yields higher zonal winds in the dust source region during spring compared with present-day values, but these differences are lower for other seasons. Incorporating abnormal surface erosion, greenhouse gas concentrations and orbital parameters generates lower winds during spring and higher winds during summer compared with present-day values.
(Colour online) Seasonal changes in 200 hPa zonal winds (m s–1) for (a) dust source regions and (c) westerly jet stream regions, and (b, d) their respective differences from the modern controlled simulations (CTL).

6. Conclusions
We used the latest Community Earth System Model (CESM) with the Community Climate System Model (CAM4-BAM) atmosphere module to perform an analysis of the effects of Earth’s orbital parameters, atmospheric greenhouse gas concentrations, abnormal surface erosion in dust source regions and high-latitude ice-sheet extent on global and Asian dust emissions during the LGM.
(1) The simulation results showed that under the joint effects of the orbital parameters, greenhouse gas concentrations, abnormal surface erosion and high-latitude ice-sheet factors during the LGM, global dust emission was 7099.81 Tg a–1, 2.73-fold higher than that of the present day. The dust emission flux in the Asian source regions was 4.51-fold higher than that of the present day, while dust emissions in North Africa are relatively lower.
(2) An analysis of the effects of different forcing factors on dust emissions showed that the abnormal surface erosion in Asia was the primary reason for higher LGM dust emissions. The abnormal surface erosion caused the global dust emission flux to be 2.85-fold higher during the LGM than that of the present day; this factor was 3.77 for Asia, although the North Africa dust emission flux during the LGM was similar to that of the present day. On the other hand, high-latitude ice-sheet extent during the LGM caused the global dust emission flux to be only 1.25-fold higher than that of the present day, and Asian and North African dust emission fluxes were 1.26- and 1.27-fold higher, respectively. Dust emission in North Africa was more dependent on driving caused by the high-latitude ice-sheet factor. Changes in orbital parameters and greenhouse gas concentrations had weaker effects on LGM dust emissions. Abnormal surface erosion in Asia was the primary cause of higher dust emissions during the LGM, and high-latitude ice-sheet extent enhanced dust emission and transport in Asia.
(3) Differences in surface temperature and precipitation observed by incorporating high-latitude ice-sheet extent and abnormal surface erosion in models were the main factors contributing to differences in dust emissions. The presence of large areas of high-latitude ice sheets during the LGM caused global annual mean surface temperatures to be lower by 2.88°C and precipitation to be lower by 68.77 mm than present-day values. In addition, abnormal surface erosion caused temperature to be lower by 1.39°C and precipitation to be lower by 26.79 mm compared with present-day values. Lower precipitation, lower surface temperature, higher surface wind speed, and large-scale seasonal circulation anomalies caused by high-latitude ice-sheet extent and abnormal surface erosion factors all contirubted to higher dust emissions during the LGM.
In summary, our comparative analysis of the effects of different forcing factors on dust emissions during the LGM has shown that the high-latitude ice-sheet extent and abnormal surface erosion were the two main forcing factors. This study suggests that it is important to accurately reconstruct the abnormal surface erosion in addition to considering ice sheets during glacial–interglacial periods.
Author ORCIDs
Xinzhou Li, 0000-0001-8438-3552
Acknowledgements
This research was financially supported by the National Key Research and Development Program of China (grant no. 2016YFA0601904), the Strategic Priority Research Program of Chinese Academy of Sciences (grant nos XDB26000000 and XDA20070103) and the National Natural Science Foundation of China (grant nos 41690115 and 41472162). Xinzhou Li acknowledges the support of the Belt & Road Center for Climate and Environment Studies, Institute of Earth Environment, Chinese Academy of Sciences. We also thank two anonymous reviewers for their constructive comments and copy-editor Elaine Rowan who helped to improve the manuscript.