INTRODUCTION
Corridor disease, East Coast fever and Zimbabwe theileriosis (January disease) are related disease syndromes of cattle caused by Theileria parva (Norval et al. Reference Norval, Perry and Young1992). The brown ear ticks Rhipicephalus appendiculatus, R. duttoni and R. zambeziensis are considered to be the main vectors of T. parva with distribution ranges limited to Central, East and southern Africa (Lessard et al. Reference Lessard, L'Eplattenier, Norval, Kundert, Dolan, Croze, Walker, Irvin and Perry1990). In the case of East Coast fever and January disease, sick and recovered carrier cattle are infective to ticks, resulting in transmission of cattle-adapted T. parva to susceptible cattle. Corridor disease results when buffalo-adapted T. parva is transmitted from carrier Cape buffalo (Syncerus caffer) to cattle which die acutely, usually showing no carrier stages of the infection (Norval et al. Reference Norval, Lawrence, Young, Perry, Dolan and Scott1991).
East Coast fever was introduced into South Africa, presumably from East Africa, in 1902 and was eradicated by 1956 through an extensive quarantine, systematic dipping and slaughter campaign (Theiler, Reference Theiler1904; Neitz, Reference Neitz1957). January disease was originally identified in Zimbabwe and was never considered to be present in South Africa (Neitz, Reference Neitz1957). While Corridor disease was first identified in Zimbabwe, its aetiology was elucidated in South Africa where it was first recognized in the corridor formed by the historic Hluhluwe and Umfolozi game parks (Neitz et al. Reference Neitz, Canham and Kluge1955). Bovine carrier states are recognized for East Coast fever and January disease and were shown to occur under laboratory conditions for Corridor disease (Barnett and Brocklesby, Reference Barnett and Brocklesby1966a,b; Koch et al. Reference Koch, Norval, Ocama and Munatswa1992; Neitz, Reference Neitz1958; Potgieter et al. Reference Potgieter, Stoltsz, Blouin and Roos1988; Young et al. Reference Young, Leitch, Newson and Cunningham1986). No carrier state could yet be confirmed for bovines under field conditions in South Africa (Potgieter et al. Reference Potgieter, Stoltsz, Blouin and Roos1988).
Currently, the recognized Corridor disease endemic regions in South Africa include the Kruger National Park (KNP), Hluhluwe-Imfolozi Park (KwaZulu-Natal) and regions between and surrounding these areas (Potgieter et al. Reference Potgieter, Stoltsz, Blouin and Roos1988). Rhipicephalus appendiculatus are, however, widespread across the Northwest and Northern Provinces, as well as Mpumalanga, KwaZulu-Natal and the eastern parts of Eastern Cape (Estrada-Peña, Reference Estrada-Peña2003). The potential geographical range of T. parva can thus be much wider if infected vectors or buffalo are introduced into non-endemic disease regions. The expansion of the eco-tourism trade has made ‘disease-free’ buffalo a lucrative commodity with expansion of herds outside the endemic regions (Collins et al. Reference Collins, Allsopp and Allsopp2002). This includes movement of ‘disease-free’ buffalo from endemic to non-endemic regions. Such buffalo need to be certified free of Brucellosis, Corridor disease, foot and mouth disease and tuberculosis by State Veterinarian authorities before relocation is allowed (Collins et al. Reference Collins, Allsopp and Allsopp2002). As such, Corridor disease is a controlled disease and the movement of buffalo inside and outside the endemic regions is strictly regulated by the Department of Agriculture, Forestry and Fisheries (Animal Disease Act 1984, Act No. 35). This is mainly to prevent disease outbreaks among cattle and the potential establishment of a carrier state in cattle that will lead to a situation that resembles that of the original East Coast fever epidemic (Yusufmia et al. Reference Yusufmia, Collins, Nkunaa, Troskie, Van den Bossche and Penzhorn2010).
With regard to Corridor disease testing, buffaloes were initially tested using the indirect fluorescence antibody test (IFAT) (Potgieter et al. Reference Potgieter, Stoltsz, Blouin and Roos1988). This was expanded to include molecular testing using slot-blot hybridization technology based on amplification of the 18S RNA using a universal Theileria genus specific primer set (Allsopp et al. Reference Allsopp, Baylis, Allsopp, Cavalier-Smith, Bishop, Carrington, Sohanpal and Spooner1993; Collins et al. Reference Collins, Allsopp and Allsopp2002). The latter test was subsequently replaced by a real-time hybridization PCR test that amplifies a 167 bp fragment from the V4 variable region of the 18S rRNA gene using a T. parva-‘specific’ forward and a Theileria genus-specific reverse primer (Sibeko et al. Reference Sibeko, Oosthuizen, Collins, Geysen, Rambritch, Latif, Groeneveld, Potgieter and Coetzer2008). During the development of this test, a universal Theileria genus-specific primer set was initially used, but due to competitive PCR in mixed infections this set was replaced with the T. parva-‘specific’ primer set (Sibeko et al. Reference Sibeko, Oosthuizen, Collins, Geysen, Rambritch, Latif, Groeneveld, Potgieter and Coetzer2008). However, this primer set also amplifies the related Theileria spp., T. sp. (buffalo) and T. sp. (bougasvlei), designated collectively as ‘T. sp. (buffalo)-like’ in the current study (Sibeko et al. Reference Sibeko, Oosthuizen, Collins, Geysen, Rambritch, Latif, Groeneveld, Potgieter and Coetzer2008; Zweygarth et al. Reference Zweygarth, Koekemoer, Josemans, Rambritch, Pienaar, Putterill, Latif and Potgieter2009). As such, the possibility for competition PCR still exists where mixed infections of T. parva and T. sp. (buffalo)-like parasites occur. We investigated whether mixed infections would be a relevant factor under southern African field conditions, taking into consideration the geographical distributions of T. sp. (buffalo)-like parasites and T. parva, as well as parasitaemia levels for the different parasites in the buffalo host. The results show that mixed infections of T. parva and T. sp. (buffalo)-like parasites can have a considerable impact on accurate diagnosis of Corridor disease status in Cape buffalo.
MATERIALS AND METHODS
DNA extraction and real-time hybridization assay
Cape buffalo blood samples from private game ranches as well as National Parks in South Africa (the Marakele National Park (MNP) and the Kruger National Park (KNP)), were submitted to the Parasites, Vectors and Vector-Borne Diseases (PVVD) laboratory during 2008–2009 for routine T. parva diagnostic analyses by the real-time hybridization PCR assay (Sibeko et al. Reference Sibeko, Oosthuizen, Collins, Geysen, Rambritch, Latif, Groeneveld, Potgieter and Coetzer2008). Genomic DNA was extracted from 200 μl of whole blood using the MagNa Pure Large Volume Kit and MagNa Pure LC (Roche Diagnostics, Mannheim, Germany) according to the manufacturer's instructions. DNA was eluted in 100 μl of elution buffer and 2·5 μl (∼15–50 ng/μl DNA) used per real-time hybridization assay as described (Sibeko et al. Reference Sibeko, Oosthuizen, Collins, Geysen, Rambritch, Latif, Groeneveld, Potgieter and Coetzer2008). Briefly, reaction conditions included 4 μl of the LightCycler-FastStart DNA MasterPlus Hybridization mix (Roche Diagnostics, Mannheim, Germany), 1 U uracil deoxy-glycosylase (UDG) (Roche Diagnostics, Mannheim, Germany), 0·5 pmol forward and reverse primers, 0·1 pmol each of the T. parva and Theileria genus-specific hybridization anchor and probe pairs at a final volume of 20 μl. Crossing-point (CP) values were calculated by the automated qualitative analysis mode of the LightCycler 4.0 software (Roche Diagnostics, Mannheim, Germany).
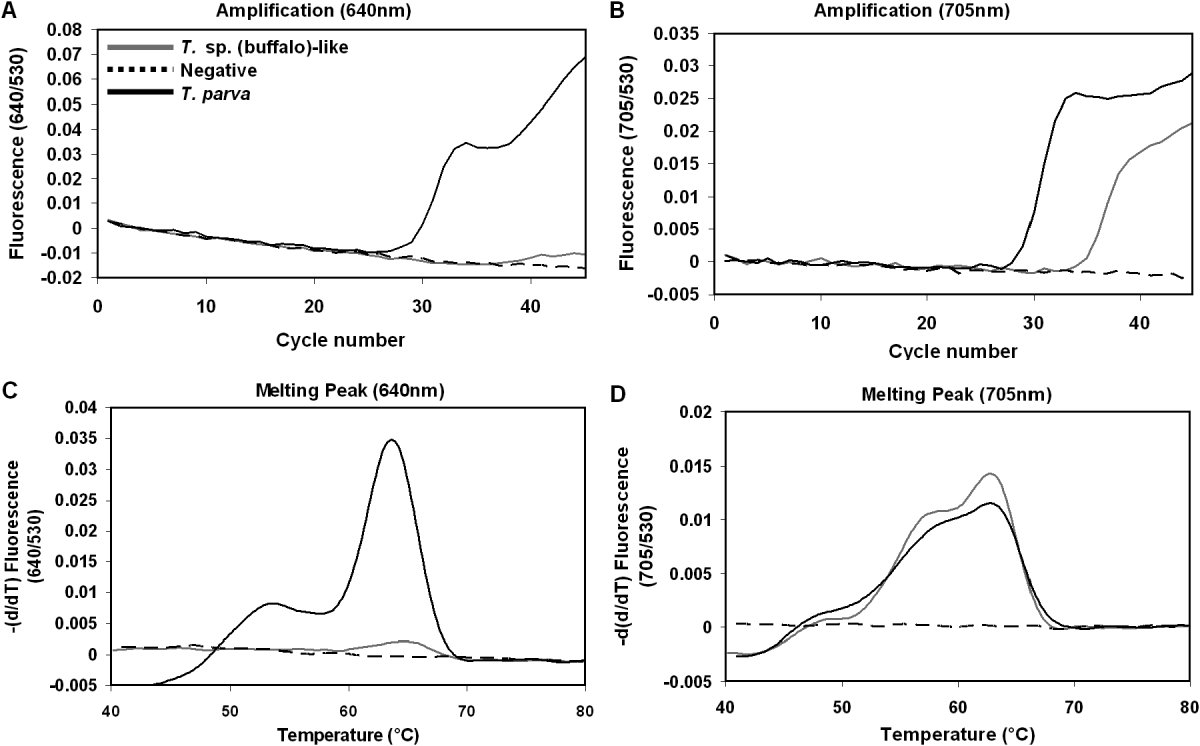
The real-time hybridization test employs 2 hybridization probe sets for T. parva (640 nm) and the Theileria genus (705 nm). Results obtained were designated according to the following protocol (Sibeko et al. Reference Sibeko, Oosthuizen, Collins, Geysen, Rambritch, Latif, Groeneveld, Potgieter and Coetzer2008): negative samples do not show amplification or melting curves for the 640 or 705 nm channels (Fig. 1). T. parva-positive samples show amplification and melting curves in both 640 and 705 nm channels (Fig. 1). In the case where weak amplification and melting curves are observed for the T. parva-specific 640 nm probe, but significant signals are obtained for the 705 nm probe, the results are interpreted as being T. parva negative, but T. sp. (buffalo)-like positive (Fig. 1).
Theileria parva real-time PCR hybridization assay results. Indicated are the three possible result types that can be obtained: negative (striped line), positive for T. parva (black line), and positive for T. sp. (buffalo)-like (light grey line). Results are presented as amplification curves at 640 nm (A) and 705 nm (B), as well as melting profiles at 640 nm (C) and 705 nm (D).

Estimation of parasitaemia in database samples
To estimate parasitaemia of T. parva and T. sp. (buffalo)-like parasites in buffalo blood samples, standard curves for the real-time hybridization assay were constructed. For this a 1101 bp fragment of the 18S rRNA gene for T. parva and T. sp. (buffalo) were amplified, respectively, using Theileria genus-specific primers 989 and 990 (Allsopp et al. Reference Allsopp, Baylis, Allsopp, Cavalier-Smith, Bishop, Carrington, Sohanpal and Spooner1993), from cloned and sequenced products for T. parva and T. sp. (buffalo). The PCR products were purified using the Wizard® SV Gel and PCR Clean-Up System (Promega) and quantified spectrophotometrically using a ND-1000 NanoDrop spectrophotometer (NanoDrop Technologies, Inc). The DNA products were then diluted to give stock solutions of 10 ng/μl which corresponded to ∼1×10¹⁰ molecules/μl. This was calculated from the formula: Number of molecules=(Amount× Avogadro's number)/(bp length×average bp mass) with the average bp mass=615 Da. Due to the fact that there are two 18S rRNA copies in the genome of T. parva (Gardner et al. Reference Gardner, Bishop, Shah, de Villiers, Carlton, Hall, Ren, Paulsen, Pain, Berriman, Wilson, Sato, Ralph, Mann, Xiong, Shallom, Weidman, Jiang, Lynn, Weaver, Shoaibi, Domingo, Wasawo, Crabtree, Wortman, Haas, Angiuoli, Creasy, Lu, Suh, Silva, Utterback, Feldblyum, Pertea, Allen, Nierman, Taracha, Salzberg, White, Fitzhugh, Morzaria, Venter, Fraser and Nene2005), this yields ∼5×10⁹ genomic equivalents/μl. It can be assumed that T. sp. (buffalo)-like parasites will also have 2 copies of the 18S rRNA gene, as all Theileria thus far described, have this number (Pain et al. Reference Gardner, Bishop, Shah, de Villiers, Carlton, Hall, Ren, Paulsen, Pain, Berriman, Wilson, Sato, Ralph, Mann, Xiong, Shallom, Weidman, Jiang, Lynn, Weaver, Shoaibi, Domingo, Wasawo, Crabtree, Wortman, Haas, Angiuoli, Creasy, Lu, Suh, Silva, Utterback, Feldblyum, Pertea, Allen, Nierman, Taracha, Salzberg, White, Fitzhugh, Morzaria, Venter, Fraser and Nene2005). In the case of T. parva, the predominant number of piroplasms is 1 piroplasm per red blood cell in the carrier-state or even in animals with parasitaemia as high as 2–9% (Conrad et al. Reference Conrad, Denham and Brown1986). It is assumed that this would thus also be the lower limit for T. sp. (buffalo)-like organisms. It was also determined that Theileria in the piroplasm stages are haploid (Gauer et al. Reference Gauer, Mackenstedt, Mehlhorn, Schein, Zapf, Njenga, Young and Morzaria1995). As such, a genomic equivalent (2 copies of the 18S rRNA gene) can be equated with 1 infected red blood cell. The mean red blood cell count for free-ranging African buffalo has been determined to be 10·0×1012 RBC/L (Beechler et al. Reference Beechler, Jolles and Ezenwa2009). Given this, the 2·5 μl of DNA eluate used per assay is equivalent to 5 μl of whole blood, which would yield mean erythrocyte counts of 4·88×107 for buffalo. A theoretical percentage parasitaemia can thus be calculated where the number of genomic equivalents added per assay is known.
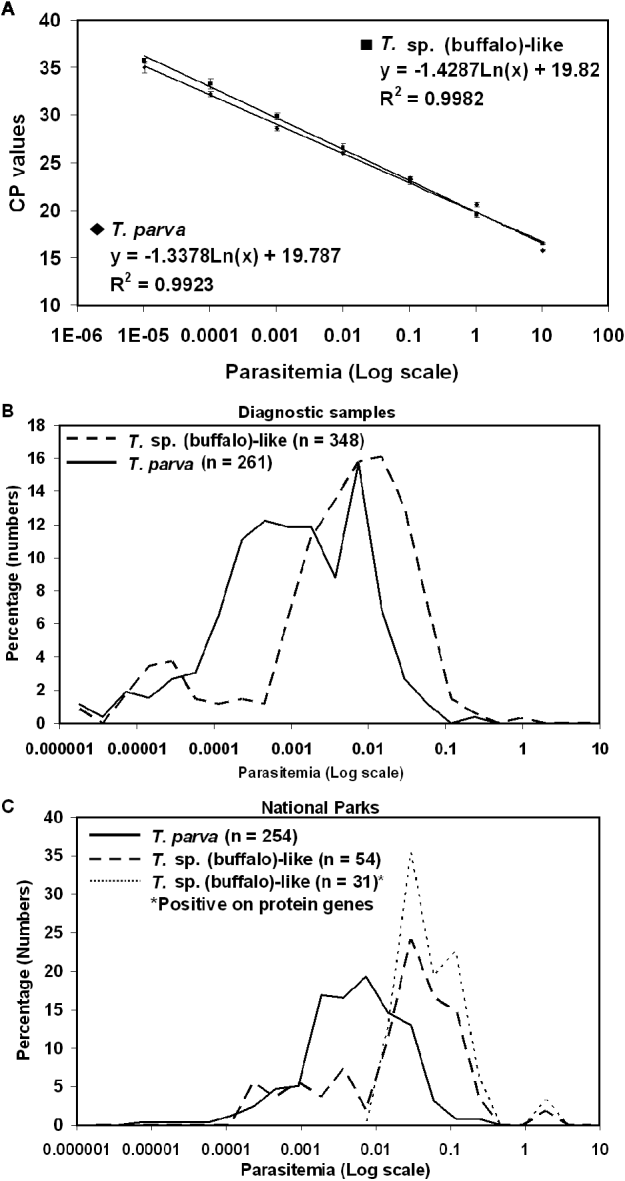
A 10-fold serial dilution range of the T. parva and T. sp. (buffalo) 18S gene stock solutions, that gives a range of 10–1×10⁷ molecules, spans the known observed CP values (15–35 cycles) as obtained by real-time hybridization assay of T. parva diagnostic samples (personal observation). This corresponds to calculated parasitaemia percentage values of 1×10⁻⁵–10 (Fig. 2A). Using the equations obtained from the curve fits, estimated parasitaemia can be calculated for all samples that have been previously assayed. In all cases, buffalo KNP102, a known T. parva-positive infected buffalo used as gold standard positive control (Sibeko et al. Reference Sibeko, Oosthuizen, Collins, Geysen, Rambritch, Latif, Groeneveld, Potgieter and Coetzer2008), was used as external control to estimate the consistency of the real-time hybridization assay. Mean CP values for the KNP102 samples during the assays were 27·73±0·55 (n=220 assays) which corresponds to a mean calculated parasitaemia of 0·0034%±0·0011 (range of 0·001–0·0085%). This corresponds well with previous empirical determinations of parasitaemia (0·002–0·009%) in this buffalo (Sibeko et al. Reference Sibeko, Oosthuizen, Collins, Geysen, Rambritch, Latif, Groeneveld, Potgieter and Coetzer2008; Papli et al. Reference Papli, Landt, Fleischer, Koekemoer, Mans, Pienaar, Josemans, Zweygarth, Potgieter and Latif2010), and suggests that our method for the estimation of parasitaemia in buffalo blood samples is valid.
Frequency distribution of estimated parasitaemia for Theileria parva and T. sp. (buffalo)-like parasites. (A) Standard curves obtained from a 10-fold serial dilution of T. parva and T. sp. (buffalo) 18S DNA templates. Indicated are the calculated parasitaemia and their corresponding CP values. CP values were derived for T. parva and T. sp. (buffalo) using the 640 nm and 705 nm probes, respectively. (B) Parasitaemia calculated for diagnostic samples. (C) Parasitaemia calculated for National Park samples. Parasitaemia was calculated from CP values obtained from real-time PCR data for T. parva (640 nm) and T. sp. (buffalo)-like (705 nm) samples using standard curves. The number of samples for each sample type analysed is indicated and the percentage of the total number was determined by grouping parasitaemia in 2-fold decreasing bins. Values for T. sp. (buffalo)-like samples that tested positive with the protein genes are also indicated.

In vitro simulation of mixed infections at relevant parasitaemia
Amplified PCR template solutions that represent T. parva parasitaemias of 0·0001%, 0·001% and 0·01% were prepared using the stock solution previously used for construction of the standard curve. T. sp. (buffalo) PCR template was added to these to obtain 0·1 to 1000-fold T. sp. (buffalo): T. parva ratios and these mixed templates were analysed using the real-time hybridization assay.
Reverse-line blot of field and control buffalo samples
Reverse-line blot analysis was performed as described by Matjila et al. (Reference Matjila, Penzhorn, Bekker, Nijhof and Jongejan2004) with the exception that the initial 10 cycles used for touchdown PCR decreased with 1°C steps instead of 2°C as reported. Probes for the detection of Theileria species in southern Africa were used (Matjila et al. Reference Matjila, Leisewitz, Jongejan, Bertschinger and Penzhorn2008). These included probes for T. annulata, T. bicornis, T. buffeli, T. equi, T. mutans, T. parva, T. sp. (buffalo), T. sp. (duiker), T. sp. (kudu), T. sp. (sable), T. taurotragi and T. velifera, as well as a Theileria/Babesia catch-all. Samples that were negative for T. parva on the real-time hybridization assay were screened with RLB to identify control samples for T. annulata, T. buffeli, T. mutans, T. taurotragi, T. velifera, T. sp. (sable) and T. sp. (buffalo). In the case of T. sp. (bougasvlei) the sample was confirmed by sequencing and submitted to GenBank (Accession number: GU570997).
Conventional touchdown PCR based on protein genes
Conventional touchdown PCR was performed using an initial denaturation step at 94°C (2 min), 10 cycles of a touchdown procedure that included 30 s denaturation at 94°C, 30 s annealing starting at 68°C and decreasing 1°C with each cycle down to 59°C, with 30 s extension at 72°C. This was followed by 35 cycles of denaturation at 94°C (30 s), annealing at 59°C (30 s) and extension at 72°C (1 min). A final 7-min extension step at 72°C was performed to ensure that all PCR products were fully extended. Reaction conditions included the use of 25 μl of GreenTaq Ready reaction mix (Promega), 2·5 μl of DNA template and 10 pmol of each primer up to a total volume of 50 μl.
Four different gene fragments specific for T. parva were amplified and included a portion coding for the N-terminal end of the p67 gene, p67N (GI number: 4106803; p67NF: CTA CGG AGG AAC AAC CAT TTC CTT CTA G; p67NR: CGA TGT AGT TTC ACC TGT GGA TGT TTT TCC), a portion coding for the C-terminal end of the p67 gene, p67C (GI number: 4106803; p67CF: ACA CCA GGA CGA GGA TCA TCA GGT AC; p67CR: GGT TCC ATT AGG AGC TGA AGG TGG TTG) (Nene et al. Reference Nene, Musoke, Gobright and Morzaria1996), a fragment of p104 (GI number: 71028857; p104F: CTC TCC CTG AGA CAC CTG GAA CTC; p104R: GGT TTC TTT GGC TTC GAT GGC CTC G) (Iams et al. Reference Iams, Young, Nene, Desai, Webster, ole-MoiYoi and Musoke1990) and a fragment of the C-terminal transmembrane conserved region of the Tpr1 gene (GI number: 71026055; TprF: TGA CCT AGT GAT TCC CAC CAT GAT CA; TprR: AAT GCT GCT AGG TTC TTA TTG CAG TTC) (Baylis et al. Reference Baylis, Sohal, Carrington, Bishop and Allsopp1991; Bishop et al. Reference Bishop, Musoke, Morzaria, Sohanpal and Gobright1997; Gardner et al. Reference Gardner, Bishop, Shah, de Villiers, Carlton, Hall, Ren, Paulsen, Pain, Berriman, Wilson, Sato, Ralph, Mann, Xiong, Shallom, Weidman, Jiang, Lynn, Weaver, Shoaibi, Domingo, Wasawo, Crabtree, Wortman, Haas, Angiuoli, Creasy, Lu, Suh, Silva, Utterback, Feldblyum, Pertea, Allen, Nierman, Taracha, Salzberg, White, Fitzhugh, Morzaria, Venter, Fraser and Nene2005). PCR products were analysed by conventional 2% agarose gel electrophoresis using standard TAE buffer and visualized using ethidium bromide. Representative samples for the different protein genes were cloned and sequenced to confirm the identity of the amplified products (results not shown).
Locked nucleic acid-based suppression of T. sp. (buffalo) template
For locked nucleic acid (LNA) suppression assays a LNA specific for T. sp. (buffalo) (TspB_LNA: CAGAcGgAGtTTAC-PH LNA, Exiqon Inc., Woburn, MA, USA) was included in the real-time hybridization assay at a concentration of 0·5 pmol. This approach is based on the use of an LNA PCR clamp with a melting temperature much higher than the extension temperature used during the assay. This prevents polymerase extension and hence specific suppression of template amplification (Ren et al. Reference Ren, Lin, Wang, Zhou, Block and Su2009).
RESULTS
Prevalence and distribution of T. parva and T. sp. (buffalo)-like parasites
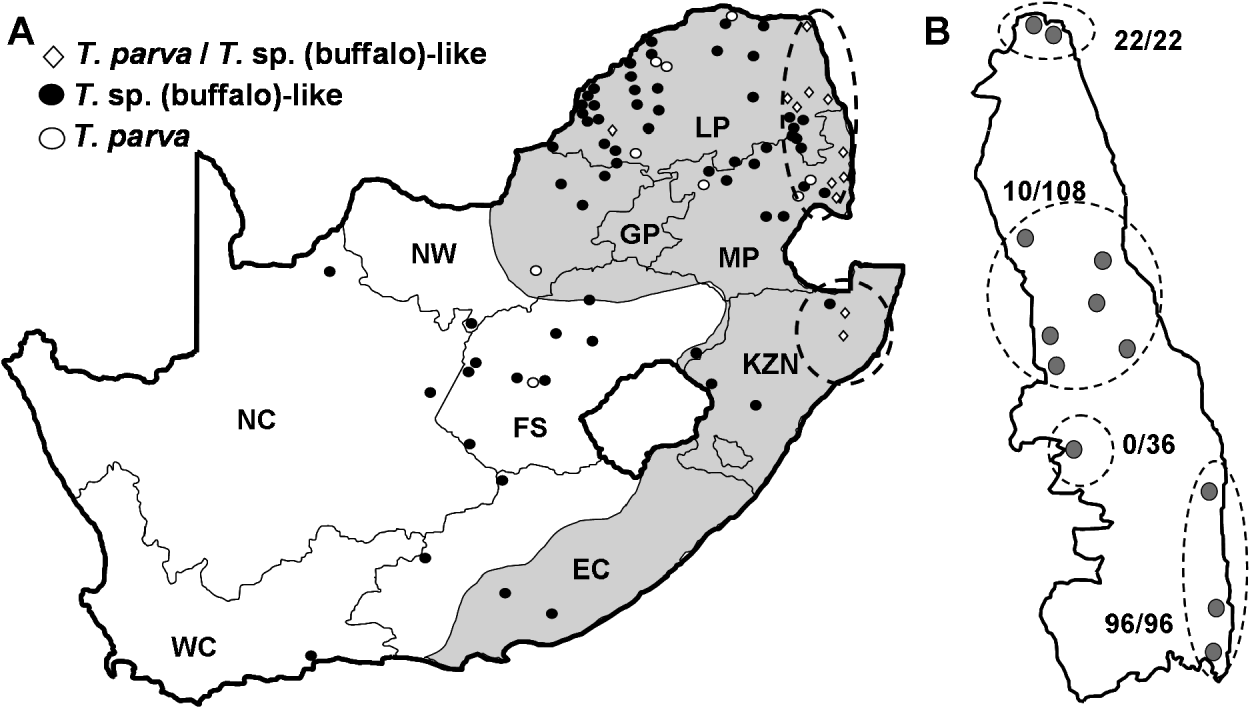
Buffalo samples (n=6928) submitted to the PVVD laboratory for T. parva diagnosis during the period of 2008–2009 were analysed to determine the current geographical distribution of buffalo testing positive for T. parva and T. sp. (buffalo)-like parasites in South-Africa. Approximately ∼8·8% (n=609) were positive at 705 nm and indicated both T. parva and T. sp. (buffalo)-like infections. T. parva positive samples comprised ∼3·8% (n=261), while ∼5% (n=348) were T. sp. (buffalo)-like (Table 1). Both T. parva and T. sp. (buffalo)-like infections had the highest prevalence in Limpopo and Mpumalanga provinces, with significant overlap with the geographical range of R. appendiculatus (Fig. 3). T. sp. (buffalo)-like infections is also prevalent in the Free State, North-West, Eastern Cape and Kwa-Zulu-Natal Provinces. T. parva positive samples were found at 22 localities, while T. sp. (buffalo) was found at 77 localities, indicating that the prevalence of T. sp. (buffalo)-like carriers is currently much higher than the prevalence of T. parva.
Distribution of Theileria parva and T. sp. (buffalo)-like samples. (A) A map of South Africa indicating sites were T. parva and T. sp. (buffalo)-like samples were identified from 2008–2009. Corridor disease endemic regions are indicated by broken circles and the distribution of Rhipicephalus appendiculatus is shaded in grey (Estrada-Peña, Reference Estrada-Peña2003). The upper broken circle indicates the approximate position of the Kruger National Park. Provinces are indicated by abbreviations: Eastern Cape (EC), Free-State (FS), Gauteng (GP), KwaZulu-Natal (KZN), Limpopo (LP), Mpumalanga (MP), Northern Cape (NC), North-West (NW) and Western Cape (WC). (B) The presence of T. sp. (buffalo) in the Kruger National Park. Shaded circles indicate sites where buffalo were sampled and the numbers sampled from larger areas are indicated as well as the number that tested positive for T. sp. (buffalo) on RLB analysis.

Summary of real-time hybridization PCR results

Parasitaemia ranges for T. parva and T. sp. (buffalo)-like parasites in buffalo
Competitive PCR suppression may occur if the parasitaemia levels of T. sp. (buffalo)-like organisms are similar or higher than that of T. parva in carrier animals. Parasitaemia levels were estimated from a calculation based on standard curve analysis derived from real-time PCR CP values (Fig. 2A). This indicated that parasitaemia for T. parva and T. sp. (buffalo)-like parasites is similar in buffalo, ranging from 0·000001 to 1%, with the majority of samples (>90%) falling between 0·0001% and 0·1% (Fig. 2B). In addition, the frequency distribution curves would suggest that T. sp. (buffalo)-like samples are pre-disposed towards higher parasitaemia, relative to that of T. parva within the 0·0001–0·1% range (Fig. 2B). In mixed infections, T. sp. (buffalo)-like parasites could potentially be present at ratios of up to 1000:1 compared to T. parva.
The suppressive effect of mixed infection on real-time PCR
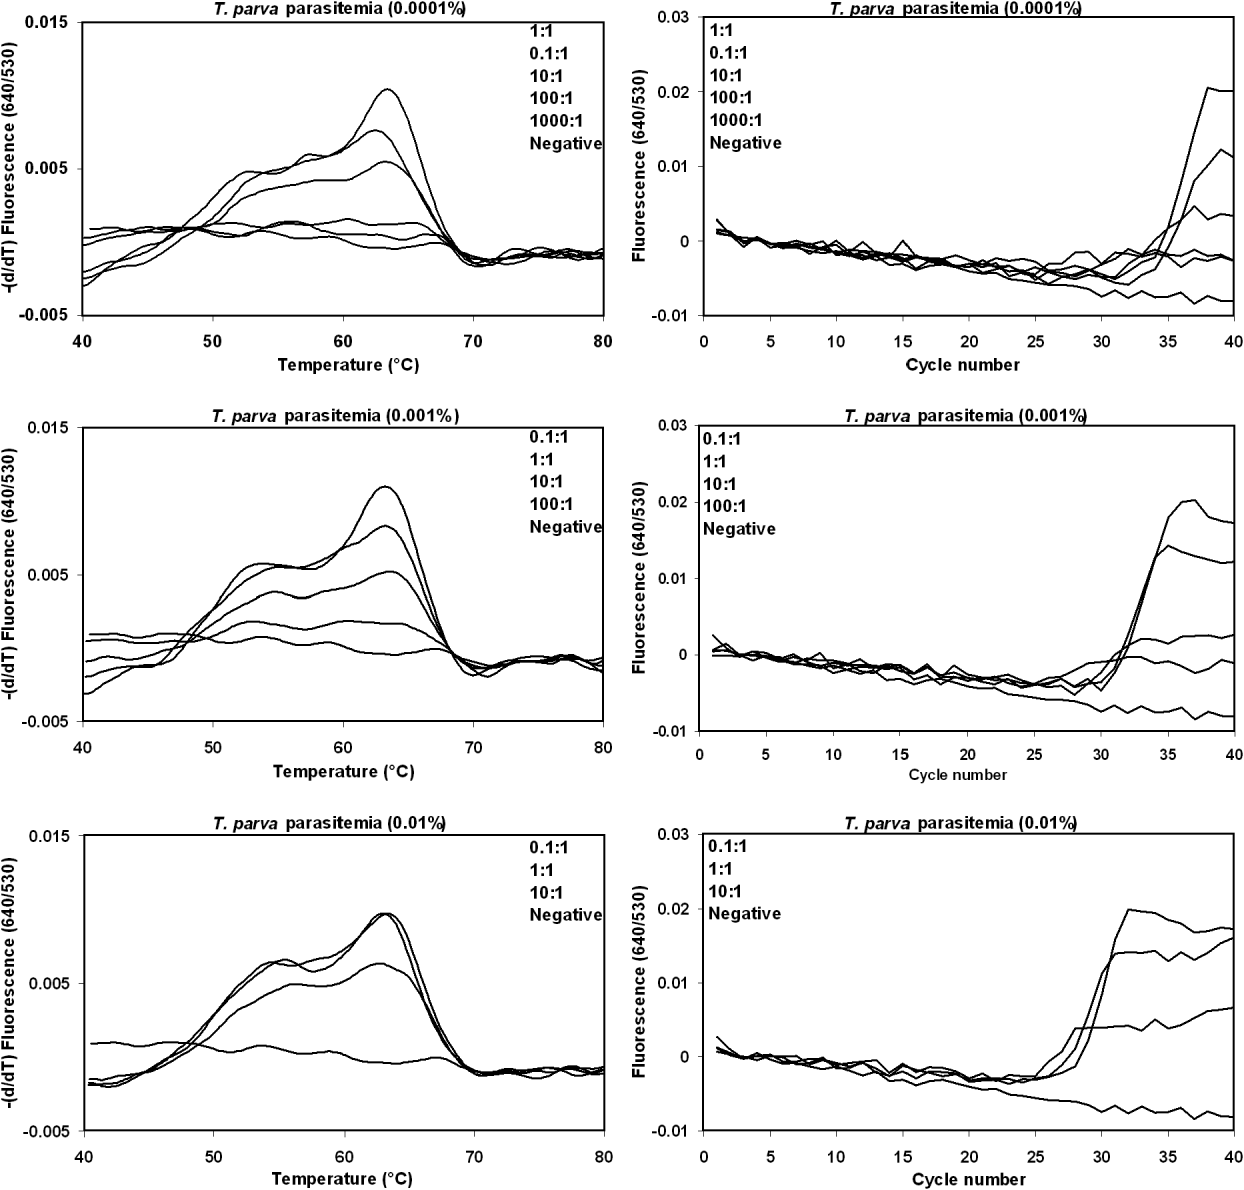
Mixed infections were simulated by combining T. parva (0·0001%–0·01%) with T. sp. (buffalo) DNA template at 0·1 to 1000-fold T. sp. (buffalo) vs T. parva ratios (Fig. 4). T. parva signal (640 nm) was notably suppressed in the lower parasitaemia range (0·0001–0·001%), when T. sp. (buffalo) was present at ratios of 100:1 and higher (0·01–0·1%). At higher T. parva parasitaemia (0·01%), the suppression effect was not observed at the highest T. sp. (buffalo) ratio used (10:1) that corresponds to 0·1% parasitaemia. However, at a ratio of 100:1 (1% T. sp. (buffalo)) suppression was still observed (results not shown), although the incidence of this level of parasitaemia is not high within field samples (Fig. 2).
Simulation of Theileria parva and T. sp. (buffalo) mixed infections at parasitaemia ⩽0·1%. Indicated are T. parva DNA templates at various calculated parasitaemias (0·0001–0·01%), mixed with T. sp. (buffalo) template (0·001–0·1%) at ratios from 0·1–1000 T. sp. (buffalo): T. parva. Indicated are melting peaks and amplification curves for the 640 nm channel.

Mixed infections in field populations
The previous sections raised the questions whether mixed infections occur in the field and whether PCR suppression is present in these populations. Buffalo samples from 2 National Parks (KNP and MNP) were characterized for which 262 buffalo samples from KNP and 90 samples from MNP, respectively, were analysed for mixed infections of T. parva and T. sp. (buffalo)-like parasites. In both parks ∼70% of all samples were T. parva positive (Table 1). Buffalo negative for T. parva, but positive for T. sp. (buffalo)-like parasites showed a prevalence of ∼10% and 26% in KNP and MNP, respectively. The frequency distribution of the parasitaemia for T. parva and T. sp. (buffalo)-like samples follows a similar trend compared to the diagnostic samples (Fig. 2C). T. sp. (buffalo)-like samples are, however, still predisposed towards the higher end of the parasitaemia range, to such an extent that ratios of 10:1 or 100:1 might be possible at lower T. parva levels. In addition, National Parks samples seem to have higher parasitaemia compared to diagnostic samples.
T. sp. (buffalo), T. mutans and T. velifera were present in all Marakele samples as determined by RLB analysis (Table 2). In contrast, RLB analysis could only detect 64% T. parva-positive samples. In the case of the KNP, larger variations with regard to mixed infections were observed by RLB analysis, with 88% and 71% being positive for T. mutans and T. velifera and only 31% being T. parva positive (Table 2). In the case of T. sp. (buffalo) only 49% were positive by RLB analysis. The majority of the T. sp. (buffalo) samples originated from northern and south-eastern parts of the KNP, with a limited prevalence in the central regions (Fig. 3B).
Summary of RLB results from KNP and MNP

Detection of T. parva based on protein gene markers
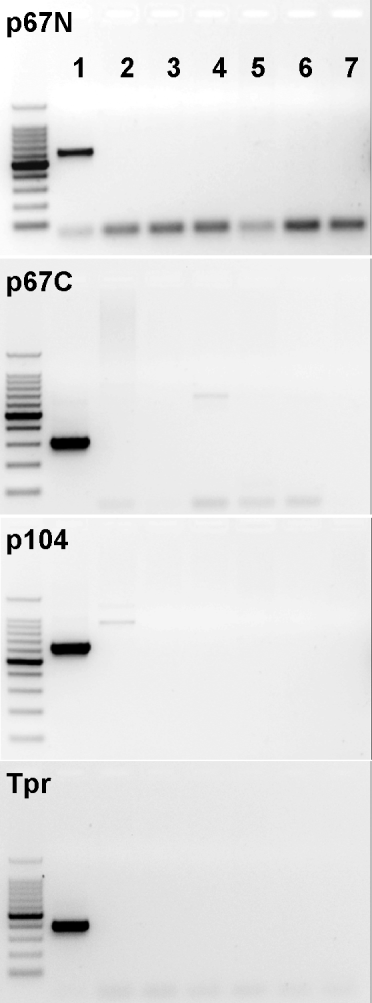
Four different conventional touchdown PCR assays were developed based on the p67 (N- and C-terminal domains), p104 and Tpr genes. Gene fragments amplified had sizes of 600 bp, 300 bp, 630 bp, 393 bp for p67N, p67C, p104 and Tpr, respectively (Fig. 5). The primer sets were specific for T. parva and control samples for Theileria species known to be found in buffalo and cattle did not show amplification (Fig. 5). These included T. annulata (Marocco), T. buffeli (18530), T. mutans (38815), T. taurotragi (18565), T. velifera (26063), T. sp. (sable) (28914), T. sp. (buffalo) (39503) and T. sp. (bougasvlei) (27071).
Conventional PCR analysis for p67N, p67C, p104 and Tpr protein genes. Lanes 1–7 indicate results for Theileria parva, T. sp. (buffalo), T. sp. (bougasvlei), T. mutans, T. velifera, T. buffeli and T. taurotragi, respectively. Molecular mass markers (100 bp ladder) are included with the 500 bp marker showing the highest intensity.

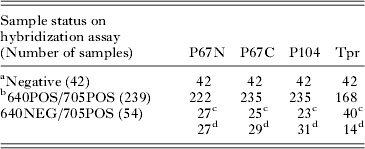
All protein gene PCR results showed a good correlation with the real-time hybridization test for T. parva-positive samples (Table 3). All the negative samples (no signal at 705 nm) on the hybridization test were also negative on the protein genes and most of these had infections of T. sp. (buffalo), T. mutans and T. velifera as indicated by RLB analysis (Table 3). In the case of the T. parva-positive samples, higher than 90% correlation was obtained between the hybridization, p67N, p67C and p104 genes. In the case of the Tpr gene, all samples derived from MNP were negative for T. parva and hence the low correlation. For the T. sp. (buffalo)-like samples the correlation was ∼43%–50% for p67N, p67C and p104 and 74% for Tpr. Correlation between p67N, p67C and p104 was, however, 89–93%. The difference between Tpr and the other genes is due to the negative status of the MNP samples based on the Tpr gene. This indicated that ∼57% of the samples in the test group (31 samples) that were negative on the hybridization assay were positive for T. parva with 3 different protein fragment markers.
Correlation between different PCR tests for the National Parks samples

Locked nucleic acid suppression of T. sp. (buffalo) in simulated mixed infections
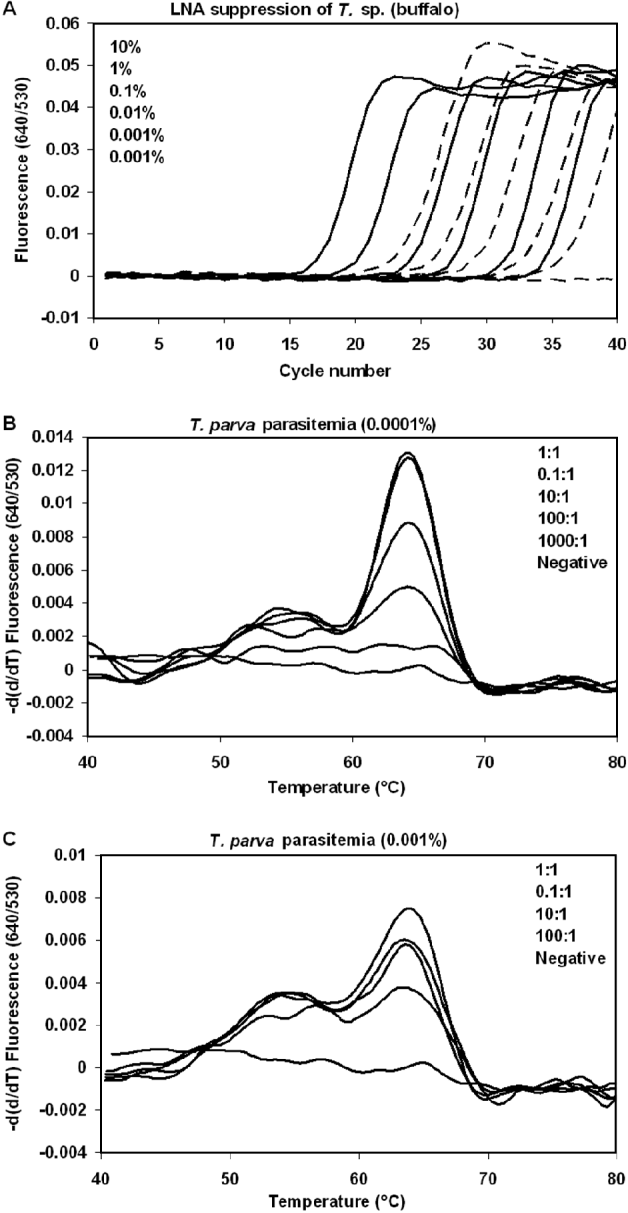
Incubation of the T. sp. (buffalo) template with the LNA clamp showed that amplification was suppressed by an average of 6 cycles (Fig. 6A). This corresponds to a decrease in parasitaemia of ∼100-fold. The LNA had no effect on amplification of T. parva (results not shown). When LNA was included in the mixed infection simulation, T. parva could be detected in all cases where 100:1-fold excess of T. sp. (buffalo) previously caused suppression (Fig. 4 and Fig. 6B and C).
LNA-based suppression of T. sp. (buffalo) in simulated mixed infections. (A) Suppression of T. sp. (buffalo) amplification by the T. sp. (buffalo)-specific LNA. Indicated is T. sp. (buffalo) template with (broken line) and without (solid line) added LNA. Calculated parasitaemias correlating with high to low cycle numbers are indicated. Mixed infection simulation of Theileria parva and T. sp. (buffalo) at T. parva parasitaemia of 0·0001% (B) and 0·001% (C) in the presence of T. sp. (buffalo) at various ratios indicated (top to bottom) in the presence of LNA.

Locked nucleic acid suppression in buffalo samples
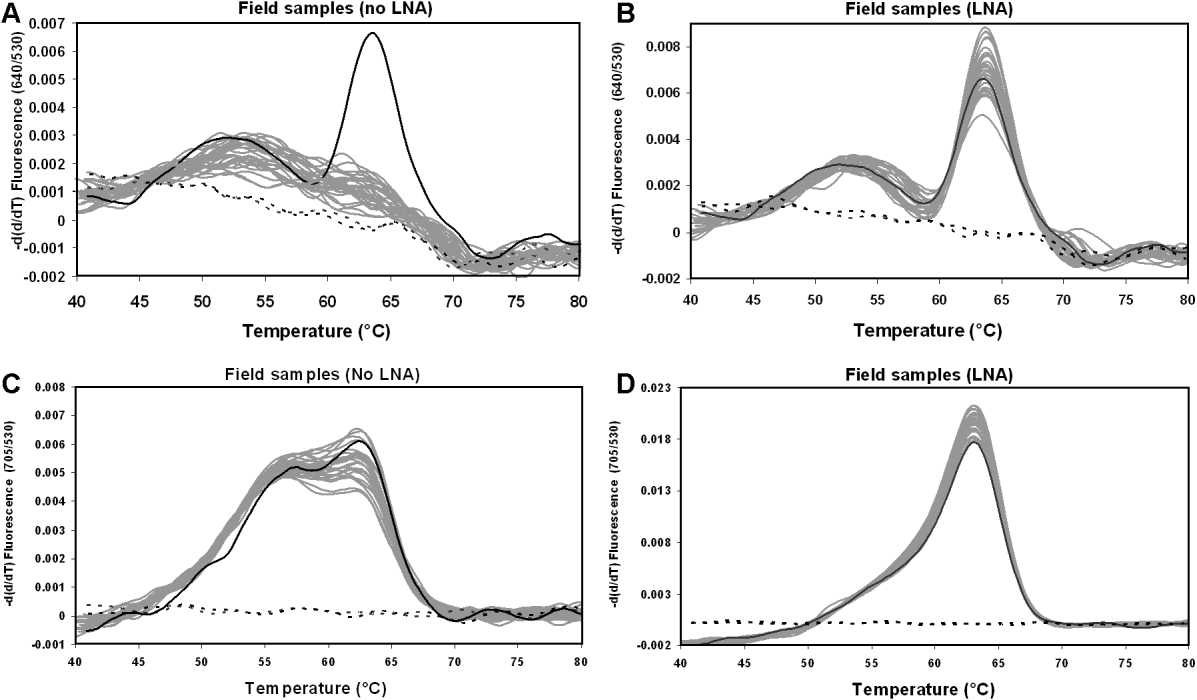
The set of 31 samples that tested negative for T. parva using the real-time hybridization assay, but positive for the protein gene PCR's were re-tested with added LNA (Fig. 7). The melting curves without LNA added show typical T. sp. (buffalo)-like profiles that are ambiguous to interpretation (Fig. 7A). In the presence of LNA, the profiles resolve to a T. parva-positive status (Fig. 7B), indicating that T. sp. (buffalo) suppression occurred in these samples. Comparison of the frequency distribution of the parasitaemia of these 31 samples to that of the T. parva and T. sp. (buffalo)-like samples show a bias towards the higher end of the parasitaemia scale (Fig. 2C).
LNA-based suppression in buffalo samples. Normal hybridization conditions are indicated on the left and the same samples with added LNA on the right, while the 640 nm and 705 nm channels are indicated at the top and bottom, respectively. Grey lines correspond to field samples, the solid black line to the Theileria parva-positive control and the broken black lines to negative controls.

Potential for mixed infections within diagnostic samples
The question is raised as to the extent of T. sp. (buffalo)-like suppression that occurs in diagnostic samples. The diagnostic sample set analysed in this study was also screened with the p67N PCR to detect possible false-negative samples. A correlation of 94% was obtained between the real-time hybridization and the p67N test for 603 samples screened (230 T. parva positive, 339 T. sp. (buffalo)-like positive). Thirty-three samples (5%) were negative on p67N, but positive on the hybridization test indicating that genotypic variations do occur in the primer regions of p67N for a limited number of samples. Only 1 sample was positive with p67N and negative for T. parva using the hybridization test. This sample was re-tested with all the protein genes as well as the hybridization test with added LNA and was confirmed to be positive for T. parva. The only other sample of a mixed infection submitted for diagnosis (outside of the dataset analysed) that showed suppression was a buffalo (28698) from the Corridor disease endemic region. This sample tested positive for all protein gene-based PCR's as well as with the added LNA hybridization assay.
DISCUSSION
Cape buffalo from southern Africa can harbour T. buffeli, T. mutans and T. velifera, as well as T. parva, T. sp. (buffalo) and T. sp. (bougasvlei) (Allsopp et al. Reference Allsopp, Theron, Coetzee, Dunsterville and Allsopp1999; Zweygarth et al. Reference Zweygarth, Koekemoer, Josemans, Rambritch, Pienaar, Putterill, Latif and Potgieter2009). This makes accurate diagnosis at species level problematic using conventional approaches such as light microscopy or IFAT. DNA blotting and probe approaches that use universal Theileria primer sets, such as RLB or slot blotting have limited use for accurate diagnostics, as PCR competition in the case of mixed infections affect sensitivity (Allsopp et al. Reference Allsopp, Baylis, Allsopp, Cavalier-Smith, Bishop, Carrington, Sohanpal and Spooner1993; Gubbels et al. Reference Gubbels, de Vos, van der Weide, Viseras, Schouls, de Vries and Jongejan1999). Slot-blot hybridization analysis indicated that 33% of buffalo from KNP were T. parva positive, even though 100% were positive in the IFAT (Allsopp et al. Reference Allsopp, Theron, Coetzee, Dunsterville and Allsopp1999). This lack of correlation was confirmed in the current study, where the National Parks buffalo samples tested with RLB found only 27–64% of samples positive compared to ∼70% with the real-time hybridization assay. Even so, the protein gene assays in the current study detected an additional 10% T. parva-positive cases. The RLB analysis also indicated that buffalo from the National Parks are infected with 3 or more Theileria spp., including T. sp. (buffalo). Allsopp et al. (Reference Allsopp, Theron, Coetzee, Dunsterville and Allsopp1999) found T. sp. (buffalo) in 54% of buffalo samples from ‘northern’ regions of the KNP which correlate with results from the current study.
Parasitaemia levels for T. parva and T. sp. (buffalo)-like parasites have previously not been estimated to the extent described in this study. The ranges calculated for T. parva (0·0001–0·1%) correlate well with those of buffalo-adapted T. parva in Cape buffalo and cattle with low piroplasm levels (<0·1%) in carrier animals (Brocklesby and Barnett, Reference Brocklesby and Barnett1966; Barnet and Brocklesby, Reference Barnett and Brocklesby1966a, Reference Barnett and Brocklesbyb; Neitz, Reference Neitz1958). The frequency distribution ranges suggest that most T. parva samples from buffalo (>98%) should be readily detectable using the real-time hybridization assay, while the rest of the samples lie at the lower range of detection for real-time PCR. The sensitivity of the current hybridization test to detect T. parva in carrier buffalo is therefore adequate, although it should be noted that few infected animals might not be detected. This correlates with observations on the East Coast fever carrier state in cattle from Kenya, where a PCR based on the p104 gene was sensitive up to 1·4 parasites/μl of infected blood (2·8E−5% parasitaemia ∼similar to the hybridization assay), but failed to detect 4·6% of infected animals detected by a subsequent nested PCR (Odongo et al. Reference Odongo, Sunter, Kiara, Skilton and Bishop2010). Whether animals with such low parasitaemia (<E−6%) can effectively infect ticks remains to be determined. The possibility of higher false-positive rates using nested PCR should be considered. The latter study also found the prevalence of East Coast fever in asymptomatic cattle from endemic regions in Kenya to range from 37 to 42% (Odongo et al. Reference Odongo, Sunter, Kiara, Skilton and Bishop2010). This is significantly lower than the Corridor disease prevalence found in carrier buffalo using the hybridization assay (∼71%), p67N (∼74%), p67C (∼85%) and p104 (∼79%) genes. This could indicate that the prevalence of T. parva parasites in carrier cattle is lower than in buffalo. However, previous studies have indicated that in endemic situations the majority of cattle were exposed to T. parva and would presumably be carriers in a situation analogous to buffalo (Young et al. Reference Young, Brown, Burridge, Grootenhuis, Kanhai, Purnell and Stagg1978, Reference Young, Leitch, Newson and Cunningham1986). Alternatively, the p104 primer sets used for amplification might not detect all sequence variants for this protein gene, as was observed in the present study for all of the protein genes.
Of interest is the observation that buffalo from National Parks seem to have higher parasitaemia for T. parva and T. sp. (buffalo)-like parasites than diagnostic buffalo. Buffalo from National Parks will be exposed to constant infected tick challenge, while ‘diagnostic buffalo’ are kept relatively tick free due to current game farming practices that relates to the breeding of ‘disease-free’ buffalo. Infection of the latter buffalo with T. parva is considered to be incidental and limited to single tick exposures. Parasitaemia in carrier-buffalo could therefore be related to the extent of infective tick-challenge. In this regard, the gold-standard positive control buffalo, KNP102, has maintained the same parasitaemia level for more than 5 years under tick-free conditions. How parasitemia levels would fluctuate in carrier-buffalo outside the vector endemic area remains to be investigated.
The MNP samples all tested negative for T. parva using the Tpr gene. The Tpr gene occurs as a multi-copy locus (24 copies on chromosome 3) in the genome of T. parva with a variable 5′-end and a highly conserved 3′region (Gardner et al. Reference Gardner, Bishop, Shah, de Villiers, Carlton, Hall, Ren, Paulsen, Pain, Berriman, Wilson, Sato, Ralph, Mann, Xiong, Shallom, Weidman, Jiang, Lynn, Weaver, Shoaibi, Domingo, Wasawo, Crabtree, Wortman, Haas, Angiuoli, Creasy, Lu, Suh, Silva, Utterback, Feldblyum, Pertea, Allen, Nierman, Taracha, Salzberg, White, Fitzhugh, Morzaria, Venter, Fraser and Nene2005). This conserved region codes for transmembrane regions and has been suggested to be maintained by concerted evolution (Bishop et al. Reference Bishop, Musoke, Morzaria, Sohanpal and Gobright1997). Any nucleotide substitutions in this region would be rapidly homogenized, so that rapid divergence of these sequences might occur in geographically isolated populations. Introduction of T. parva into MNP which is outside the endemic area for T. parva probably occurred as a single event that then spread throughout the resident buffalo population. A founder effect coupled to sequence variation in the Tpr primer areas (due to concerted evolution), could explain the lack of any positive samples in MNP with this gene.
T. sp. (buffalo) was originally identified in buffalo from East Africa and distinguished from T. parva based on differences in antigenicity and subsequent sequencing of its 18S rRNA gene (Conrad et al. Reference Conrad, Stagg, Grootenhuis, Irvin, Newson, Njamunggeh, Rossiter and Young1987; Allsopp et al. Reference Allsopp, Baylis, Allsopp, Cavalier-Smith, Bishop, Carrington, Sohanpal and Spooner1993). This parasite was cultured in vitro and significant antibody cross-reactivity was observed with T. parva (Conrad et al. Reference Conrad, Stagg, Grootenhuis, Irvin, Newson, Njamunggeh, Rossiter and Young1987). This might explain the observation that free-ranging buffalo tested previously were 100% positive on IFAT for T. parva (Allsopp et al. Reference Allsopp, Baylis, Allsopp, Cavalier-Smith, Bishop, Carrington, Sohanpal and Spooner1993). In addition, its close resemblance to T. parva in the 18S rRNA raised the question whether this was a variant strain of T. parva (Conrad et al. Reference Conrad, Stagg, Grootenhuis, Irvin, Newson, Njamunggeh, Rossiter and Young1987; Allsopp et al. Reference Allsopp, Baylis, Allsopp, Cavalier-Smith, Bishop, Carrington, Sohanpal and Spooner1993). Subsequently, this parasite was detected in buffalo from the KNP that showed that T. sp. (buffalo) were detected in 54% of animals compared to the 33% that was T. parva positive (Allsopp et al. Reference Allsopp, Theron, Coetzee, Dunsterville and Allsopp1999). This corresponds to results from the current study that showed that T. sp. (buffalo)-like parasitaemia and their prevalence in buffalo are on average higher than observed for T. parva. The establishment of a T. sp. (buffalo) cell line from a buffalo of South African origin showed that on 18S level it is identical to the parasite described from East Africa (Zweygarth et al. Reference Zweygarth, Koekemoer, Josemans, Rambritch, Pienaar, Putterill, Latif and Potgieter2009). T. sp. (bougasvlei) is a closely related parasite described in the latter study. Circumstantial evidence (sentinel cattle in contact with carrier buffalo) would suggest that both parasites are not infective to cattle (Potgieter, unpublished observation).
The tick vectors and the geographical ranges for both parasites are unknown. Ticks found on buffalo in KNP indicated that potential vectors could be Amblyomma hebraeum, A. marmoreum, Hyalomma truncatum, Rhipicephalus appendiculatus, R. evertsi evertsi or R. simus (Horak et al. Reference Horak, Golezardy and Uys2007). The distribution patterns for these ticks largely overlap with that of R. appendiculatus in the Northwest and Northern Provinces, as well as Mpumalanga, KwaZulu-Natal and the eastern parts of Eastern Cape (Walker et al. Reference Walker, Keirans and Horak2000; Estrada-Peña, Reference Estrada-Peña2003; Horak et al. Reference Horak, McKay, Henen, Heyne, Hofmeyr and De Villiers2006a). If any of these ticks are vectors, mixed infections will be common.
The limited distribution of T. sp. (buffalo) in the northern and south-eastern regions of the KNP poses an interesting conundrum. All the tick species mentioned above were distributed across the KNP (Spickett et al. Reference Spickett, Horak, Braack and van Ark1991; Horak et al. Reference Horak, Gallivan, Spickett and Potgieter2006b). It could therefore be expected that T. sp. (buffalo) has a wider distribution if one of the above-mentioned ticks were its vector. Tick burden (and numbers of infected ticks) might differ in various geographical areas due to the prevalence of infected buffalo and other competing non-infected vertebrate hosts. This was the case for A. hebraeum and R. evertsi evertsi in central and southern regions of the KNP, where buffalo, zebra and impala numbers influenced tick prevalence (Horak et al. Reference Horak, Fourie and Van Zyl1995).
Suppression of the T. parva-positive signal by the presence of T. sp. (buffalo) template at concentrations relevant for field parasitaemia has been shown to occur in vitro. Evidence was also provided that this happens in free-ranging buffalo. Interestingly, those samples for which suppression of PCR signal was detected are also those that have T. sp. (buffalo)–like parasitaemia distributions that are higher than the T. parva distributions, which suggests that this is the basis for their misdiagnosis as supported by the LNA data. Thus far, the extent of suppression occurring due to mixed infections in routine diagnostics has been minimal (<0·5%). This is mainly due to the low incidence of T. parva and T. sp. (buffalo)-like samples submitted for routine diagnostics (<10%), with the correlated low probability of finding mixed infections in such samples. The number of T. parva-free buffalo with T. sp. (buffalo)-like infections will probably increase in the future, as movement of such buffalo is not restricted by current legislation. This is reflected by the higher prevalence of T. sp. (buffalo)-like carrier animals at various sites identified in this study. Buffalo could remain life-long carriers, and where the vector for T. sp. (buffalo) is present, this would also lead to the spread of the parasite among buffalo populations. The geographical distribution data for T. parva and T. sp. (buffalo)-like parasites also suggest that their respective vectors overlap geographically and that mixed infections can be expected to occur. Introduction of T. parva into a buffalo herd already infected with T. sp. (buffalo), could as such, potentially lead to cases which will not be detected using the current test. In an endemic situation where both T. parva and T. sp. (buffalo) occur, the current data suggest that at least 10% of T. parva infections might be misdiagnosed. While this might not be a problem of immediate concern, a more sensitive test able to accurately discriminate between T. parva and T. sp. (buffalo)-like parasites, which is not affected by mixed infections will be required in the future.
In the case of cattle, the effect of mixed T. sp. (buffalo)-like infections on the hybridization test does not seem to be problematic, as out of ∼2500 diagnostic samples none has presented a T. sp. (buffalo)-like profile (unpublished observation). This would imply that T. sp. (buffalo) and T. sp. (bougasvlei) do not infect cattle.
Mixed infections of T. parva and T. sp. (buffalo) can affect the diagnostic sensitivity of the hybridization PCR assay of Sibeko et al. (Reference Sibeko, Oosthuizen, Collins, Geysen, Rambritch, Latif, Groeneveld, Potgieter and Coetzer2008). In cases where this is suspected the current test could be supplemented by PCR assays based on protein genes. In addition, the use of an LNA which is able to suppress T. sp. (buffalo) can be incorporated into the test if mixed infections are suspected, or new diagnostic tests not affected by mixed infections can be implemented.
ACKNOWLEDGEMENTS
This project was funded by OVI project numbers 15/08/1P01 and OV21/03/C148 (Department of Agriculture, Forestry and Fisheries contract). We thank Dr Roy Bengis for buffalo samples. The OVI sequencing facility is thanked for their support.