I. INTRODUCTION
Cadmium selenide (CdSe) belongs to a class of important II–VI semiconductors that includes CdS, CdSe, and ZnS. It can exist as a hexagonal wurtzite phase at atmospheric pressure, a cubic zincblende phase generally formed in thin films, and a rocksalt phase at high pressure.Reference Csik, Russo and Mulvaney1, Reference Zakharov, Rubio and Cohen2 Recently, there has been strong interest in CdSe nanocrystals and their widespread applications as optical filters,Reference Wang, Geng, Yan, Liu, Xie and Qian3 sensor and laser materials,Reference Klimov, Mikhailovsky, Xu, Malko, Hollingsworth, Leatherdale, Eisler and Bawendi4 and quantum-dot light-emitting diodes.Reference Coe, Woo, Bawendi and Bulovic5 Since the study of nanosized CdSe provides an opportunity to observe the evolution of material properties with crystal structure and size,Reference Bawendi, Steigerwald and Brus6–Reference Li, Liao, Ding, Fan, Zhang and Qian9 many methods have been used to synthesize CdSe nanocrystals, including solid-state metathesis,Reference Yi and Moore10 chemical solution deposition and ionic reaction,Reference Bandaranayake, Wen, Lin, Jiang and Sorensen11, Reference Wang and Herron12 gas–liquid precipitation,Reference Borade13 sonochemical methods,Reference Zhu, Koltypin and Gedanken14 molecular precursor methods,Reference Peng, Manna, Yang, Wickham, Scher, Kadavanich and Alivisatos15, Reference Rajh, Micic and Nozik16 γ-irradiation,Reference Qiao, Xie, Xu, Zhu and Qian17 and solvothermal methods.Reference Li, Liao, Ding, Fan, Zhang and Qian9
The rapidly growing field of CdSe nanocrystals lacks experimental benchmarks for thermodynamic properties. A fundamental issue that remains to be addressed is how size relates to the surface activity and chemical and physical properties. However, no direct experimental data on the surface energy of CdSe appear to be available. High-temperature oxide melt solution calorimetry has been shown to be a powerful and convenient method for studying the surface energies of numerous nanophase oxides, including Al2O3,Reference McHale, Auroux, Perrotta and Navrotsky18 TiO2,Reference Levchenko, Li, Boerio-Goates, Woodfield and Navrotsky19 α-Fe2O3,Reference Mazeina and Navrotsky20 ZnO,Reference Zhang, Xu, Navrotsky, Lee, Kim and Liu21 and ZrO2.Reference Radha, Bomati-Miguel, Ushakov, Navrotsky and Tartaj22 On the basis of our previous calorimetric study of bulk selenides,Reference Deore, Xu and Navrotsky23 we extend our research to nanophase selenides. In this work, to derive the surface energies of hydrated and anhydrous wurtzite CdSe surfaces, we performed high-temperature oxide melt solution calorimetry and water adsorption calorimetry on a set of wurtzite CdSe nanoparticles with different surface areas. They were synthesized by a hydrothermal method without additives to control morphology. Structure and size were characterized by x-ray diffraction (XRD) and N2 adsorption. The surface energies for hydrated and anhydrous surfaces of wurtzite CdSe nanocrystals are reported for the first time and are compared with values obtained from computational studies and with values for oxides.
II. EXPERIMENTAL PROCEDURES
A. Chemicals and synthesis
Analytically pure, reagent grade CdCl2•2H2O (99.998%; Alfa Aesar), Se (+99.5%; Aldrich, St. Louis, MO), Na2SO3 (EMD Chemicals, Gibbstown, NJ), NaOH solution (1N; Alfa Aesar, Ward Hill, MA), bulk CdSe (99.995%; Alfa Aesar, Ward Hill, MA), and deionized water were used. A typical synthesis included two steps: the preparation of fresh sodium selenosulfate (Na2SeSO3) solutions and the synthesis of CdSe. A fresh Na2SeSO3 solution was prepared by a hydrothermal method.Reference Pramanik and Bhattacharya24 First, 1.26 g of sodium sulfite (Na2SO3) was mixed with 20 mL of deionized water. Then, 0.79 g of elemental selenium (Se) was added, and the mixture was transferred to a Teflon-lined autoclave and heated at 180 °C for 1 day. A solution of Na2SeSO3 (~0.5 mol/L) was formed. Then, 3 mmol CdCl2•2H2O was dissolved in 10 mL deionized water to form an aqueous solution, and this CdCl2 solution was mixed with the solution of Na2SeSO3 (6 mL) and its pH value was slowly (2–3 min between drops) adjusted to 10–11 by adding aqueous NaOH solution under stirring. This mixed solution was transferred into a Teflon-lined autoclave and heated at 120–180 °C for 1 day. The precipitate was filtered and washed with dilute HCl to remove the by-products and then washed several times with deionized water and ethanol. Finally, the brownish product was dried under vacuum at 40 °C.
B. Characterization
Powder XRD patterns of the samples were collected using a Bruker AXS D8 Advance diffractometer (Bruker AXS, Inc., Madison, MI) (operating at 40 kV and 40 mA with Cu Kα radiation with a 0.02 step size and 1 s/step). Phase identification was performed using Jade 6.1 software and the PDF file version 2.0 (Materials Data Inc., Livermore, CA). To examine the morphology and aggregation state, transmission electron microscopy (TEM) was performed on a Philips CM-12, operating at 80 kV. TEM samples were prepared by dipping holey-carbon-coated, 400-mesh electron microscope grids into the ethanol solution containing dispersed CdSe nanoparticles and drying them at room temperature overnight. The specific surface areas were measured by N2 adsorption at 77 K using a five-point Brunauer–Emmett–Teller (BET) technique on the analysis port of a Micromeritics ASAP 2020 (Micromeritics Instrument Corporation, Norcross, GA) in the P/P0 range of 0.05–0.3. Before analysis, the samples were pressed into ~15-mg pellets and degassed at room temperature overnight and then at 100 °C for 6 h. Water content of each sample used for the drop solution calorimetry was determined by thermogravimetric (TG) analysis on a Netzsch STA 449 system (Netzsch GmbH, Selb, Germany). The sample pellets (25–30 mg) in a Pt crucible were heated from room temperature to 700 °C at 10 °C/min under a flow of dry argon at 40 mL/min. A buoyancy correction was made by subtracting the baseline collected by running a blank with an empty Pt crucible. The gases evolved during the TG analysis were analyzed by infrared (IR) spectroscopy using a Bruker Equinox 55 Fourier transform infrared spectroscopy (FTIR) spectrometer (Bruker Optics Inc., Billerica, MA), which is coupled with the thermal gravimetry and differential scanning calorimetry (TG-DSC) by a transfer line heated at 150 °C.
C. Oxide melt solution calorimetry
High-temperature oxide melt drop solution calorimetry was performed in a custom-built Calvet twin microcalorimeter as described previously.Reference Navrotsky25, Reference Navrotsky26 Pelletized samples with mass of ~3–5 mg were dropped from room temperature and dissolved in the calorimetric solvent, 3Na2O·4MoO3, at 973 K. The sizes of pellets were chosen to optimize the heat effect obtained for different samples. The pellets were prepared by hand pressing the desired weight of sample in a die. Calibration was done by using the heat content of 135–250 mg platinum rods corrected for heat pickup during drop from room temperature to 973 K. An oxidizing atmosphere was maintained by flushing the calorimeter with oxygen (90–115 mL/min) and by bubbling oxygen through the solvent (11–15 mL/min). Bubbling both helps oxidize the sample and disperses it in the solvent for fast dissolution. Flushing helps to quickly remove water vapor produced in the dissolution. The return of the calorimetric signal to its original baseline within 60 min and the normal shape of the calorimetric peak suggest rapid oxidative dissolution of samples. Under these conditions, all CdSe samples are reproducibly transformed to Cd2+ and SeO42− in the sodium molybdate solvent.Reference Deore, Xu and Navrotsky23
D. Water adsorption calorimetry
Enthalpies of water adsorption were measured at room temperature using a Calvet microcalorimeter, Setaram DSC-111 (Setaram Instruments, Cailune, France), coupled with a Micromeritics ASAP 2020 analysis system (Micromeritics Corp, Norcross, GA). This combined system enables precise gas dosing, volumetric detection of the amount of adsorbed water, and simultaneous measurement of heat effect. Sample pellets were placed on one side of a silica glass forked tube that fits into the twin chambers of the microcalorimeter, the empty side of this forked tube serving as a reference. The samples were degassed under a static vacuum (<10−5 Torr) at ambient temperature overnight and then at 100 °C for 6 h to remove most of the water from the surface. After measurement of the surface area of the sample and the free space of the tube, the system was evacuated again until the sample leak rate became less than 0.6 mmHg/min. Then, a series of precisely controlled small doses of gaseous water were released into the system at room temperature until P/P0 reached ~0.25. The adsorption heat of each dose generated an exothermic calorimetric peak. The simultaneous recording of the amount of adsorbed water and the adsorption enthalpy provided a high-resolution measurement of differential heat of adsorption as a function of surface coverage.
III. RESULTS
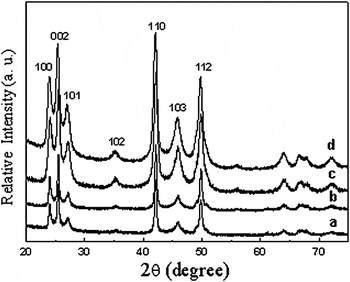
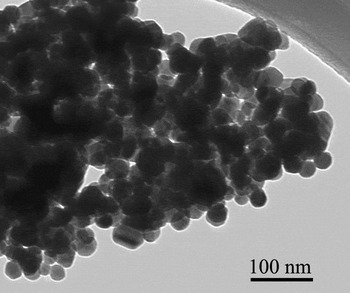
Figure 1 shows the XRD patterns of CdSe samples. All the diffraction peaks could be indexed as wurtzite CdSe (space group P63mc, PDF file no: 62-7293). There is an obvious peak broadening in the diffraction patterns of nanograined samples. The crystal sizes derived from the whole pattern (Rietveld) refinement and the surface areas calculated from XRD assuming a spherical particle shape, together with the BET surface areas, are listed in Table I. The surface area calculated from XRD crystallite size is almost twice as large as the BET surface area. This discrepancy may be indicative of strain and crystal agglomeration. Strain and agglomeration can also contribute to the excess enthalpy in the calorimetric measurement, as discussed later. TEM clearly confirms that an individual grain is a composite of several crystallites, and a representative TEM image is shown in Fig. 2.
X-ray diffraction patterns of wurtzite cadmium selenide (CdSe) nanocrystals with surface area of (a) 17.8 m2/g, (b) 25.4 m2/g, (c) 35. 9 m2/g, and (d) 47.4 m2/g.

Transmission electron micrograph of wurtzite CdSe nanoparticle (surface area of sample is 25.4 m2/g).

Crystal size and surface area (SA) of different CdSe samples.

A theoretical density of 5.816 g/cm3 and spherical shape were assumed for all conversions between particle size and SA. An extra digit is retained to avoid accumulating round-off error.
a Calculated from BET surface area.
b Calculated from XRD crystallite size.
c Calculated from IA = [SA(XRD) − SA(BET)]/2.
The solid-state FTIR spectra (not shown here) reveal a broad ν(O–H) band centered around 3400 cm−1, showing the presence of adsorbed water. The absence of a carbonate band (~1400 cm−1) indicates no carbon dioxide adsorbed on these samples. Thermogravimetric result of all nanophase CdSe samples shows a continuous weight loss at 700 °C. Since only evolved H2O was detected by FTIR, the total weight change is attributed to the loss of water.
The enthalpy of oxidative drop solution of bulk wurtzite CdSe is −434.64 ± 1.92 kJ/mol, which is consistent with our previously reported value (−432.14 ± 5.89 kJ/mol).Reference Deore, Xu and Navrotsky23 The surface water on the nanoparticles cannot be totally removed without coarsening. Therefore, before proceeding with surface energy calculation, one must correct the measured enthalpy of oxidative drop solution of the sample with adsorbed water [ΔH ds(CdSe·nH2O)] for the heat effect associated with the H2O. As discussed previously,Reference Zhang, Xu, Navrotsky, Lee, Kim and Liu21, Reference Radha, Bomati-Miguel, Ushakov, Navrotsky and Tartaj22, Reference Chen, Avila-Paredes, Kim, Zhao, Munir and Navrotsky27 this correction can be done in two ways. Using the heat of evaporation and heat content of H2O provides the enthalpy of drop solution of the sample with hydrated surface, ΔH ds(CdSe, hydrated). Using the measured water adsorption enthalpy allows calculation of the enthalpy of drop solution of the sample with anhydrous surface, ΔH ds(CdSe, anhydrous).
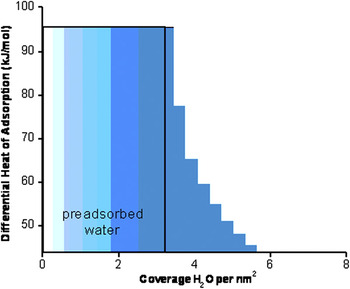
The differential enthalpies of water adsorption versus water coverage are shown in Fig. 3. A decrease in the magnitude of the differential heat of adsorption with increasing H2O coverage is observed, and the differential enthalpy of adsorption approaches the value for water condensation (−44 kJ/mol) at higher coverage. This behavior has been seen for many oxides, such as Al2O3,Reference McHale, Auroux, Perrotta and Navrotsky18 α-Fe2O3,Reference Mazeina and Navrotsky20 and ZnO.Reference Zhang, Xu, Navrotsky, Lee, Kim and Liu21 As shown in Fig. 3, the differential adsorption enthalpy reaches the value for water condensation at a coverage of ~2.8 H2O/nm2. The corresponding integral heat of adsorption at this point is −63.81 ± 0.87 kJ/mol. Thermogravimetry showed that ~3 H2O/nm2 preadsorbed water remained after degassing. Therefore, the total strongly bonded water constitutes a coverage of ~5.7 H2O/nm2, and above this coverage, water is physisorbed. As no data exist for the heat of adsorption for the preadsorbed water, which cannot be removed, we assume that the heat of adsorption for that water is approximated by the heat of adsorption at a coverage of 3.0 H2O/nm2, −92.89 ± 1.32 kJ/mol. According to our previous work,Reference McHale, Navrotsky and Perrotta28 the total integral enthalpy of chemisorption for coverage below 5.7 H2O/nm2 is then −79.11 ± 1.58 kJ/mol. This value is used when calculating the surface energy of the anhydrous surface.
Differential enthalpy of water adsorption as a function of water coverage of the surface. The value −44 kJ/mol corresponds to the enthalpy of water condensation at room temperature. Each step represents an enthalpy of adsorption of a small dose of water vapor (0.003 mmol). The area is proportional to ΔH 5 in Table II. Surface area is that from BET.

The excess enthalpy of CdSe nanoparticles with respect to bulk can be represented as follows:

where ΔH ds,corr(nano) = ΔH ds(CdSe, hydrated) or ΔH ds(CdSe, anhydrous) when the particles are not aggregated.
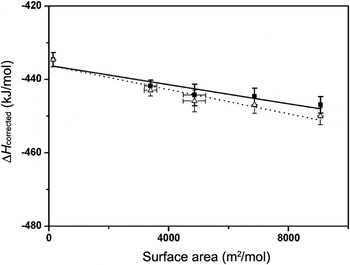
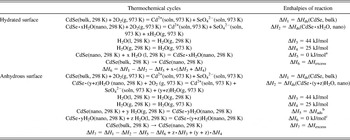
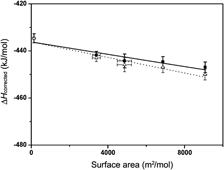
Table II gives the thermodynamic cycle used and Table III summarizes the surface areas, the water contents, the enthalpies of drop solution (ΔH ds) for CdSe·xH2O, and the corrected ΔH ds,corr for water by the two methods described earlier. The ΔH ds,corr(nano) is simply a linear function of surface area with the negative of the slope giving the surface energy. Figure 4 shows that the enthalpies of drop solution corrected for the two types of water contribution are plotted as a linear function of SA(BET). The surface energies are 1.31 ± 0.26 J/m2 for the hydrated surface and 1.65 ± 0.27 J/m2 for the anhydrous surface.
Corrected enthalpy of drop solution of five CdSe samples fitted as a linear function of surface area as SABET. The fit in (a) yields a surface energy of the hydrated surface of 1.31 ± 0.26 J/m2, and the fit in (b) represents a surface energy of the anhydrous surface of 1.65 ± 0.27 J/m2.

Thermochemical cycles for calculation of surface energies of hydrated surface and anhydrous surface of CdSe nanoparticles.

a When assuming that all water adsorbed in the sample is equivalent to liquid water.
b y represents chemi-absorbed water; ΔH 5 is the water adsorption enthalpy of chemisorbed water on the surface of the nanoparticles measured with water adsorption calorimetry.
c z represents physic-absorbed water, which is assumed to be equivalent to liquid water.
Summary of data used for surface energy calculation for CdSe samples.

a The enthalpy of drop solution was corrected by assuming that all water adsorbed in the sample is equivalent to liquid water.
b The enthalpy of drop solution was corrected by using the integral enthalpy of water adsorption obtained from the water adsorption experiments.
Because of the aggregation of nanoparticles, both interface and surface and interface could contribute to the thermodynamics. Because of the aggregation, some surfaces of nanoparticles would be in contact, and an interface is thus formed by the two surfaces. Other surfaces of the nanoparticles would be exposed to H2O without proximity to another surface, and we call them “surface.” Therefore, the corrected enthalpy of drop solution can be expressed in the following equation [Eq. (2)]:

where SA is the surface area (m2/mol), H surface is the surface enthalpy (J/m2), IA is the interface area (m2/mol), and H interface is the interface enthalpy (J/m2). SA can be obtained directly by BET measurement, and the IA not accessible directly can be estimated as followsReference Radha, Bomati-Miguel, Ushakov, Navrotsky and Tartaj22, Reference Zhou, Ushakov, Wang, Ekerdt, Demkov and Navrotsky29:

From our data and Eqs. (1)–(3), we cannot calculate both surface and interfacial enthalpies because ΔH ds for all nanosamples depends linearly on SA. Our earlier study of the yttria-stabilized zirconia systemReference Chen, Avila-Paredes, Kim, Zhao, Munir and Navrotsky27 suggests that interface enthalpy is ~20% of surface enthalpy. If this approximation is valid for CdSe, a calculation of the surface energy (see Ref. Reference Radha, Bomati-Miguel, Ushakov, Navrotsky and Tartaj22 for details) gives the surface energy of the hydrated surface as 1.15 ± 0.24 J/m2 and that of the anhydrous surfaces as 1.45 ± 0.25 J/m2. These values are within experimental error of those without consideration of interfaces arising from agglomeration. Because the ratio of surface energy to interface energy is unknown for CdSe, this calculation is only an indication of the likely magnitude of the correction for interfaces, and we accept the original (uncorrected) values in this article. Any strain in the nanocrystals would also contribute to the measured enthalpy and cannot be effectively separated from the surface energy.
IV. DISCUSSION
Measured surface energies of CdSe nanoparticles are higher than those from theoretical calculations by Manna et al.Reference Manna, Wang, Cingolani and Alivisatos30 for non-polar (10 0) and (11
 0) surface of wurtzite CdSe, 0.67 J/m2 and 0.59 J/m2, respectively. Density-functional theory calculations of non-polar surfaces of wurtzite CdSeReference Csik, Russo and Mulvaney31 gave unrelaxed surface energies of 0.49 and 0.51 J/m2 for (10
 0) and (11
 0) and relaxed surface energies of 0.46 and 0.50 J/m2 for (10
 0) and (11
 0), respectively. Generally, the polar facets ± (0001) have higher surface energy than the non-polar ones. We do not have direct information on surface species, dangling bonds, defects, and different surfaces exposed in the nanoparticles studied. Presumably, a variety of different surfaces are exposed as the particles are roughly spherical or equant in shape. The surface energy we report here is an average over a variety of surface sites present in the samples. Thus, it is reasonable that the measured surface energy is larger than that calculated for the idealized lowest energy surface. Similar differences between the experimental and the theoretical surface enthalpies have been seen for several oxide nanomaterials, namely ZnO,Reference Zhang, Xu, Navrotsky, Lee, Kim and Liu21 ZrO2,Reference Radha, Bomati-Miguel, Ushakov, Navrotsky and Tartaj22 and HfO2.Reference Zhou, Ushakov, Wang, Ekerdt, Demkov and Navrotsky29 We conclude that CdSe has a smaller surface energy than most oxides, including wurtzite ZnO (the surface energy of its hydrated surface is 1.31 ± 0.07 J/m2 and that of the anhydrous surface is 2.55 ± 0.23 J/m2).Reference Zhang, Xu, Navrotsky, Lee, Kim and Liu21 The value of surface energy for CdSe obtained by calorimetry is significantly larger than that from theoretical calculations, possibly reflecting the variety and the imperfection of surfaces exposed in the real material. Such differences between theory and experiment have been seen for oxides as well.Reference Zhang, Xu, Navrotsky, Lee, Kim and Liu21 Possible reasons for the lower surface energy of CdSe (and other chalcogenides), compared to oxides, are their larger lattice parameters, greater covalency, and larger polarizability.
ACKNOWLEDGMENTS
We acknowledge S.V. Ushakov and P. Zhang for discussion on the water adsorption experiments. We thank X.C. Ma for help with TEM analysis. This work was supported by U.S. Department of Energy Grant DOE FG02 97ER14749.