





Most outdoor food advertisements, such as on billboards and bus stops, feature unhealthy foods and beverages(Reference Finlay, Robinson and Jones1). Exposure to food advertising is associated with increases in children’s food consumption(Reference Boyland, McGale and Maden2), which is particularly concerning given the global rise in diet-related ill health and chronic disease(Reference Afshin, Sur and Fay3). Governments around the world have begun exploring action to restrict unhealthy food advertising on their property and assets, aligned with recommendations from the WHO(4). Many local jurisdictions also have statutory obligations to protect community health and to take an active role in public health(Reference Rose, Reeve and Charlton5). Using unhealthy food advertising to generate revenue does not align with this obligation, and policy restricting unhealthy advertising would address this misalignment. While policy momentum is growing, effective implementation depends on clear, operational mechanisms for identifying which advertisements should be restricted.
Policy action by some Australian state and territory governments is underway, including South Australia and the Australian Capital Territory, where advertising restrictions on unhealthy foods and beverages have been introduced on public transport infrastructure such as buses(6,7) . However, responsibility for the policy governing outdoor advertising varies by asset ownership, which has important implications for policy transferability and implementation. In Australia, state governments typically regulate large roadside billboards and public transport networks, whereas local governments control a distinct set of assets, typically including bus shelters, street furniture, council-owned buildings, parks and reserves and local roads and verges. Advertising displayed on local government assets may therefore differ from that found on state-owned assets, particularly where advertising occurs at street level and on community infrastructure. Public health planning responsibilities of local governments have been legislated in several Australian states, including Victoria, South Australia and Western Australia, but few local governments currently have policies to restrict unhealthy food advertising on the property and assets they own. Qualitative research with Australian local governments has identified political willingness, including technical and operational considerations as well as ideological alignment, as key barriers to policy action(Reference Bivoltsis, Klug and Francis8).
A major barrier to developing a policy to restrict unhealthy food advertising is determining which foods and beverages should be restricted(Reference Pomeranz, Cash and Mozaffarian9). Nutrition classification systems (NCS) have been developed to classify foods according to their nutritional quality in an objective and unambiguous way(Reference Scarborough and Rayner10–Reference Dickie, Woods and Machado12), but there are conceptual differences in how to approach this, such as food-based or nutrient-based. Most implemented nutrition policies use NCS that require quantitative information on nutrient content per 100g or 100ml of the food/beverage(Reference Dickie, Woods and Machado12,Reference Labonté, Poon and Gladanac13) . For example, the UK Nutrient Profiling Model uses an algorithm that assigns scores for negative nutrients (energy, saturated fat, total sugar, sodium), which are offset by positive nutrients and foods (fruit, vegetable and nut content, fibre, protein)(14). A scoring threshold is then applied to determine whether foods are considered ‘less healthy’. However, food-based classification is another approach that can categorise foods according to food type, level of processing or alignment with dietary guideline food groups, rather than relying primarily on nutrient composition(Reference Dickie, Woods and Machado12). Several types of NCS have been evaluated for use with fresh and packaged products in the Australian food supply(Reference Dickie, Woods and Machado12) and for application to food advertising on state-owned assets such as public transport(Reference Watson, Richmond and Hughes15). However, NCS were primarily designed for packaged foods and may not be readily applicable in advertising contexts where standardised product information is absent. This challenge is applicable across all media, but it is possible that advertising by local independent food outlets is particularly prominent in outdoor settings, and this could present significant challenges for consistent policy implementation within decentralised local government processes, which lack specialist public health nutrition practitioners. Furthermore, advertising of brand names or logos alone (with no depiction of a food or beverage), which is typically not captured in existing NCS(Reference Sing and Backholer16), may also be prevalent in outdoor advertising settings.
While most packaged foods in Australia are required by the Australia New Zealand Food Standards Code (Food Standards Code) to display a Nutrition Information Panel (NIP) (Standard 1·2·8 of the Food Standards Code)(17), exemptions include fresh produce, single-ingredient foods and foods prepared for immediate consumption, unless a health/nutrition claim is made. Although menu labelling legislation in some Australian states requires large fast-food chains or franchises to display the kilojoule content of items, post-implementation evaluation found only half of outlets displayed nutrient information(Reference Wellard, Havill and Hughes18). Consequently, nutrition information may be unavailable or incomplete for many foods advertised on local government property, which creates uncertainty about whether nutrient-based NCS can be operationalised in this context. Despite exemptions from mandatory nutrition labelling, food businesses remain subject to separate regulatory obligations relating to ingredient and allergen information. Standard 1.2.3 of the Food Standards Code requires mandatory allergens to be declared when present as ingredients(19), and compliance requires food businesses to maintain accurate information about ingredients present in their products. In addition, state and territory food legislation (e.g. Food Act 2003 (New South Wales); Food Act 2006 (Queensland); Food Act 2008 (Western Australia)) establishes offences relating to misleading or deceptive conduct in relation to food, including supplying food that is not of the nature or substance requested by the purchaser or providing false or misleading descriptions of food. However, while such information may exist within food businesses, it is not routinely required to be publicly disclosed and may not be readily accessible for the purposes of monitoring or classifying foods promoted in advertising environments. Empirical evidence is therefore needed to determine whether the information required to apply nutrient- or food-based classification systems is available in real-world advertising settings.
Availability of nutrition information is essential if nutrient-based NCS are to be applied to inform decisions to restrict food and beverage advertising on local government property and assets (such as bus stops and street furniture). Similarly, availability of ingredient information is essential for the application of certain food-based NCS. Therefore, this study aimed to assess the feasibility of applying various types of NCS to food and beverage advertisements displayed on local government property by examining the availability of nutrition and ingredient information required to support such classification.
Methods
Sample
For the purposes of this study, outdoor food and beverage advertising includes advertisements featuring image, text or graphical representations of foods and beverages, as well as advertisements of food/beverage business brands. Images of outdoor food advertising collected in a previous study around schools(Reference Trapp, Hooper and Thornton20) and in a separate audit of bus routes were used. In the study around schools, all local government areas (LGAs) in metropolitan Perth (n 38) were stratified by population density (high v. low) and socio-economic status (high v. low), measured by the Australian Bureau of Statistics Socio-Economic Index for Areas Index of Relative Socio-Economic Disadvantage(21). To capture variation across areas, four LGAs were randomly sampled from each combination of population density and socio-economic status, resulting in sixteen LGAs. In the present study, data collected between July and December 2019 from a 500m radius audit around one randomly selected school in each of the sixteen LGAs were used. Trained research assistants working in pairs (for verification purposes) traversed the 500m area around each school on foot or by car and used a customised application on tablets to capture images of all occurrences of outdoor food and beverage advertising. The International Network for Food and Obesity/NCDs Research, Monitoring and Action Support protocol for monitoring outdoor advertising around child-serving institutions was used(22). A subset of images (n 102) previously coded as ‘roadside’ or ‘bus shelter’(Reference Trapp, Hooper and Thornton20) were used in the present study to align with local government jurisdiction and included free-standing signs, street furniture (seats, bins), bus shelters and billboards. In addition, images from a separate bus shelter audit (n 76) conducted in four LGAs in 2022 were included in the dataset for this study, in order that local government advertising estate was well-represented. These bus shelter audits were based on bus routes provided by four randomly selected LGAs in metropolitan Perth. All bus routes within these four LGAs were audited, and data were collected by two research assistants (for verification purposes) using smartphones to capture images and hard copy audit tools to record the location, asset, description and other details. After excluding images (n 5) of alcohol and liquor store branding (Australian Dietary Guidelines state that there is no safe level of alcohol consumption; therefore, nutrition information is not required to make a decision on restriction) and vitamin supplements (outside the scope of the models tested in this study), the resulting dataset included 173 images.
Classifying images by advertisement type
Advertisements were classified based on the primary product or business being promoted, rather than all foods or beverages depicted within the image. Images of each advertisement were first classified into one of five types: (1) ‘branded packaged product’; (2) ‘food service product – chain’; (3) ‘food service product – independent’; (4) ‘branding only’; and (5) ‘incidental food/beverage’. ‘Incidental food/beverage’ refers to foods and drinks that are not the main focus of the advertisement and are from a non-food business (e.g. a health insurance advertisement featuring an ice cream). A chain was defined as a food service business with three or more outlets, as in previous studies(Reference Pulker, Butcher and Klug23), whereas an independent food service business had less than three outlets. Advertisements featuring ‘branding only’ displayed no representation of food or beverages, but did feature branding elements such as business name and logo.
Determining what foods and beverages were displayed
The foods and beverages displayed on each advertisement were coded into one of eighteen food categories, according to the WHO Nutrient Profile Model for the Western Pacific Region(24). When advertisements featured products for more than one food group, all food groups were coded.
Determining if nutrition and/or ingredient information was available
If the advertisement type was a ‘packaged product’ or ‘food service’, an online search for the nutrition information and ingredient lists of the foods/beverages advertised was conducted. If nutrition information was not available on the manufacturer’s website, supermarket websites were used. The link to the source of available information was recorded. The presence or absence of quantitative ingredient/energy/nutrient information (protein, total fat, saturated fat, trans fat, fibre, sugars, sodium) was recorded. These components are used in NCS internationally(14,24,25) . For advertisements classified as ‘branding only’ or ‘incidental foods/beverages’ searching for nutrition or ingredient information was not applicable.
Results
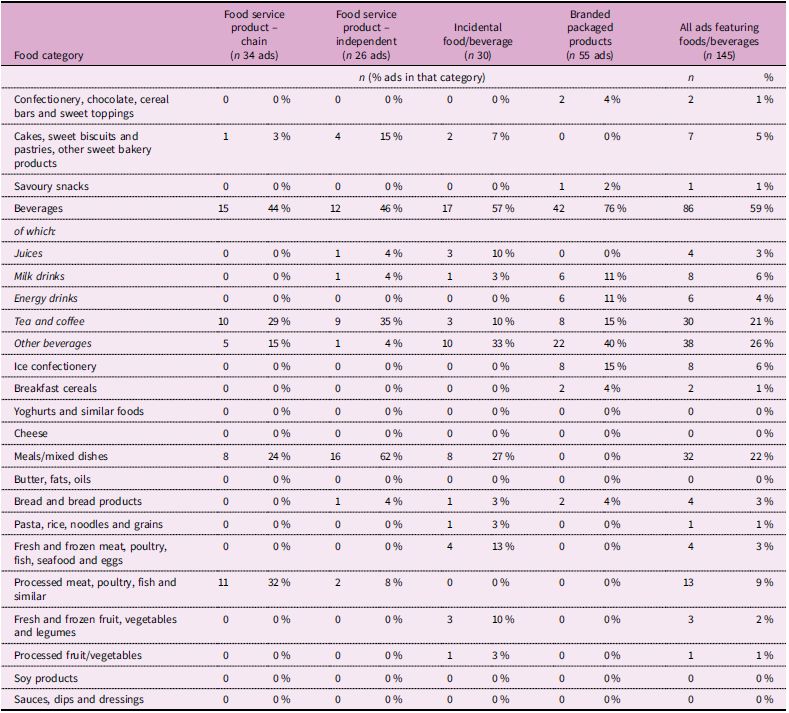
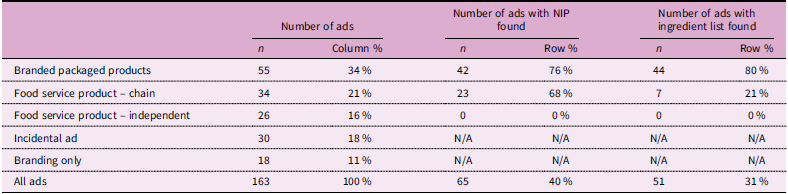
Ten advertisements were for discontinued products, so these were removed before generating descriptive statistics. The types of advertisements present in the remaining sample of 163 were diverse (Table 1): branded packaged products (34 % of advertisements); food service product – chain (21 %); food service product – independent (16 %); incidental food/beverage (18 %); and branding only (11 %). Among the 145 advertisements featuring image, text or graphical representations of foods and beverages (i.e. excluding brand-only advertisements), a wide range of foods and beverages were advertised, with beverages being the most commonly advertised item (featured in 59 % of advertisements) (Table 1). Among the advertisements featuring image, text or graphical representations of foods and beverages (i.e. excluding brand-only ads), nutrition information was found for 45 % (65 of 145) of the advertisements, while ingredient information was found for 35 % (51 of 145) (Table 2).
Categories of foods and beverages featured in 145* advertisements, by advertisement type

Table 1. Long description
A table categorizing types of foods and beverages featured in advertisements by advertisement type. The table has 23 rows and 5 columns. The columns are labeled as Food category, Food service product – chain (n 34 ads), Food service product – independent (n 26 ads), Incidental food/beverage (n 30), Branded packaged products (n 55 ads), and All ads featuring foods/beverages (n 145). The rows list different food categories and the number and percentage of ads in each category. The food categories include Confectionery, chocolate, cereal bars and sweet toppings; Cakes, sweet biscuits and pastries, other sweet bakery products; Savoury snacks; Beverages; Ice confectionery; Breakfast cereals; Yoghurts and similar foods; Cheese; Meals/mixed dishes; Butter, fats, oils; Bread and bread products; Pasta, rice, noodles and grains; Fresh and frozen meat, poultry, fish, seafood and eggs; Processed meat, poultry, fish and similar; Fresh and frozen fruit, vegetables and legumes; Processed fruit/vegetables; Soy products; Sauces, dips and dressings. The Beverages category is further divided into Juices, Milk drinks, Energy drinks, Tea and coffee, and Other beverages. Each cell in the table contains the number and percentage of ads for each food category and advertisement type.
When advertisements featured products for more than one food group, all food groups were coded; therefore, column totals exceed the number of ads, and percentages exceed 100. *Note: Ads in the ‘Branding only’ category did not contain any food or beverages and are therefore not included in this table.
Public availability of Nutrition Information Panels (NIPs) and ingredient lists of outdoor food and beverage advertisements, by advertisement type (n 163)

Table 2. Long description
A table comparing the availability of Nutrition Information Panels (NIPs) and ingredient lists in outdoor food and beverage advertisements by type. The table has 6 rows and 6 columns. Column headers are: Number of ads (n), Number of ads Column (%), Number of ads with NIP found (n), Number of ads with NIP found (%), Number of ads with ingredient list found (n), Number of ads with ingredient list found (%). Row labels are: Branded packaged products, Food service product – chain, Food service product – independent, Incidental ad, Branding only, All ads. Row 1: Branded packaged products, 55, 34 percent, 42, 76 percent, 44, 80 percent. Row 2: Food service product – chain, 34, 21 percent, 23, 68 percent, 7, 21 percent. Row 3: Food service product – independent, 26, 16 percent, 0, 0 percent, 0, 0 percent. Row 4: Incidental ad, 30, 18 percent, N/A, N/A, N/A, N/A. Row 5: Branding only, 18, 11 percent, N/A, N/A, N/A, N/A. Row 6: All ads, 163, 100 percent, 65, 40 percent, 51, 31 percent.
Branded packaged products
Nutrition and/or ingredient information was found for 80 % (44of55) branded packaged product advertisements. However, no packaged products listed trans fat content, and only 14 (25 %) listed fibre. Nutrition information could not be found for the remaining 20 % of packaged products, which comprised ready-to-drink tea, ready-to-drink coffee, milk and bread.
Food service product – chain
For 68 % (23 of 34) food service product chain advertisements, nutrition information was found on the company website. However, none listed trans fat content, and only three listed fibre (data not shown). In comparison with nutrition information, ingredient lists were present for 21 % (7 of 34) items featured in the food service chain advertisements. Those for which nutrition information could not be found were mostly coffee (10 out of 11), and the other was an advertisement in which the specific product variant could not be identified.
Food service product – independent
None of the independent food service outlets had nutrition information or ingredient lists on their websites. Furthermore, all displayed words, drawings or unclear images of foods/drinks depicted generic items rather than a specific product or meal.
Discussion
Applying NCS to outdoor food advertising relies on the availability of accurate nutrition and/or ingredient information. In this study, such information was available for fewer than half of the outdoor advertisements featuring image, text or graphical representations of foods and beverages placed on local government property and assets in metropolitan Perth. While food service outlets are aware of the ingredients used in their products and dishes, it is unknown whether these businesses have information on the nutrient contents (either by lab analyses or estimation using food composition data), as they are currently not required to do so. This lack of accessible product information represents a significant practical barrier to applying an NCS to outdoor food advertising in local government settings.
Outdoor food advertising on local government property in metropolitan Perth was dominated by beverages and meals or mixed dishes (59 % and 22 %, respectively). This predominance of beverages aligns with previous research in other parts of Australia showing that drinks are among the most frequently promoted items in public spaces(Reference Kelly, Cretikos and Rogers26–Reference Settle, Cameron and Thornton28). While some of these advertisements promoted clearly identifiable packaged products (e.g. branded soft drinks displayed on bus shelters) or standardised fast-food meals from large chains, for which nutrition information or ingredients could often be sourced, many others did not. In particular, advertisements for non-packaged foods, such as generic references to ‘fruit smoothies’ or ‘sandwiches available here’ displayed on A-frames outside independent food outlets typically provided no nutrition information or ingredient lists. Although the outdoor advertising landscape included a wide range of foods and advertisement types, the predominance of beverages and mixed dishes promoted in non-specific or non-packaged forms highlights a fundamental mismatch between the information requirements of NCS and the realities of advertising on local government assets. As a result, policies that rely solely on nutrient- or ingredient-based NCS to determine advertising restrictions may be difficult to implement consistently in these settings.
Nutrition information was available for most packaged products and chain food service products, but key nutrients such as trans fat, fibre and added sugar were almost never reported, restricting the ability to apply commonly used nutrient profiling models(Reference Dickie, Woods and Machado12,Reference Labonté, Poon and Gladanac13) . These omissions likely reflect the Food Standards Code labelling requirements, which mandate only energy, macronutrients and sodium, leaving trans fat and fibre optional unless a nutrition or health claim is made. Ideally, labelling requirements would align with public health nutrition objectives and support classification systems that the WHO recommends(24), which, in the case of the Western Pacific Region, includes trans fat and added sugar. Nutrition information from independent food service outlets was largely absent, likely due to the disparities in the labelling obligations of large v. small food businesses. For example, under menu labelling requirements in New South Wales, chain food businesses, defined as having twenty or more outlets in the state or fifty or more outlets nationally, are required to display the kilojoule content of standard menu items(29). Furthermore, food products and meals at independent food service outlets may be less standardised and more variable, for example, reflecting what produce is in season or more affordable locally. Overall, these study findings contrast with a similar study in the UK in which nutrient profiles were able to be located for food featured in outdoor advertising(Reference Finlay, Lloyd and Lake30), which likely reflects the difference in the advertising formats studied, types of businesses advertising and the food operators that dominate. Collectively, these findings demonstrate that the Australian food regulatory system does not support consistent, objective assessment of foods and beverages promoted in outdoor environments in Australia using established nutrient-based NCS.
In practice, applying a nutrient-based NCS to outdoor advertising restrictions would require frequent substitution of missing nutrient data using proxy foods and ingredients. One option would be for the advertiser to allocate missing nutrition values from Food Standards Australia New Zealand (FSANZ) food composition databases (e.g. AUSNUT) or generate an NIP using the FSANZ Nutrient Panel Calculator(31), which food manufacturers are required to produce when certain labelling conditions are met. However, this would place a disproportionate administrative and technical burden on small and independent businesses, who are unlikely to employ nutritionists or food scientists and therefore lack capacity to complete these calculations. This issue of inequitable capacity to comply was raised by end-users during the implementation of the Transport for London advertising restriction policy(Reference Meiksin, Er and Thompson32). As such, Meiksin etal. recommended a consistent process for addressing non-standard foods from independent food service outlets, such as building a database of specific healthy products that could be advertised. Exempting products that do not require NIPs could reduce the burden on smaller businesses but is likely to weaken the effectiveness of the restriction by creating loopholes for larger businesses that choose not to provide nutrition information. Exempting smaller businesses from a policy is another option but may also weaken the effectiveness of restrictions. In practice, local governments in England implementing such policies have generally avoided business-size exemptions, although some provide support services to help small and medium-sized businesses apply the nutrient profiling model(33). These considerations demonstrate the inherent tension between feasibility, equity and effectiveness when applying nutrient-based classification systems in advertising policy.
Beyond nutrient composition, ingredient information provides an alternative or complementary pathway for classifying foods, though feasibility depends on the level of detail required. Ingredient information availability was included in this study because several NCS use ingredient criteria, either alone or in combination with nutrient thresholds, to determine product classification (e.g. FSANZ Nutrient Profiling Scoring Criterion(34) and NOVA, a food processing classification system(Reference Monteiro, Cannon and Levy35)). Ingredient lists were available for most branded packaged products, but for only a few food service products. Australian food regulations require ingredient disclosure on packaged food labels (Standard 1.2.4 of the Food Standards Code)(36), but not for food service items unless a claim is made. Food labels are required to list ingredients in order from largest to smallest, but only characterising ingredients are required to note the percentage present in the finished product (Standard 1.2.10 of the Food Standards Code)(37). This limits the feasibility of ingredient-based classification approaches to identifying the presence or absence of ingredients rather than quantifying content accurately. Overall, these findings suggest that while quantitative ingredient data are largely inaccessible, qualitative ingredient information may offer a feasible pathway for certain classification systems, highlighting a middle ground between nutrient-based and food category–based approaches, but further research on this is needed.
Given the challenges in accessing nutrient and ingredient information of foods and beverages advertised outdoors, a more pragmatic approach in Australia is to use a food category–based classification system. In such a system, foods and beverages are grouped into predefined categories based on their characteristics, alignment with dietary guidelines and overall nutritional profile (e.g. fruits, vegetables, savoury snacks, sugar-sweetened beverages and meals)(Reference Dickie, Woods and Machado12). Decisions about whether a product is permitted or restricted are made at the category level rather than by evaluating the precise nutrient composition of individual items, which reduces ambiguity and simplifies enforcement. By relying on categorical rather than quantitative product information, a food category–based classification system could offer greater transparency, feasibility and fairness in the local government context where individuals may not have nutrition expertise. It would also align more closely with the primary policy intent of outdoor advertising restrictions, which is to limit the promotion of foods and beverages that are inconsistent with population dietary guidelines, rather than incentivising marginal nutrient differences within inherently unhealthy product categories. But there are benefits and limitations to any model selected to consistently identify unhealthy food and drinks for advertising restrictions. For a food category–based classification system, the benefits of a simpler model that does not require nutrition expertise also mean that categories that contain some products with a healthier profile will be grouped with other similar products considered unhealthy and therefore restricted. If any of these categories comprised mainly branded packaged products, a nutrient cut-point may be useful and appropriate. Overall, a classification system that is primarily food category-based could provide a practical and equitable approach for restricting unhealthy food advertising, but there is a lack of such a system that can be applied consistently across multiple users(Reference Whitton, Klug and Bivoltsis38).
Eleven per cent of the advertisements in our sample feature brand advertising, with no depiction of a food or beverage. This type of advertising has been identified as an important marketing tactic that increases brand awareness and preference(Reference Sing and Backholer16). It has been proposed that a brand classification framework is used, in which the brand’s most visible product(39), top five selling products(Reference Sing and Backholer16) or its entire product portfolio(Reference Jordan, Garton and Mackay40) would be used to determine whether the brand may be advertised or not. However, each approach has substantial limitations relating to subjectivity in classification rules, reliance on detailed and often unavailable product-level or sales data and feasibility for operational use by local governments. Such methods would require ongoing updating to reflect changes in product portfolios, nutrient composition and market share over time, which could introduce significant administrative burden and reduce their suitability for routine application in regulatory and enforcement settings. A more practical approach taken by several UK local councils is to restrict brand advertising of all food and beverage companies, unless a healthy food or drink is depicted along with the brand advertising. While this successfully restricts brand advertising in isolation, permitting brand advertising alongside a healthy product has been criticised, because exposure to a ‘healthy’ fast-food advertisement is not associated with subsequent healthier food choices(Reference Boyland, Kavanagh-Safran and Halford41). Overall, this highlights critical implementation challenges in restricting unhealthy food advertising and indicates that a two-pronged approach, targeting both unhealthy products and food and beverage brand advertising, is required in contemporary restriction policy.
Some limitations are to be considered when interpreting the study findings and whether they have resulted in an under- or oveestimate of advertisements with available nutrition and ingredient information. Several years have elapsed since data collection, which means the advertisements may not reflect recent shifts in the outdoor advertising landscape, such as the growth of food delivery businesses, whose advertisements are more likely to feature generic rather than branded products or meals. Furthermore, the generalisability of these results is likely limited to metropolitan areas in Australia and to areas around metropolitan schools and may not reflect patterns of advertising in regional and remote areas of Australia. Although the selection of LGAs was intended to capture variation across areas, the schools randomly selected within the LGAs may not have been representative of the overall profile of schools in that area. Excluding the four bus route audits, the remainder of the advertisements (60 %) were collected surrounding schools. The advertisements surrounding schools may not reflect the advertisements placed further away from schools. For example, it may be that more products that appeal to children are placed in close proximity to schools, and it is unknown whether these products are more or less likely to have nutrition or ingredient information available.
Conclusion
Nutrient-based NCS may be described as objective and therefore fairer to industry because they distinguish between products within a food category and provide a clear (although arbitrary) line between products that are permitted and restricted. However, this fairness is theoretical and depends on consistent, verifiable product data, which current Australian food legislation does not support. Fewer than half of all food and beverage advertisements on local government property had nutrition or ingredient information available; therefore, they could not be easily categorised using an NCS. Consequently, in practice, quantitative profiling of foods and beverages could create hidden inequities favouring large manufacturers with the resources and expertise to produce and validate detailed product information. A classification system, based primarily on food categories, with nutrient limits for some categories and a robust approach to brand advertising, is likely to offer a more practical and impactful approach for local governments aiming to restrict unhealthy food advertising.
Acknowledgements
The authors would like to acknowledge Dr Sharonna Mossenson for providing insightful comments on this work. An AI Language Model (Google Gemini) was used to refine writing in parts of the discussion section but was not involved in the generation of ideas and content of this manuscript.
Authorship
Funding acquisition – C.E.P., G.T.; Conceptualisation – C.W., C.E.P., F.K.; Data acquisition – G.T., A.S.; Investigation – C.W., M.M.; Formal analysis – C.W.; Interpretation – all; Writing (original draft) – C.W.; Writing (review and editing) – all.
Financial support
This study was funded by a Healthway Health Promotion Grant (number G-202402-86292). Healthway had no role in the design, analysis or writing of this article. The study was also supported by a Western Australian Future Health Research and Innovation Fund, Near Miss Award (grant number WANMA2023Ideas/7). GT was supported by a Stan Perron Foundation People and Platforms Grant and an Edith Cowan University Vice Chancellor’s Professorial Fellowship. CP was supported by the Western Australian Future Health Research and Innovation Fund (Grant ID WANMAEL2025-26/2).
Competing interests
None.
Ethics of human subject participation
As the study did not involve human participants, it was determined to be out of scope from human or animal research ethics review by the Edith Cowan University Human Research Ethics Committee.

 Open access

