


Introduction
The active layer was originally defined as ‘ground above permafrost which thaws in summer and freezes in winter’ (Burn Reference Burn1998 p. 411). More recently, the maximum seasonal penetration of the 0°C isotherm into the ground is said to govern the thickness of the active layer (Burn Reference Burn1998). While it is acknowledged that moisture in the ground does not necessarily freeze at 0°C, this boundary remains a basis for discussing active layer variability via maximum seasonal penetration given its acceptance in the published literature.
According to Turner et al. (Reference Turner, Bindschadler, Convey, Di Princo, Fahrbach, Gutt, Hodgson, Mayewski and Summerhayes2009), the active layer is deepest in the Antarctic during early February. Climate variations at different time scales induce certain responses in the permafrost and active layer thermal regime. Existing records have shown that variations within the active layer are regulated by climatic trends and local conditions at the surface and in the substrate on multiple temporal scales (Anisimov et al. Reference Anisimov, Vaughan, Callaghan, Furgal, Marchant, Prowse, Vilhjálmsson and Walsh2007, Guglielmin et al. Reference Guglielmin, Balks, Adlam and Baio2011). At a seasonal level, fluctuations of air temperature are reflected in the upper few centimetres of the ground with its impact diminishing with depth (Guglielmin et al. Reference Guglielmin, Balks, Adlam and Baio2011).
In permafrost environments, the active layer is host to the majority of biological and hydrological processes, and can be likened to a membrane which allows the exchange of heat, moisture and gas between the atmospheric and terrestrial components of the Antarctic landscape (Anisimov et al. Reference Anisimov, Vaughan, Callaghan, Furgal, Marchant, Prowse, Vilhjálmsson and Walsh2007). Due to the crucial role of the active layer in Antarctic terrestrial landscapes, its characterization is of the utmost importance for biological and cryospheric life sciences (Vieira et al. Reference Vieira, Bockheim, Guglielmin, Balks, Abramov, Boelhouwers, Cannone, Ganzert, Gilichinsky, Gotyachkin, Lopez-Martinez, Meiklejohn, Raffi, Ramos, Schaefer, Serrano, Simas, Sletten and Wagner2010). Despite numerous references to increasing active layer thickness (ALT) in the Northern Hemisphere since the 1990s, long-term records of active layer regimes and knowledge regarding ALT change in the Antarctic are less prevalent (Bockheim & Hall Reference Bockheim and Hall2002, Vieira et al. Reference Vieira, Bockheim, Guglielmin, Balks, Abramov, Boelhouwers, Cannone, Ganzert, Gilichinsky, Gotyachkin, Lopez-Martinez, Meiklejohn, Raffi, Ramos, Schaefer, Serrano, Simas, Sletten and Wagner2010, Bockheim et al. Reference Bockheim, Vieira, Ramos, López-Martínez, Serrano, Guglielmin, Wilhelm and Nieuwendam2013). In the Antarctic, research on the active layer has mainly taken place on the Antarctic Peninsula and in the Transantarctic Mountains (particularly Victoria Land and the McMurdo Dry Valleys); leaving observational gaps throughout the rest of the continent, including western Dronning Maud Land (WDML) (Vieira et al. Reference Vieira, Bockheim, Guglielmin, Balks, Abramov, Boelhouwers, Cannone, Ganzert, Gilichinsky, Gotyachkin, Lopez-Martinez, Meiklejohn, Raffi, Ramos, Schaefer, Serrano, Simas, Sletten and Wagner2010).
Numerous factors impact on the thickness of the active layer, such as vegetation type and density (Almeida et al. Reference Almeida, Schaefer, Fernandes, Pereira, Nieuwendam and Pereira2014), snow cover (Guglielmin et al. Reference Guglielmin, Worland, Baio and Convey2014a), thermal properties of the substrate (de Pablo et al. Reference De Pablo, Blanco, Molina, Ramos, Quesada and Vieira2013), moisture content (Seybold et al. Reference Seybold, Balks and Harms2010) and incoming radiation (Adlam et al. Reference Adlam, Balks, Seybold and Campbell2010). The influence of air temperature, specifically during the summer, on the thickness and thermal regimes has been the central focus of active layer studies in Antarctica (Guglielmin Reference Guglielmin2004, Reference Guglielmin2006, Cannone et al. Reference Cannone, Evans, Strachan and Guglielmin2006, Conovitz et al. Reference Conovitz, MacDonald and McKnight2006, Bockheim et al. Reference Bockheim, Campbell and McLeod2007, Adlam et al. Reference Adlam, Balks, Seybold and Campbell2010, Guglielmin et al. Reference Guglielmin, Balks, Adlam and Baio2011, Reference Guglielmin, Worland and Cannone2012, Reference Guglielmin, Worland, Baio and Convey2014a).
The main objective of this study was to understand the annual and seasonal variability of the ground thermal regime and ALT at Vesleskarvet in WDML, and the influence thereon by meteorological parameters such as air temperature, incoming radiation and pressure. For the purpose of this study, the summer was defined as 1 December to 28 February (DJF) and the winter as 1 June to 31 August (JJA). Knowledge of climate–cryosphere interactions will provide a foundation for bridging the knowledge gap of permafrost and active layer dynamics in WDML as noted by Vieira et al. (Reference Vieira, Bockheim, Guglielmin, Balks, Abramov, Boelhouwers, Cannone, Ganzert, Gilichinsky, Gotyachkin, Lopez-Martinez, Meiklejohn, Raffi, Ramos, Schaefer, Serrano, Simas, Sletten and Wagner2010). A shallow borehole was set up in 2009 to measure ground temperatures and soil moisture at Vesleskarvet. Here, six years of air and ground temperatures, and soil moisture measurements are presented with a particular focus on 2010 to discuss the relationship between the ground–atmosphere interfaces.
Site description, instrumentation and methods
Study site
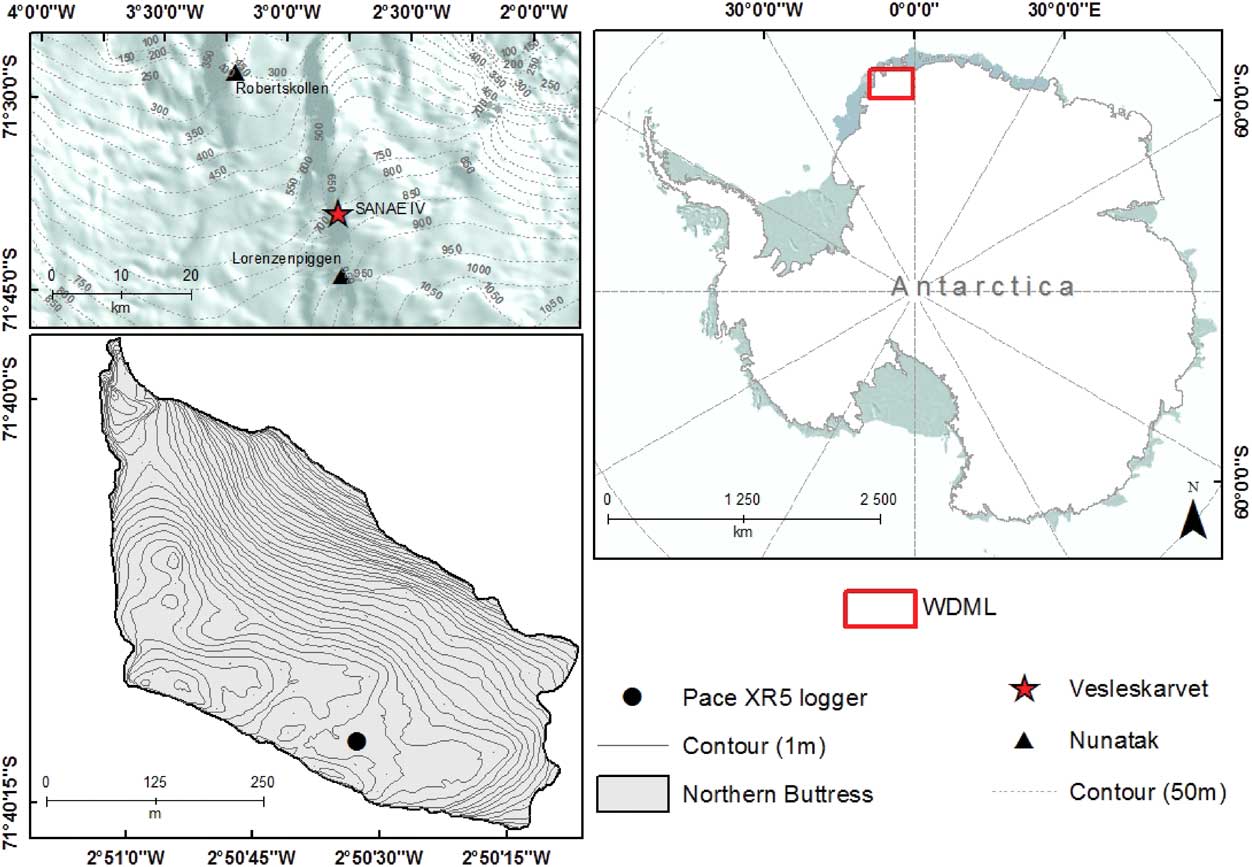
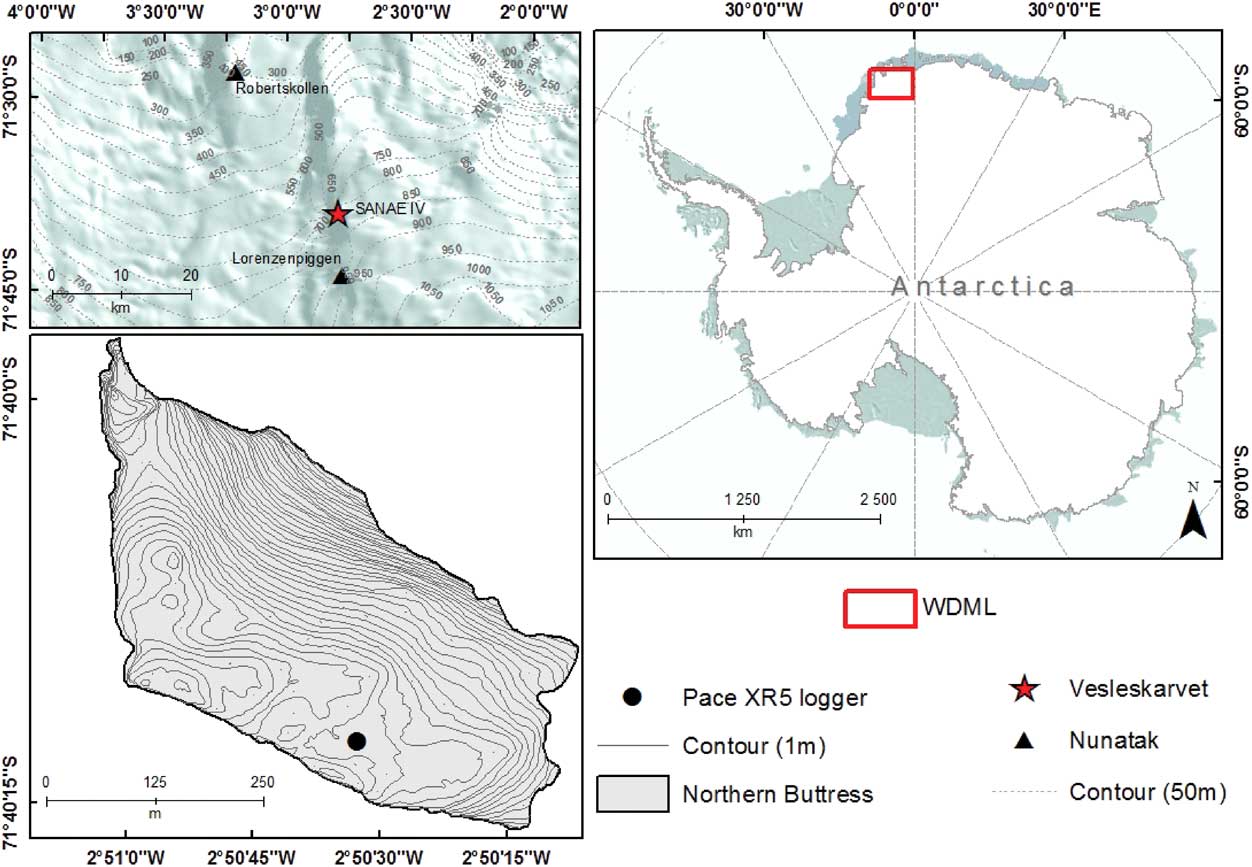
In February 2009, a 60 cm borehole was installed on the northern buttress of Vesleskarvet (Fig. 1), a flat-topped Mesoproteorozoic dolerite sill of the Borgmassivet Suite (71°40'S, 2°51'W, 848 m a.s.l., 160 km from the edge of the Fimbul Ice Shelf ) (Marshall et al. Reference Marshall, Crafford, Krynauw, Drummond and Newton1995, Hansen et al. Reference Hansen, Meiklejohn, Nel, Loubser and van der Merwe2013). The borehole is located in a vegetation-free depression, characterized by mineral sediment with little to no organic content, substantiated by a bulk density value close to 2.0 gcm-3. The gravimetric moisture content (GMC) measured at the logger on 24 January 2014 was 7%; a result of the topographical depression in conjunction with meltwater infiltration from the previous week’s snowstorm. Despite moisture presence in the upper few centimetres of the ground, the permafrost in WDML was observed as being dry, demonstrated by a lack of ice content during borehole excavation. The dominant wind direction at Vesleskarvet is from the east, averaging a speed of 11 m s-1 (Kärkäs Reference Kärkäs2004, Hansen et al. Reference Hansen, Meiklejohn, Nel, Loubser and van der Merwe2013). Average ambient air temperatures in the summer (DJF) and winter (JJA) months were -8.6°C and -22.8°C, respectively, with a temperature range of 34.5°C. The annual average recorded minimum and maximum air temperatures (2009–14) were -37.4°C and 5.4°C, respectively. Snow is the primary source of precipitation on the WDML plateau, with between 55–81 mm of water equivalent received annually (Reijmer & van den Broeke Reference Reijmer and van den Broeke2001, Kärkäs Reference Kärkäs2004). According to Hansen et al. (Reference Hansen, Meiklejohn, Nel, Loubser and van der Merwe2013), the ground surface of the Vesleskarvet nunatak is characterized by a dolerite blockfield, which encourages the development of meltwater pools around the study site, due to its dark colouration.
Location of the study site.
Instrumentation
The implementation of Circumpolar Active Layer Monitoring networks in Antarctica is different to the strategy used in the Arctic as the rocky terrain inhibits mechanical probing and the use of 100×100 m grids (Vieira et al. Reference Vieira, Bockheim, Guglielmin, Balks, Abramov, Boelhouwers, Cannone, Ganzert, Gilichinsky, Gotyachkin, Lopez-Martinez, Meiklejohn, Raffi, Ramos, Schaefer, Serrano, Simas, Sletten and Wagner2010). Therefore, the site at Vesleskarvet was excavated to provide a shallow borehole (<2 m depth), forming part of the Antarctic permafrost borehole network (Vieira et al. Reference Vieira, Bockheim, Guglielmin, Balks, Abramov, Boelhouwers, Cannone, Ganzert, Gilichinsky, Gotyachkin, Lopez-Martinez, Meiklejohn, Raffi, Ramos, Schaefer, Serrano, Simas, Sletten and Wagner2010). A soil pit was dug into permafrost, to a depth of 60 cm, to install five thermistors at intervals below the surface (1, 15, 30, 45 and 60 cm). The temperature probes provide a total system accuracy of ±0.15°C for temperatures between 0 and 40°C, and ±0.3°C at -25°C and 85°C. At 1 cm depth, a Decagon EC5 soil moisture sensor was installed which measures volumetric water content from 0–100% in all soil types using a 5 cm active sensor length and two prong design. The thermistors and soil moisture sensor were connected to a PACE Scientific XR5 datalogger which records data according to the protocols suggested for Antarctic Permafrost and Soils (ANTPAS), with measurements at hourly intervals (Vieira et al. Reference Vieira, Bockheim, Guglielmin, Balks, Abramov, Boelhouwers, Cannone, Ganzert, Gilichinsky, Gotyachkin, Lopez-Martinez, Meiklejohn, Raffi, Ramos, Schaefer, Serrano, Simas, Sletten and Wagner2010). The pit was carefully refilled in order to return the site, as close as possible, to its original condition, and protect the sensors from being disturbed. Protected by a radiation shield at 1 m above the ground, ambient air temperature was also measured by a thermistor and recorded on the datalogger. The datalogger at Vesleskarvet began recording in February 2009; thereafter, data were manually downloaded each summer.
Data
Ground thermal data were obtained from the PACE Scientific XR5 datalogger, whilst air temperature was analysed using the South African Weather Service (SAWS) meteorological station located at SANAE IV (±300 m away). Since the elevation of the study site and meteorological station were the same, lapse rate corrections were unnecessary. Meteonorm® (v. 7.0) was used to obtain radiation data calculated using the hemispherical potential of incoming radiation with stochastic models that generate hourly values at any desired location on Earth (Remund et al. Reference Remund, Müller, Kunz, Hugenin-Landl, Schmid and Schilter2014). Two primary types of radiation outputs are provided by Meteonorm, direct normal radiation (Bh) and global horizontal radiation (Gh) (Gh=Bh+diffuse horizontal radiation). Following Guglielmin & Cannone (Reference Guglielmin and Cannone2012), global radiation values were used for this study because the Meteonorm uncertainty ranges were less than that of direct normal radiation (Gh=2–10% uncertainty, Bh=3.5–20% uncertainty) (Remund et al. Reference Remund, Müller, Kunz, Hugenin-Landl, Schmid and Schilter2014). The Neumayer, Novolazarevskaya and Showa stations (224, 533 and 1579 km from the study site, respectively) were used as radiation interpolation locations by Meteonorm to create the data. The climatological data available for radiation was 1991–2010, which was the period analysed by Meteonorm. Because the outputted data for the 19 year period is averaged by Meteonorm, analysis undertaken regarding the relationships between radiation, temperature and ground thermal data were undertaken for 2010.
Active layer determination and characterization
With the help of continuous ground thermal records at 1, 15, 30, 45 and 60 cm below the surface, ALT was determined by the graphical interception of the 0°C axes by the annual maximum temperature exhibited at each depth (Guglielmin et al. Reference Guglielmin, Balks and Paetzold2003, Reference Guglielmin, Fratte and Cannone2014b, Adlam et al. Reference Adlam, Balks, Seybold and Campbell2010, Guglielmin & Cannone Reference Guglielmin and Cannone2012).
For a better understanding of the nature of the relationship between ground thermal regimes and air temperature, the following were quantified: thawing and freezing hours, degree days of freezing (DDF, sum of mean daily temperature below 0°C) for air and near-surface, thermal stress index (TSI, daily maximum near-surface temperature (NST) minus daily minimum NST), the freezing n-factor (nf, the ratio of the DDF sum at the soil surface to that in the air for the thawing period), surface thermal offset (SO, difference between NST and air temperature), and potential freeze–thaw events (PFTE, number of times that hourly mean NST crossed the threshold of 0°C) (Guglielmin et al. Reference Guglielmin, Worland, Baio and Convey2014a, Wilhelm et al. Reference Wilhelm, Bockheim and Kung2015). Freeze–thaw events for the whole year were used to calculate DDF, contrary to the standard of a seasonal time period (Farbrot et al. Reference Farbrot, Isaksen, Etzelmüller and Gisnås2013). Since the logger does not record ground surface temperature (GST; 2 cm depth), NST (1 cm depth) are used for calculating the thermal indices.
Statistical analysis
Correlation and linear regression analysis were undertaken using Microsoft Excel (v. 2008) to determine the seasonal influence of individual climate parameters on ground temperature. General linear models (glm) were created using R (v. 3.1.0.) and facilitated determining a regression relation between a response variable and multiple explanatory variables using daily averaged data from the full 2010 dataset. The results from the glm were ranked according to their Akaike information criterion (AIC) using the dredge function from the MuMIn library. Thereafter, the model with the lowest AIC was chosen as the model with the best fit, and rerun with only the most significant parameters to determine the significance of the relationships between response and explanatory variables.
Results
Active layer depth
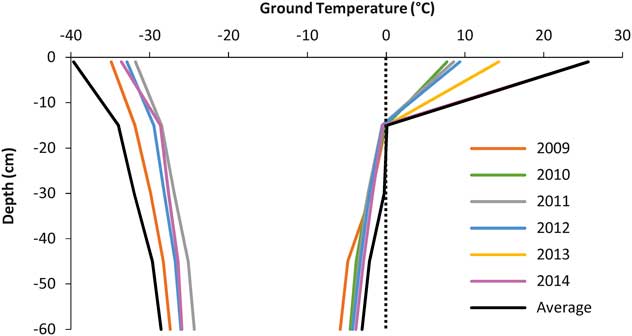
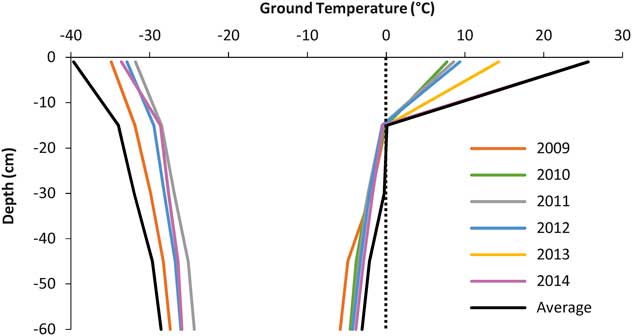
Active layer depths for each year were calculated using the intercept of the maximum ground thermal regimes with the 0°C isotherm (Fig. 2). The 0°C isotherm threshold was crossed annually at ~15 cm depth, indicating the typical depth of the active layer. The average active layer depth for the six year period was ~16 cm, with the maximum active layer depth in 2013. Minimum ground thermal regimes exhibit a large interannual variability, with 2011 and 2013 showing the warmest minimum temperatures, and 2009 and 2010 the coldest minimum temperatures (Fig. 2). Overall, the NST minima varied from -40°C to ~-30°C between 2009 and 2014. The same trend is apparent for maximum annual ground thermal regimes; the warmest maximum temperatures were experienced in 2013 and 2014. The NST maxima increased from ~10–30°C during the period monitored (Fig. 2).
Yearly minimum (left) and maximum (right) ground thermal regimes with depth at Vesleskarvet, 2009–14 (2013 minimum excluded due to logger malfunctions experienced during winter).
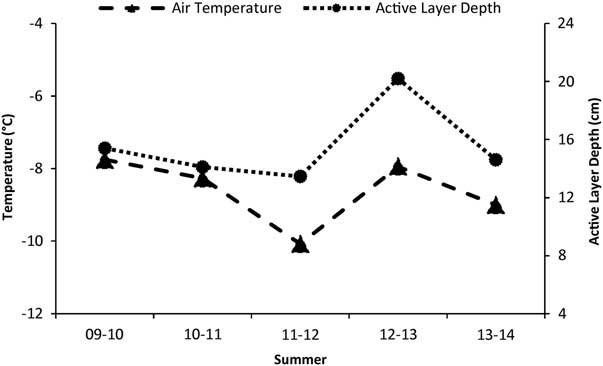
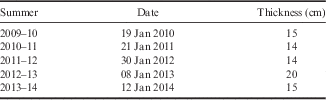
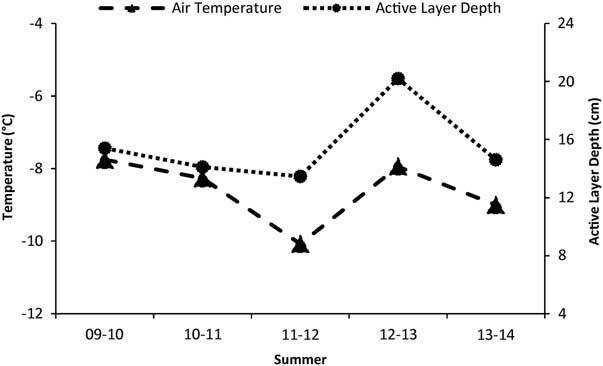
A temporal variation of the maximum active layer depth at Vesleskarvet was observed between summers (Fig. 3). Once again, the intercept of ground temperature with the 0°C isotherm (Fig. 2) was used to obtain the summer active layer depth. The date of this intercept varied interannually within January, with no trend of an increasing or decreasing active layer depth (Table I). Mean summer air temperature appeared synchronous with active layer depth over time (Fig. 3).
Active layer depth and mean summer (DJF) air temperature at Vesleskarvet.
Maximum active layer depth and date (day/month/year) of the deepest measured melting (0°C) during summer at Vesleskarvet.
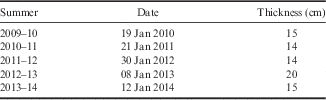
At Vesleskarvet, the summers of 2012/13 and 2013/14 had the highest average SO between air temperature and NST of 0.9°C and 1.6°C, respectively. This is consistent with a deeper snowpack than previous summers (personal observation). Whilst the summers of 2009/10, 2010/11 and 2011/12 exhibited a more synchronous active layer depth with air temperature, with average thermal offsets of 0.6, 0.4 and 0.6, respectively (Fig. 3). Summer 2011/12 exhibited a marginally lower active layer depth despite a marked decrease in air temperatures. The opposite was true for the summer of 2012/13 with a sharp increase in active layer depth accompanied by a sharp rise in air temperature (Fig. 3).
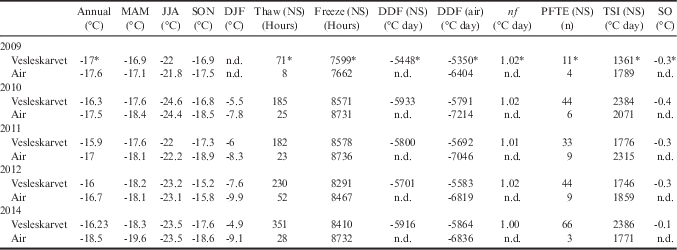
The highest recording of thaw hours, TSI and PFTE in NST at Vesleskarvet occurred in 2014, with 2009 showing the lowest thaw hours, freeze hours, DDF and PFTE in NST (Table II). The TSI was also extremely high in 2010, concurrent with the finding that 2010 had both the highest maximum and lowest minimum air temperatures of all the years at 6.7°C (22 December 2010) and -40.8°C (7 July 2010), respectively. The annual NST range in 2010 matched the range in air temperature at ~47°C. The increasing amount of thaw hours and PFTE over the study period indicates a definite warming of the active layer, despite no trend in active layer thickening.
Annual and seasonal means for near-surface (NS) temperature at Vesleskarvet and South African Weather Service air temperature, thaw hours, freeze hours, degree days of freezing (DDF), n-factor (nf), potential freeze–thaw events (PFTE), thermal stress index (TSI) and surface offset (SO) for 2009–14.
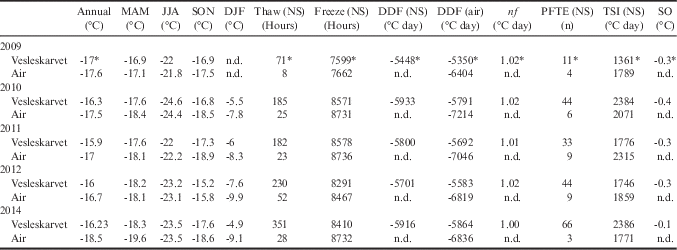
* Air and NST data missing from January to mid-February 2009.
2013 data omitted due to logger malfunctions from mid-January to late December.
DJF=December, January and February, JJA=June, July and August, MAM=March, April and May, SON=September, October and November.
Vesleskarvet shows negative SO for every year, indicating that air temperature was marginally warmer than ground temperature for most of the year. The same was found for the freezing nf which was consistently above 1, and at exactly 1 during 2014, which indicates equal annual air and NST values. Overall, soil NST is generally slightly colder than air temperature.
Ground thermal regime
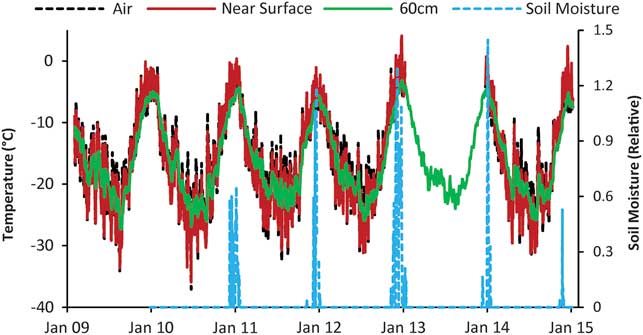
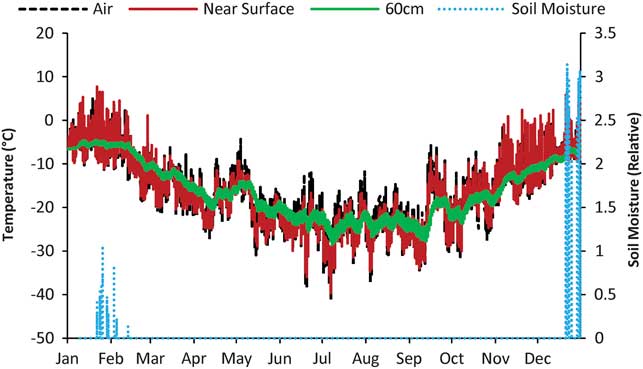
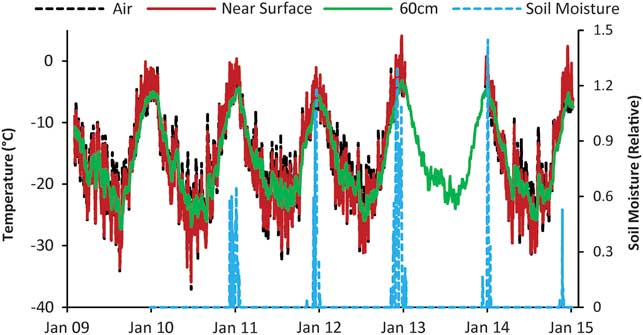
The air temperature at Vesleskarvet had an average annual amplitude of 47.6°C for 2009–14 (Fig. 4). Air temperature during winter months fluctuates more than during summer (Figs 4 & 5). In winter, NST shows attenuated variations due to increasing snow cover. In summer these attenuations cease as a result of the strong relationship between NST and air temperature from late spring to autumn when the site is snow-free, allowing larger observable daily fluctuations in NST during summer (Figs 4 & 5).
Air temperatures, ground temperatures and relative soil moisture data for Vesleskarvet (2009–14) (data missing from mid-January 2013 to early January 2014).
Air temperatures, ground temperatures and relative soil moisture data for Vesleskarvet in 2010.
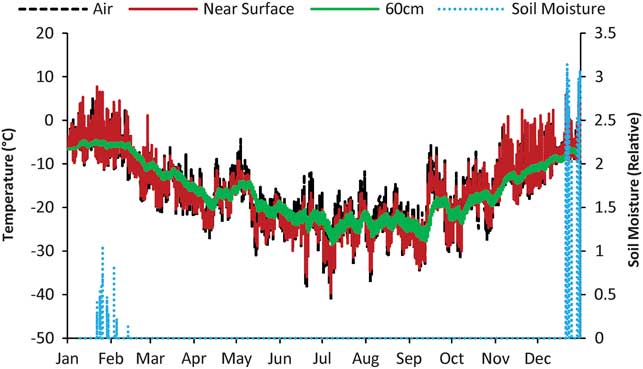
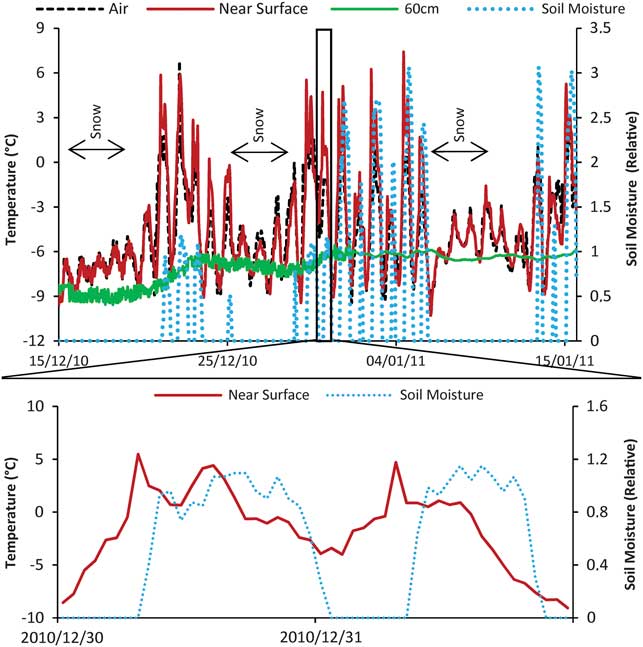
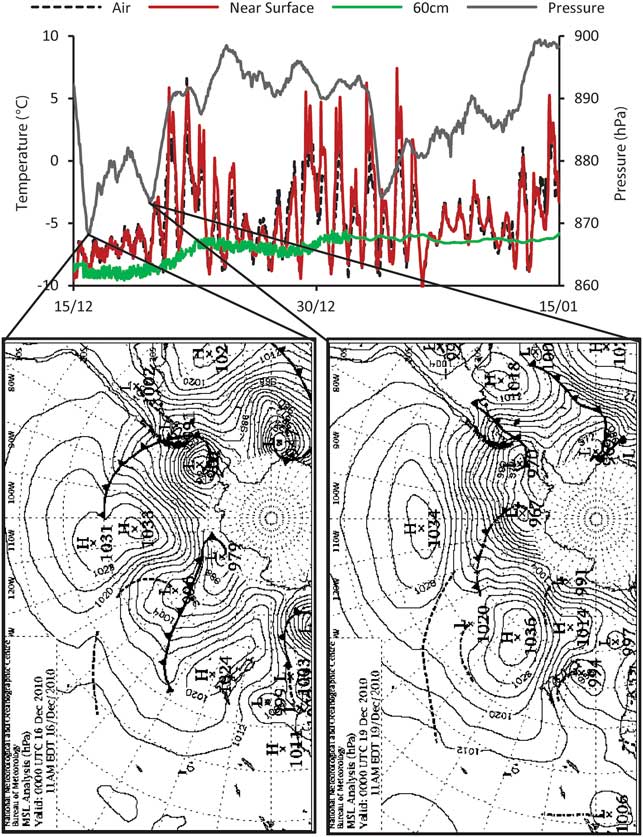
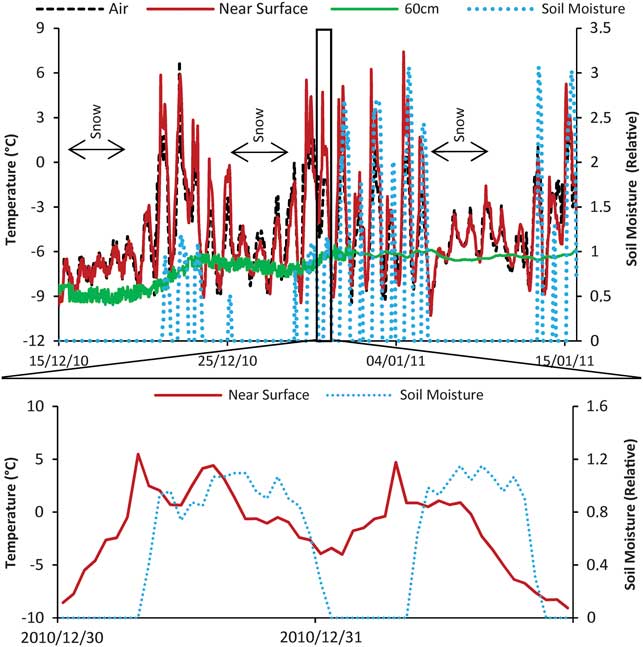
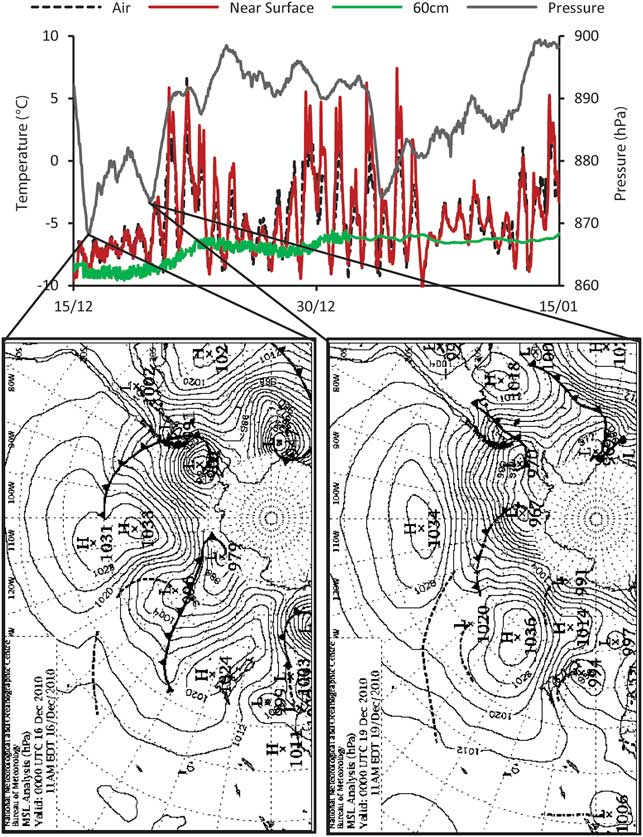
Snow fall events are easily identifiable through closer inspection of the 2010 summer data (Fig. 6) by stabilization of ground temperature over a short time period. Thereafter, a progressive warming of the GST is apparent as the snow melts, leading to an increase in soil moisture content. The maximum soil moisture contents are synchronous with increases in NST (Fig. 6). Concurrently, lower pressures were mostly experienced during the periods of snow fall (Fig. 7). This is supported by synoptic charts obtained from the Australian Bureau of Meteorology, which show strong low pressure systems moving along the coast of WDML on 16 and 19 December 2010, accounting for the first two dips in pressure (Fig. 7). A large low pressure cell present on 4 January 2011, slightly to the east of the WDML coastline, resulted in the pressure trough preceding snowfall events after 6 January 2011 (Fig. 7).
Air temperatures, ground temperatures and relative soil moisture during the 2010/11 summer with an excerpt focusing on 30–31 December 2010.
Air temperatures, ground temperatures and atmospheric pressure for the 2010/11 summer for Vesleskarvet with accompanying synoptic charts from the Australian Bureau of Meteorology.
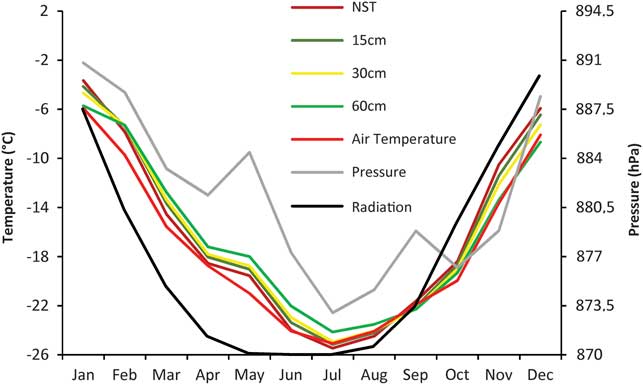
Relationship between ground temperatures and mean summer air temperature, radiation and pressure (2010)
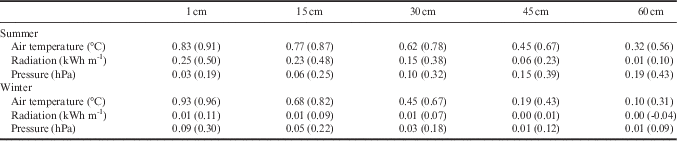
To elucidate the role of synoptic events on active layer dynamics at Vesleskarvet, meteorological variables were compared with the observed ground thermal regime. Despite a relatively weak correlation between active layer depth and mean summer air temperature (1 December 2009 to 28 February 2010) at Vesleskarvet (R=0.58), a strong relationship was found between mean summer air temperature and mean summer ground temperature (Table III). Correlations between air temperature and ground temperature ranged from R=0.56 to R=0.91 (Table III). This was substantiated by glm results in R which showed a highly statistically significant relationship (P=0) between air temperature and ground temperature at a depth of 15 cm (Fig. 8). Coincidentally, the maximum thaw depth of the active layer for each year occurred when the soil temperature at 15 cm reached its maximum at the 0°C isotherm.
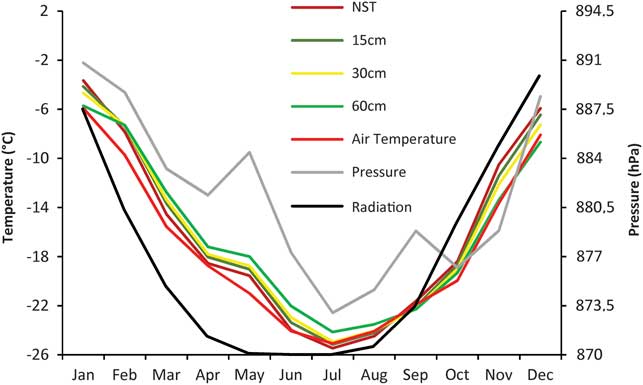
Mean monthly air temperature, ground temperature, pressure and radiation at Vesleskarvet (2010).
Relationships and correlations (in brackets) of winter and summer air temperature, radiation and pressure with ground thermal temperature in 2010.
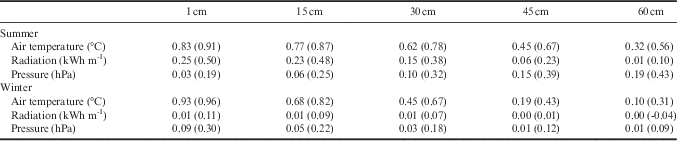
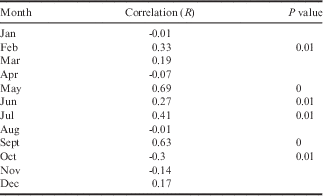
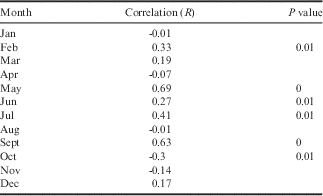
Compared to mean summer air temperature, the relationships of mean summer radiation and pressure with mean summer ground temperature was weaker (Table III). The highest correlation with radiation was found with NST (R=0.5) (Table III). Conversely, glm results revealed a highly statistically significant relationship (P=0) between radiation and ground temperature at 30 and 60 cm (Fig. 8). For 2010, NST was found to have a statistically significant correlation with pressure according to the glm results (P=0.001, Fig. 8). Although 60 cm depth appears to show the strongest correlation with pressure (Table III), this was not statistically significant. On closer inspection of the 2010 dataset, monthly analysis revealed a substantially higher correlation between NST and pressure during May (R=0.69) and September (R=0.63) in comparison to other months (Table IV). Subsequently, glm results revealed these correlations to be of high statistical significance (P=0) (Table IV).
Monthly correlations for pressure with near-surface temperature in 2010.
Mean winter air temperature and radiation
The relationships and correlation between ground thermal variables and mean winter air temperature (JJA 2010) at Vesleskarvet are marginally less strong and significant when compared to the summer trends (Table III). Radiation had a negligible relationship and significance with air temperature as the presence of sunlight is non-existent in winter in the Antarctic (Table III).
Discussion
Active layer depth
Whilst mean summer air temperature exhibited a comparable pattern to between-summer variability in active layer depth, large interseasonal variability was evident between differences in air and ground temperature. The disparity between mean summer air temperature and the ground thermal regimes can be attributed to variations in the timing and duration of snow cover (Zhang Reference Zhang2005, Guglielmin Reference Guglielmin2006, Guglielmin et al. Reference Guglielmin, Worland, Baio and Convey2014a).
The low SO associated with the summers of 2009/10 and 2010/11 could be attributed to the persistence of a thin snow layer, which leads to lower GST when compared to air temperature. The high surface albedo of the thin layer of snow leads to a negative radiative balance and loss of heat from the ground (Guglielmin Reference Guglielmin2004, Zhang Reference Zhang2005). Guglielmin (Reference Guglielmin2006) suggests that the presence of a thin snow layer facilitates ground surface values which are lower than or equal to the air temperature.
Conversely, the difference between ALT and air temperature during the 2011/12 summer could be due to the insulating properties of snow. The low thermal conductivity of snow could prevent the ground from changing temperature significantly in spring and summer (Zhang Reference Zhang2005). If snow cover persisted into the summer of 2012/13, an increase in the depth of the active layer is highly plausible as the frozen ground continues to thaw throughout the winter under the snow cover (Zhang Reference Zhang2005). According to Zhang (Reference Zhang2005), snow cover in regions experiencing seasonally frozen ground has the ability to increase the seasonal thawing depth. Guglielmin et al. (Reference Guglielmin, Fratte and Cannone2014b) attribute the insulating effect of snow cover as one of the main processes influencing the depth of the active layer in spring. Another factor that could have influenced the depth of the active layer in the summer of 2012/13 is snowmelt infiltration rapidly warming the active layer.
Vesleskarvet exhibits colder NST compared with air temperature on an annual basis, underpinned by a high nf and a negative SO. Although this suggests the absence of insulating snow cover, it could be due to the presence of blocky deposits at Vesleskarvet (Hansen et al. Reference Hansen, Meiklejohn, Nel, Loubser and van der Merwe2013). Similar landforms elsewhere have been shown to increase cooling in the ground as a result of blocks advecting cold air drainage (Harris & Pedersen Reference Harris and Pedersen1998, Ishikawa Reference Ishikawa2003, Marchenko & Etzelmüller Reference Marchenko and Etzelmüller2013). Moreover, the ameliorating properties of the overlying blockfield could be protecting the active layer from deepening in response to air temperature, leading to a shallower active layer depth. The cooler NST compared with air temperature may also be compounded by the combined effects of intermittent snow cover and the high emissivity of the blockfield which enhances radiative cooling.
Ground thermal regime
During the summer (DJF), the influence of air temperature and radiation have been shown to have a strong influence on the depth of the active layer and its thermal regimes (Guglielmin et al. Reference Guglielmin, Balks, Adlam and Baio2011, Reference Guglielmin, Worland and Cannone2012, Reference Guglielmin, Worland, Baio and Convey2014a, Guglielmin & Cannone Reference Guglielmin and Cannone2012). Guglielmin et al. (Reference Guglielmin, Balks, Adlam and Baio2011) noted a strong relationship between ground surface and air temperature at Wright Valley (R 2 =0.96) and Marble Point (R 2 =0.94) in southern Victoria Land. A similar relationship between GST and incoming radiation was illustrated by Guglielmin & Cannone (Reference Guglielmin and Cannone2012) in northern Victoria Land where a trend of active layer thickening (1 cm year-1) was identified. This study further substantiates the significant relationships of climate parameters, such as air temperature and radiation, with ground thermal regimes.
Notably, a relationship was measured between ground thermal regimes, particularly NST, and atmospheric pressure. The correlation between NST and pressure was found to be most significant during May and September. This is attributable to the circumpolar trough (CPT) which is most pronounced during intermediate seasons (May and September) when it is furthest south (King & Turner Reference King and Turner1997). During maximum contraction of the CPT in early winter and spring, low pressure areas migrate towards the continent bringing in a net transport of air which may account for the observed correlation between pressure and NST at these times (King & Turner Reference King and Turner1997, van den Broeke Reference Van den Broeke2000). Moreover, shifting westerlies, synchronous with the poleward migration of the CPT between June and September, result in the rapid advancement of sea ice (Bridgman & Oliver Reference Bridgman and Oliver2006). It would therefore seem that the Southern Annual Oscillation has a significant role to play in the relationship between pressure, Antarctic NST and the feedback mechanisms between sea ice extents.
The ground thermal regimes during the winter period at Vesleskarvet (JJA 2010) showed weaker connections with air temperature. Similarly, Zhang (Reference Zhang2005) found higher correlations between air and GST during snow-free periods and a weakened correlation during snow-covered periods, particularly in winter. This is indicative of an active layer depth that is more responsive to summer rather than winter air temperature.
Limitations of the study
The data recorded in this study provide a foundation for active layer studies in WDML, Antarctica, forming part of a growing database with valuable site description metadata. However, the short record of data (six years) prohibits long-term interpretation of trends. Further limitations are attributed to incomplete records as a result of equipment malfunction, particularly during winter 2013 as the ground temperature sensors were disturbed, giving inaccurate readings for air temperature and ground thermal regimes near the surface. Finally, no records of snow depth or precipitation exist for WDML, the lack of which limits a more in depth characterization of the active layer in this sparsely studied region.
Conclusions
The average active layer depth for five consecutive summers (2009/10–2013/14) at Vesleskarvet in WDML was measured at 16 cm. Interannual variability was expressed in both the timing and depth of maximum thaw of the active layer, which was facilitated by between-summer variability in mean summer air temperature and influenced by the presence of snow cover. Although the presence of snow is not conclusively identified in the analysis conducted, it was observed and is evidenced by the GMC. In summer, the presence of snow influences active layer depth and ground thermal regimes by increasing ground temperature, ground thawing depth and soil moisture content. Statistical analysis revealed that the active layer depth at Vesleskarvet is most affected by air temperature which had the highest correlation, followed by incoming radiation and then summer atmospheric pressure. The seasonality of each parameter was reflected by the depth in the active layer with which they exhibited the strongest correlation. A link between NST and atmospheric pressure was identified, with the most significant correlations observed in May and September. This has a considerable relevance to the semi-annual oscillation which experiences a transitional period during these times, at the same time underpinning a potential underlying relationship between pressure, sea ice extent and active layer dynamics in Continental Antarctica.
Acknowledgements
Funding by the National Research Foundation is gratefully acknowledged in the form of bursaries and project funding under the South African National Antarctic Program umbrella for the Geomorphology and Climate Change (1996–2011) and Landscape Processes in Antarctic Ecosystems (2012–14; Grant No: 93082) projects. The South African Department of Environmental Affairs is thanked for logistical support during the Antarctic fieldwork seasons. Thanks to SAWS for the provision of data, as well as to the members of the 2009/10, 2010/11, 2011/12, 2012/13 and 2013/14 summer relief voyage teams to SANAE IV that assisted in the fieldwork data collection processes. Prof Kevin Hall and Christel Hansen are gratefully thanked for their advice and field assistance, respectively. The external reviewers are also graciously acknowledged for their constructive feedback.
Author contribution
CK was the main author, responsible for data consolidation and interpretation of the findings, as well as drafting and editing of the manuscript prior to submission. IM was responsible for the conception, design and execution of the data collection. Moreover, he played a large role in the overall consolidation of the data, as well as assisting in article editing.