The first transcontinental is one of the largest railroads ever built in the United States and was the largest publicly funded work of the nineteenth century. The federal government, through the Pacific Railroad Act of 1862, provided a construction loan and land grants to two private companies, the Central Pacific and the Union Pacific, which built and operated the railroad. Was the Pacific Railroad Act necessary to induce private investment into building the first transcontinental? The purpose of this article is to analyze the ex-ante decision of private entrepreneurs and investors to build the transcontinental and examine the role of government in inducing private construction.
In 1869 the rails of the two companies joined and the completed railroad connected east and west, improving transport time and quality dramatically. In 1860 the same trip between New York and San Francisco that later took a passenger less than a week by rail, took about a month via Panama and at least three months via Cape Horn. The first transcontinental became a symbol of the nation's union after the Civil War, facilitated westward expansion, and generated high positive externalities.Footnote 1 On this evidence, government intervention to promote private construction through the Pacific Railroad Act looks like a great success.
However, the ex-post unaided private rate of return for each of the two railroad companies ranged from 8 to 13 percent and was higher than the opportunity cost (Fogel 1960, p. 97; Mercer 1982, pp. 75–84). Entrepreneurs could have undertaken the project with their own money. Moreover, the project was linked to one of the most visible corruption scandals of the nineteenth century. Entrepreneurs and politicians used construction companies like the Credit Mobilier to appropriate subsidies as profits (U.S. Congress 1872–1873; Hazard 1881; White 1895). Thus, there are also good reasons to doubt the need for and efficiency of the Pacific Railroad Act.
Most economic historians propose that entrepreneurs did not expect the railroad to be profitable; the railroad was “built ahead of demand” or “premature.” In this view, the Pacific Railroad Act was necessary to induce private investment, even if it was not efficient (Schumpeter 1939; Fogel 1960; Mercer 1982; Fishlow 2000).
The approach adopted here examines the ex-ante private investment decision by entrepreneurs and investors to develop an estimate of expected profits from the transcontinental circa 1862. The analysis reveals a different view of the construction of the first transcontinental.
First, instead of being premature or built ahead of demand because few farmers had settled along the route, the railroad was a response to transport demand. A key event was the 1859 Nevada mining boom, something overlooked in the existing literature. Up to that time little local traffic demand was expected. Prior to the Nevada boom, entrepreneurs planned to build a single-stage railroad from the Pacific Ocean to the Midwest, where it would connect to the eastern railroad network, to transport trade from California and China. Investment implied a large initial sunk cost and a wait of about ten years to complete the whole railroad, and only then would revenues start flowing. The 1859 mining boom in Nevada changed the nature of the investment decision dramatically. The single-stage project became two railroad projects, (1) from California to Nevada and (2) from the Midwest to Nevada. With two stages, entrepreneurs had only a five-year wait for completion of the first stage and the arrival of revenues associated with mining in Nevada. The first stage was expected to be highly profitable on its own. The California and China trade as well as traffic from mining booms in Colorado assured profitability of the second stage. The first transcontinental railroad was built following demand, just as much as eastern and Midwestern railroads were built following demand (Fishlow 1965; Harley 1980; Atack et al. 2010).
Second, government intervened, although high private profits were expected, because the project involved high political risk. Competition in Congress over the location of the route and appropriation of the gains of the project caused political conflict and deadlock. Slavery's conflict coincided with and reinforced the political conflict over the railroad. Secession reduced short-term conflict, facilitating the project's passage through Congress. Subsidies acted to ameliorate the negative long-term effects of political risk—not market failure—on private investment. Rather than the Pacific Railroad Act being inefficient or badly designed, it was one solution to the political conflict created by the railroad itself.Footnote 2
THE FIRST TRANSCONTINENTAL RAILROAD
During the second half of the 1840s and most of the 1850s, trade with the Pacific area boomed. China opened to trade and California experienced a gold rush and was annexed by the United States. Entrepreneurs and governments in different parts of the world competed to facilitate transportation to the Pacific Ocean. British, French, and Austrian entrepreneurs launched canal and rail projects in Canada, Central America, Egypt, and the Middle East. Meanwhile, American entrepreneurs developed clipper ships and a railroad across the Isthmus of Panama that became highly profitable businesses (Russel 1948, chaps. 3–6).
Responding to the booming transport demand, American entrepreneurs developed projects for a transcontinental railroad. The first was submitted to Congress in 1845 and proposed, like any plan for such a railroad, a route that crossed federal territories between the Mississippi River and the Pacific Ocean, and was obliged to request a right of way from Congress. Competition over the distribution of its costs and benefits generated intense political conflicts that blocked the passage in Congress of projects proposed by entrepreneurs.Footnote 3
In 1853 Congress, looking to solve the political deadlock with a technical solution, requested an engineering survey of six different routes by the Army Corps of Engineers (Corps) to determine the most cost efficient and economically convenient one. The results were published in 1855 and included information on technical standards, prices for alternative transport modes, a summary discussion of the findings, and detailed information on each route explored. The section on technical standards presented a study of several eastern railroads to identify benchmark measures of grades, curves, and total costs, including tunnels and bridges, for building the transcontinental railroad. The section on prices for alternative transport modes focused on the trade the railroad expected to divert and presented data on shipping freights to and from the eastern United States and to and from San Francisco, India, and China. Four routes were found to be practicable. The top choice was the route near the 32nd parallel from Fulton, Arkansas to San Pedro, California. Including the extension to San Francisco, this route was 2,039 miles long with a construction cost estimated at $93 million. The second choice was the route following the 41st and 42nd parallel from Council Bluffs, Iowa, to Benicia, California, which was 2,032 miles long at an estimated cost of $116 million. The first transcontinental railroad followed roughly this route. The main difficulty with this route was the descent on the western slope of the Sierra Nevada. Additional exploration revealed two alternative paths that promised to reduce the distance and difficulty of the descent. Entrepreneurs continued promoting the project but political deadlock prevented any bill from passing (Davis 1855, vol. 1. chaps. 1, 2; Bancroft Library (BL), Judah 1857).
In 1859 a gold rush was experienced in Washoe, Nevada. Reacting to the event, Theodore Judah, a California-based engineer-entrepreneur who had been promoting the first transcontinental for more than four years, found a practical pass over the Sierras connecting directly to the Washoe region. He convinced Sacramento merchants to invest $35,000 in surveying the route. Completed by summer 1861, this survey report divided construction of the first transcontinental into two stages, two sequential railroads. The first stage connected Sacramento and Washoe. The new route halved estimated construction cost, while transport demand was derived from the mining boom. The second stage linked Nevada and Omaha, Nebraska, following the Corps route on the 41st and 42nd parallels, with transport demand derived from the California and China's trade. Judah and the Sacramento merchants incorporated the Central Pacific Railroad Company of California on June 28, 1861. By 1861 Abraham Lincoln, who favored a transcontinental railroad, had been elected president, the southern states had seceded, and political conflict in Congress over the project had temporarily declined. Judah printed 1,000 copies of the survey report, distributed it to railroad men, and went to Congress to request the right of way and subsidies to build the road (BL, Judah 1860, 1861, 1862a, 1862b; Bain 1999, pp. 89–103).
The Pacific Railroad Act promoting construction of the first transcontinental railroad was passed on July 1, 1862. The act allocated the first stage of Judah's transcontinental railroad plan to the Central Pacific. It granted the right of way for the second stage to the Union Pacific, which was incorporated on October 29, 1863 as part of the act. Both companies would build the road and operate it under a long-term lease. The two companies’ rails met in Promontory Point, Utah on May 10, 1869 and completed the first transcontinental railroad. Construction of the first stage to Nevada cost $14.1 million, and the whole railroad cost $64.6 million (1860 dollars). With a loan of $37 million (1860 dollars) and 5.5 million acres granted to the railroad companies, it was the largest project supported by the federal government in the nineteenth century (GPO 1897, pp. 1–13; Mercer 1982, pp. 151, 164; Nimmo 1885, pp. 42–44).Footnote 4
HISTORIOGRAPHY
Were subsidies necessary to induce private entrepreneurs to build the first transcontinental railroad? The answer to this question requires answering two related questions. (1) Was the first transcontinental railroad expected to be profitable? (2) Was the Pacific Railroad Act necessary and efficient? Most economic historians suggest the railroad was not expected to be profitable. Joseph Schumpeter argues that the Central Pacific and the Union Pacific were “building ahead of demand … [profiting by] securing subsidies.” Lloyd Mercer argues that the railroad was built ahead of demand because it crossed the wilderness. It received subsidies because entrepreneurs and capital markets did not expect it to be profitable. Albert Fishlow supports Mercer's argument (Schumpeter 1939, p. 328; Mercer 1970, 1974, 1982, pp. 28, 67; Fishlow 1965, p. 204, 2000, p. 585). But this view is not warranted. It overlooks the existence of local transport demand derived from mining and the possibility that subsidies may be allocated as a result of rent-seeking or political risk.
Robert Fogel uses the railroad's company bond transactions to estimate expected return. He finds that investors failed to buy bonds in 1866 or earlier and infers low profit expectations; thus, the railroad was premature due to lack of transport demand.Footnote 5 But Fogel fails to consider that during the Civil War public expenditure expanded by eighteen-fold, crowding out private investment, and generating high inflation. The international capital market was also closed to American entrepreneurs. It is possible that entrepreneurs expected the railroad to be profitable but faced rationed investment markets due to the drastic distortions the Civil War caused on the capital market.
Mercer and Fogel argue that the act was necessary but inefficient. Mercer finds the subsidies to be excessive. Fogel argues that procurement would have been more efficient (Fogel 1960, pp. 75–86, 109; Mercer 1982, pp. 142–46).
EXPECTED PROFITS
Was the first transcontinental railroad expected to be profitable by 1862? I examine in detail the determinants of 1850s railroad investment decisions and derive an estimate of expected profits. I use contemporary engineering and entrepreneurs’ reports to identify investment determinants and estimate profits by (1) documenting the entrepreneur's stated profits and (2) deriving a simulation model based on the reports and information publicly available by 1862.
Entrepreneur Reports as Evidence of Profit Expectations
The profit expectations of the first transcontinental entrepreneurs and investors cannot be identified by inferences on the level of wilderness of a region, allocation of subsidies, or ex-post bond transactions. Entrepreneurs’ reports, composed of preliminary survey reports and stock and bond prospectuses, are an alternative source of evidence for profit expectations.
Preliminary survey reports usually contained an engineering survey and market research. The market research first identified the observed market equilibrium and then predicted the equilibrium expected once the railroad entered. Operation costs were estimated and operation profits deduced. Entry into the transport market was determined by the ratio of operation profits to construction costs. Entrepreneurs used these reports to communicate formally with investors. As the basis of stock and bond prospectuses, the reports thus contained the key public information used by investors to make purchase decisions.Footnote 6
The entrepreneurs’ reports may be used to identify profit expectations in three different ways. First, these reports include statements by the entrepreneurs explicitly indicating whether they expected the railroad to be profitable. Such statements are not generally to be taken at face value. In the case of the first transcontinental, entrepreneurs were motivated to overstate profit expectations to capital markets and to overstate social benefits and understate profits to Congress. Since it is not possible to infer the overall sign or magnitude of these effects, these statements are reported without additional informational value attached.
Second, performance and publication of a preliminary survey, or of its results in a stock or bond prospectus, are indications of expected profits. A preliminary survey was a sunk and expensive activity, costing at least $30,000 for a railroad such as the transcontinental, or more than twice the annual sales of the average 1850s American manufacturing establishment (BL, Judah 1857; Williams 1988, pp. 36–37; Davis 1855, p. 24; Census 1865). Like any R&D investment, performance and publication of a preliminary survey or a prospectus reflect profit expectations.
Third, the reports explain the method used in the 1850s to evaluate a railroad investment opportunity and produce a profit estimate. Examination of a sample of preliminary surveys, stock and bond prospectuses for other 1850s American and English railroads, and of American and English engineering textbooks reveals that the method used by the first transcontinental railroad entrepreneurs is identical to that of other successful railroad entrepreneurs of the 1850s.Footnote 7 The method may then be described as standard in the 1850s for investment appraisals by engineers, entrepreneurs, and investors alike. The intuition behind this method makes it possible to develop the structure of a simulation model that estimates expected profit. The parameters of the model are estimated with information publicly available before the subsidies were granted.
The model of expected profit outcomes uses only information available ex-ante for the investment decision and has two advantages. First, the model provides a counterfactual setting to examine the ex-ante private investment decision where incentives to build the railroad depend exclusively on operation profits. It abstracts “experimentally” from the investment decision the effects of corrupt schemes, insider's profits, subsidies, or capital market distortions. Second, the model allows for testing the sensitivity of the expected profit estimates to specific data or assumptions.
Used in this way, the entrepreneurs’ reports provide evidence on the profit expected by the average first transcontinental entrepreneur and investor. The main caveat of the estimate is that it does not use private information that may have been available to privileged investors at the time. This is not crucial when the purpose of the exercise is to determine whether an average entrepreneur or investor should have expected profit.
Profit Expectations as Stated by Entrepreneurs
Initially proposed as a single-stage project (1845–1859) by at least six different groups of entrepreneurs, the plans divided the project into two stages after the Nevada gold rush and Judah's survey of the new route. The first stage with an expected construction cost of $13.3 million was half the cost of the comparable Corps route. The price and traffic of wagon transport across the Sierra Nevada made the observed revenue $5.7 million per annum. Entrepreneurs promised to set the rail route's prices below the prices by wagon and estimated traffic and operation cost, and all predicted expected profit of $3.7 million per annum, or 27 percent of construction cost. Information in Judah's preliminary 1861 survey shows careful and detailed consideration of the first stage as an investment opportunity.Footnote 8
The preliminary survey also contained superficial information on the second stage. A detailed survey for the second stage was completed by the Central Pacific and the Union Pacific between 1862 and 1866, while the first stage was being built. Surveying improved the route and reduced the expected construction cost by 33–50 percent compared with the $86.7 million predicted by the Corps. The price and traffic of sailing ships and Panama steamers to and from China and California made observed revenue $31 million per annum. Entrepreneurs promised to set the rail route's price in between the total price along the routes for the sail ships and the Panama steamers, and they expected rapid traffic growth. After estimating the operation cost, the predicted expected operation profit was $27.6 million per annum, or 31 percent of the construction cost (BL, Judah 1861, 1862a; Union Pacific Railroad Museum (UPRM), Durant 1864; British Library Manuscript Collection (BLM), Dodge 1867; BL, Fisk and Hatch 1867; UPRM, Cisco 1868).
A Model of Formation of Profit Expectations
To formulate the structure of the simulation model, the 1850s method of investment decisions is recreated in preference to a more sophisticated modern approach. The emphasis here is on how entrepreneurs and investors gauged their profit expectations at the time.
The 1850s and modern approaches share the same intuition and the same structure. Construction costs are estimated with detailed engineering studies. Expected revenues are estimated by identifying the observed market equilibrium on the alternative transport mode, then assuming/deducing a pricing policy, a price elasticity of demand, and a growth rate of transport demand. Subsequently, the expected market size and share for the new railroad are estimated. Expected operation costs are estimated by adapting the costs of railroads already running to local geographical conditions. Finally, operation profits are deduced and compared to construction costs. Note the similarity between this approach and what is called a profit function in modern economics. Also note that the observed market equilibrium plays a key role anchoring the analysis firmly circa 1862. The changes to this equilibrium are relatively static; they involve movements along the same demand schedule. Construction of the railroad plays no role in inducing future migration, and therefore no feedback effect on future transport demand is incorporated.
However, the 1850s and the modern approaches also differ. First, the 1850s documents are not always explicit about the details underlying their analysis, such as the functional form of the demand function, discounting methods, or the calculation of the promised price. Second, simpler methods were used in the 1850s to estimate the values of the model parameters. In contrast, assumptions made to carry out this analysis are highlighted in this section.
The simulation model develops a scenario in which entrepreneurs motivated only by operation profit face the decision to enter the transport market. Two assumptions are necessary.
First, entrepreneurs may buy the right of way for a fixed fee L and without going to Congress. The assumption excludes from the analysis the perverse incentives that entrepreneurs faced when requesting the right of way from Congress. By assuming it is possible to buy the land for a fixed fee without going to Congress it is then possible to focus on operation profits, excluding rents from subsidies or corruption. The value for L is set at 1 percent of construction cost, based on western land prices and the share of land costs in construction cost for eastern railroads.
Second, entrepreneurs face an elastic capital supply at interest rate r. The assumption abstracts from the distortions the Civil War imposed on investment decisions circa 1862. The purpose is to consider if the project could have been profitable under “normal” capital market circumstances. The assumption also excludes the possibility that capital markets were more likely to fail in financing the transcontinental venture than in financing other railroads. The point is not to argue that the capital market of the 1850s did not fail but to highlight that, once the project was divided into two stages, each stage was not more uncertain or larger than earlier projects funded by the domestic and international capital markets.
The technical uncertainty of construction was within the range of uncertainty exhibited by existing railroads. Examination of the ex-ante and ex-post evidence on the construction process of the first transcontinental indicates that, contrary to what many believe, the railroad did not face unprecedented technical challenges. In 1855 the Corps stated that the route was practicable, entrepreneurs improved the Corps route in 1859–1862, and actual construction of the railroad shows that construction proceeded roughly as planned, as measured by cost, technical specifications and time. Crucially, no deviation from standard construction practices was expected, and the actual construction experience gives no indication that construction techniques were improved. The expected construction costs of each of the two stages of the first transcontinental were within the range of construction costs of other railroads and canals built in the 1850s and funded in the capital market. The best indication that the domestic and international capital markets were large enough to fund the transcontinental is that the transcontinental and the Suez Canal were actually financed almost exclusively with stock and debt issues (and no current taxes), while competing for funding with the Civil War and other European investment projects. The discount rate adopted for the simulation model (9 percent) is higher than the highest yield (7 percent) offered by infrastructure projects during the period to raise private capital through long-term debt.
The average 1850s entrepreneur or investor would have begun by identifying the railroad's expected construction cost based on the route chosen between origin location i and destination j. The expected total construction cost, C, is the sum of the right of way fixed fee, L, and the flow of construction cost, c, discounted at the discount rate r

The next step in the investment decision is to estimate expected revenues. Let N be the number of submarkets in which the railroad is expected to operate. Each submarket is defined by a pair of origin i and destination j locations. As the entrepreneur divided the project into two stages, he identified five submarkets. In the two submarkets of the first stage, the rail route competed with wagon roads across the Sierra Nevada. In the three submarkets of the second stage the rail route competed with sail ships around Cape Horn and ships to Panama, a transfer to the railroad across Panama, and a transfer to ships thereafter.
After the submarkets have been defined, the observed equilibrium on the alternative transport mode in a relevant submarket ij is identified as qij tons (or passengers) per annum and Pij dollars per ton (or passenger) trip. For instance, after performing a traffic survey, Judah estimated “the yearly average of freight [on the wagon road over the Sierra Nevada] to be 120 tons per day at an average price of six cents per pound” (BL, Judah 1862a, p. 51).
Next, the entrepreneur considered how entry of the rail route would have diverted existing transport demand in submarket ij and then predicted the expected price and traffic. In the first stage, Judah argued that “a reduction in [transport] price … and a saving in [transport] time … would give satisfaction to merchants and consumers, and secure every pound of Washoe freight over your road” and predicted the price, traffic, and receipts (BL, Judah 1862a, pp. 52–54). The rail route was expected to have a technological and cost advantage compared to wagon roads. The entrepreneur figured that the highest price he could charge would have been the sum of the observed price paid for the existing transport, Pij, and the non-transport trade costs saved by switching to the railroad, Bij. If he set an expected price,  lower than (Pij + Bij), the new railroad would capture 100 percent of the traffic. After setting expected price, the entrepreneurs then predicted expected traffic,

The preliminary survey reports and stock and bond prospectuses identify the observed and expected equilibrium but do not explain how the 1850s entrepreneurs calculated the expected price and traffic. Since the nature of the changes the entrepreneurs considered were generally movements along a fixed demand schedule as the price changed, presumably the observed and the expected quantity of traffic were on the same demand schedule. An expected demand function that gives all possible pairs of expected price and traffic is defined as

where parameter aij gives the sensitivity of expected traffic to expected price and hij is the demand intercept when the transport price is zero and reflects the economic size and other relevant origin-destination pair-specific effects on trade. The quantity demanded from the expected demand function must equal the observed traffic when evaluated at the observed price, hence

In the second stage, the rail route was expected to offer the China and California trades and passengers greater safety, a drier and more stable climate than routes that cross the tropics and “destroy all animal and vegetable products [and] injure all manufacturing goods,” and reductions in transport time (GK, Whitney 1849, pp. 17, 27, 36; GK, Degrand 1849, p. 11; McDougall 1854; UPRM, Cisco 1868, pp. 22–25). Goods were expected to arrive at their destination in better shape and goods not traded before, like fresh fruits, could now be shipped on the railroad. Preliminary survey reports and bond prospectuses indicate that the entrepreneur expected to set a price “half the cost of the steamship [Panama] route … and shortness of [transport] time decides … most cargoes will find their natural transit over [the transcontinental] railroad … excepting some very heavy or bulky articles of comparatively low values” (UPRM, Cisco 1868, pp. 23–24). That is, the entrepreneur expected to set the price between that of the Panama route (high) and sail around Cape Horn (low), diverting a substantial part of market share from sail and displacing the Panama route.Footnote 9

Following the intuition that changes introduced by the transcontinental route were of a static nature and therefore the observed and the expected equilibrium quantity are both on the same demand schedule, the expected demand function is defined as

The sensitivity of expected traffic to expected price is given by parameter bij. The origin-destination pair-specific trade effects are captured by uij, which is set to allow the expected demand function to equal the observed total traffic via the Cape Horn and the Panama routes when evaluated at the observed low price.
Once expected revenues have been calculated, expected operation costs are estimated. The entrepreneur used eastern railroads’ observed costs to derive the constant average cost per passenger or per ton transported, o, and the expected operation cost function  .Footnote 10
To select the optimal expected price (and implied traffic), it is assumed that the entrepreneurs chose the price maximizing operation profits. The Credit Mobilier scandal revealed that entrepreneurs were profit seekers and that they might have maximized personal profit. However, the relevant variable to determine whether investors should invest, and whether government should intervene, is the first transcontinental's total operation profit, η, defined as the sum of operation profits over all relevant submarkets for each stage. The average entrepreneur's assumed optimal expected operation profit in each submarket was identical for each period t of operation.
The entrepreneur would then compare expected total construction cost, C, with the flow of expected operation profits, η, and derived the entry condition given by η/C. In a more modern context, it is important to explicitly account for a discount rate, and the entry condition is given by

where T is the total lifetime of the project. For investors to decide to build the transcontinental, the sum of the discounted stream of total operation profits must be higher than the sum of the expected stream of construction costs.
Results
An estimate of the profit expectation of an average entrepreneur or investor is derived using the model in the previous subsection and the parameters introduced in this subsection. The model's parameters take as given the construction cost estimates in the engineering reports of the preliminary surveys and other information publicly available before 1862.
Decision to Build the First Stage
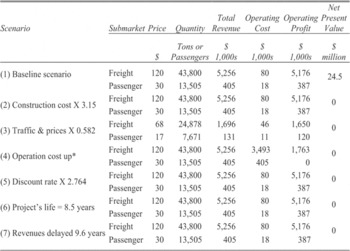
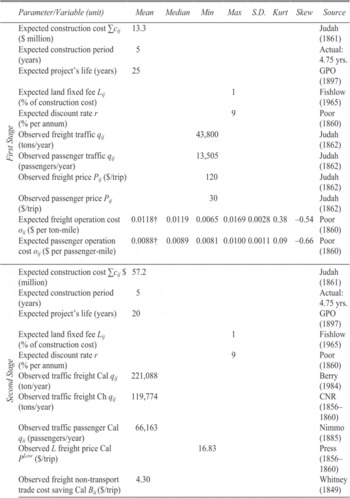
The expected construction cost for the first stage is $13.3 million, spread evenly over five years (all values are in 1860 dollars). The cost of purchasing the right-of-way is 1 percent of construction cost, $133,000, the discount rate is 9 percent, and the project lifetime is 25 years. Revenues from transportation start in the sixth year and continue until the project's life ends. The transportation market between Sacramento and Virginia Station, Nevada featured two submarkets: freight and passengers. The observed traffic and price by 1862 was 43,800 tons per year and $120 per ton per trip, and 13,505 passengers per year and $30 per passenger per trip, while the non-trade transport cost Bij is zero. The expected demand function non-price term is calibrated using the observed traffic and price. The average operation cost was $1.83 per ton per trip and $1.36 per passenger per trip. Recall that the first stage was expected to compete on prices below the price ceiling set by wagon roads. See sources and details on parameter values in the Data Appendix. The baseline scenario equilibrium is calculated for aij, implying a price elasticity of demand between 0 and −1. The profit-maximizing solution to the model is trivial. The entrepreneur should set a price for the transcontinental such that the expected price is just marginally lower than the observed price. Baseline freight profits should have been expected to be $5.2 million per annum and passenger profits $387,000 in line 1 of Table 1.
Once the baseline expected operation profit for the first stage is calculated, it is possible to compute the entry condition. The ratio of operation profits per annum to construction cost, the 1850s entry condition, is 39 percent, while the contemporary investment threshold was 15 percent. The expected net present value (NPV) of the project is $24.5 million. The average entrepreneur and investor should have expected the first stage of the first transcontinental to be profitable.
The robustness of the baseline scenario result is examined by calculating the maximum change to each single parameter required to make the expected NPV equal to 0. Actual construction cost was $14.1 million, implying a small cost overrun, but it could even treble and the project would still be profitable in line 2 of Table 1. The NPV of the project would have been positive even if the observed price and traffic declined rapidly and permanently by 40 percent, the discount rate almost trebled, the project's life shortened to less than half, or the revenues were delayed by almost a decade. The average entrepreneur or investor would have perceived the first stage of the first transcontinental to be profitable.
Decision to Build the Second Stage
The second stage of the transcontinental, from Virginia Station, Nevada, to Omaha, Nebraska (including a segment Sacramento-Oakland), completed the full route to the Pacific Ocean. Because the first stage was already operating profitably when the decision to build the second was to be taken, it was known that the technically more difficult first stage had been successfully built and at a lower construction cost than forecast by the Corps. Entrepreneurs had completed the surveys for the second stage and were now ready to build it.
BASELINE SCENARIO AND SENSITIVITY ANALYSIS – FIRST STAGE

* Operation cost of freight service X 43.6 and operation cost of passenger service X 21.9.
Notes:
Price and quantity are the profit maximizing choices. Lines 2, 3, 4, 5, 6, and 7 are results from changes in parameters calculated to make NPV = 0.
The second-stage project's life starts in year six of the project and ends in year twenty-five. The expected construction cost is $57.2 million, spread evenly over years six through ten. The right-of-way fixed fee and discount rate are the same as for the first stage. Three submarkets comprised the transport market: freight in both directions between California and the eastern United States (California trade), freight in both directions between China and the eastern United States (China trade), and passengers in both directions between California and the eastern United States (California passenger traffic). Revenues start flowing in year 11 and continue until the end of the project's life. Recall the second stage was expected to provide new good attributes and the price was to be set at a level between that of sail ship around Cape Horn and that of the Panama route.
Based on 1850s information, the total traffic in the California freight submarket was 221,088 tons per year with a high price of $140 per ton per trip and a low price of $16.83 per ton per trip. The values for the China freight submarket were 119,774, $140, and $17.49, respectively, and for the California passenger submarket the values were 66,153 passengers per year, $252.60 per passenger per trip, and $50 per passenger trip. The first transcontinental route also involved the eastern rail network between Omaha and the final destination in the eastern United States, at $20.50 per ton per trip and $14.96 per passenger per trip, while the China trade submarket included the Shanghai and California segment, at $6.83 per ton per trip. The expected operation cost is the same as for the first stage. See sources and details on parameter values in the Data Appendix.
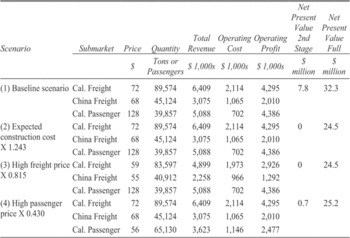
The baseline scenario results indicate that entrepreneurs and investors should have expected profits from all three submarkets in line 1 of Table 2. The profit-maximizing freight price would have been approximately $70 with traffic of 135,000 tons and the passenger price would have been $128 with 40,000 passengers per annum. Annual operation profit for the California trade would have been $4.3 million, $2 million for the China trade, and $4.4 million for the California passenger submarket. The project's NPV would have been $7.8 million. Expected total operation profit as a percentage of expected construction cost, the contemporary entry condition, is 18.6 percent, higher than the 1850s 15 percent threshold. The sum of the NPV for the first and second stages combined would have been $32.3 million. The average entrepreneur and investor should have expected the second stage and full first transcontinental to be profitable.
Note that the expected NPV of the second stage less the PV of the expected construction cost of the first stage gives a lower bound estimate of expected profits of the single stage project, as it was planned between 1845 and 1859. The average entrepreneur or investor should have expected $3 million in losses from the single-stage project. This implies that, as planned in the 1850s, a railroad with no revenues from local traffic should not have been expected to be profitable.
The robustness of the baseline scenario result is examined by calculating the maximum change to each single parameter required to make the expected NPV equal to 0. The NPV remains positive even if the expected construction cost of $57.2 million rose by 24.3 percent in line 2 of Table 2. Recall that the actual construction cost was only $50.5 million. The NPV is still positive even after the high freight price fell by 18 percent, or the high passenger price fell by 57 percent.
BASELINE SCENARIO AND SENSITIVITY ANALYSIS – SECOND STAGE

Sources:
Price and quantity are the profit-maximizing choices. Lines 2, 3, and 4 are results from changes in parameters calculated to make NPV = 0.
The results presented for the baseline scenario are based on conservative criteria. The profits would have been still higher than the baseline if the railroad could have practiced price discrimination, if there had been input substitution, if there were economies of scale and density, if new trade was created, or new sources of revenue from Colorado's gold rush in 1859 or the opening of the Japan trade were considered.Footnote 11
WHY SUBSIDIES?
The entrepreneurs stated that the railroad would be profitable and the simulation exercise supports this view. Why, then, did the federal government award subsidies?
The entrepreneurs bought votes to help pass the Pacific Railroad Act of 1862 through Congress and the act offered subsidies to the Central and the Union Pacific (Bain 1999, pp. 106–15; White 2011, p. 18). But capture is not sufficient to explain the events. The key issue is not whether entrepreneurs captured government and Congress, influencing decisions and reaping subsidies. Instead, the major issue to consider is why subsidies were not granted before 1860, when they were required to get the railroad built, but then were granted after 1860 when they were not necessary to influence private investment.
The explanation proposed here emphasizes that in the period 1859 to 1862 new sources of wealth appeared and the political economy of the project changed. The consequence was to unlock the political deadlock but also to reduce incentives for private investment.
The new source of wealth in 1859–1862 came from the mining booms in Nevada and in Colorado. The booms generated local traffic which made the railroad profitable. The railroad itself created two layers of political conflict. First, the railroad would generate higher growth for one region over others and would divert trade from other regions. If no credible political mechanism for equitable distribution of the gains delivered by the project could be found, the losing regions would oppose the railroad. The second layer was characterized by the conflict over slavery. A northern (southern) railroad would allow northern (southern) territories to grow faster and become states sooner. As these newly born states gained votes in Congress, it is likely they would have supported their region's stance on slavery. Thus, the railroad affected the delicate political balance of the antebellum Congress. The two layers of conflict led to deadlock in Congress. Congressional votes, contemporary sources, and secondary sources all confirm the conflict and deadlock (Govtrack.us; GK, Whitney 1849, p. 7; American Railroad Journal, July 21, 1855; BL, Judah 1857, pp. 5–7; Haney 1910, chap. 6; Russel 1948, chaps. 3, 7, 12, 14, 17, 18; Fogel 1960, p. 22; Klein 1987, p. 10; Bain 1999, p. 43).
The mining boom increased the venture's expected profitability while secession reduced political conflict over the choice of route. Realizing the unique opportunity, Judah performed the surveys and went to Washington to promote a bill for a two-stage transcontinental (BL, Judah 1860, 1861, 1862a, 1862b).
Incentives for private investment, however, also declined. First, the Civil War caused domestic capital market distortions, closed access to international capital, and turned property rights uncertain. These short-term effects could have justified either a transitory delay in building the railroad privately or temporary subsidies, such as a federal loan.
Second, the two layers of conflict generated long-term negative incentives for private investment. Even if an entrepreneur in 1862 was able to overcome the short-term capital market distortions introduced by the Civil War, the risk of changes in the future political equilibrium remained for a massive twenty-five year $65 million sunk investment. The likelihood of a change in the political equilibrium was significant, as there were about twelve different Congresses and six different presidents during the twenty five-year life of the project. Plus the railroad had long been a hotly contested issue. The consequences of such a change might have been considerable as Congress and government could have expropriated the railroad company's assets, regulated the railroad, or subsidized a potential competitor (that would not enter were it not for subsidies).
For a northern entrepreneur in 1862, when the outcome of the war was still uncertain, risk of future direct expropriation of assets by a southern dominated government was not insignificant. The risk of indirect expropriation of profits also existed. A clause in the act allowed Congress to regulate the railroad, and during the 1880s the first transcontinental ended up entangled in the events leading to the creation of the Interstate Commerce Commission in 1887 to regulate transcontinental rates. Subsidies to competing railroads were probably the entrepreneur's greatest fear. Federal subsidies had already been allocated to the Illinois Central and other antebellum railroads. Subsidies to unprofitable lines competing for through traffic with the first transcontinental were actually granted when right-of-way and land grants were awarded to the Northern Pacific in 1864, the Atlantic and Pacific in 1866, and the Texas and Pacific in 1871 (GPO 1897, p. 12; Haney 1910, pp. 115, 120, 123, 142, 288; Stover 1997, pp. 42, 82; Mercer 1982, pp. 84–115).
The northern interests acted to reduce exposure to changes in the political equilibrium. When the southern railroads received the right of way and land grants, the transcontinental was already being built with subsidies and the Union had secured the most northern route.
Finally, the long-term negative incentives for private investment also help explain corruption during construction of the transcontinental. The Credit Mobilier scandal exposed the substantially higher costs it charged to the Union Pacific, revealing the entrepreneurs’ aim to extract high profits out of the construction process, rather than waiting to profit from operation and be exposed to risks derived from changes in the political equilibrium (Fogel 1960, pp. 66–74; Stover 1997, pp. 70–71).
CONCLUSIONS
The first transcontinental railroad was built by two private firms with government subsidies. It is known that the unaided private rate of return of the two firms was actually higher than the opportunity cost rate of return. Both companies were profitable. The consequent question is whether entrepreneurs and investors expected the railroad to be profitable.
Contemporary sources reveal that entrepreneurs had been increasingly interested in the project to build a first transcontinental railroad since 1845. The key moment came when the entrepreneurs divided the plan to build the railroad in two stages after the 1859 Nevada gold rush. The first stage would profit from transporting the Nevada mining traffic, the second stage from transporting the California and China trades. Entrepreneurs also improved the route identified in 1855 by the Corps and reduced construction cost. The reports indicate entrepreneurs expected each stage to be profitable.
An estimate of private expected profit is produced by a simulation model that uses contemporary reports and public information and focuses on operation profit only. The estimate controls for the complex political economy of the project and crowding out of private investment related to the Civil War. The estimated expected profit confirms that dividing the transcontinental into two stages after the 1859 Nevada gold rush allows the two stages each to be expected to be profitable. The entrepreneur's stated profit and the estimated expected profit coincided. By the early 1860s entrepreneurs and investors expected the first transcontinental to be profitable. Thus, like most other American railroads, the first transcontinental was also built following demand.
The findings imply that the main question about government intervention should be: Why did the government allocate subsidies to the first transcontinental after 1860, when the project was already expected to be privately profitable, but did not offer subsidies before 1859 when intervention was more justified? Government and Congress intervened to ameliorate their own negative effects on the project's private investment. Before the Civil War, competition in Congress over the location of the route and appropriation of the benefits of the project caused political conflict and deadlock. Slavery's conflict coincided with and reinforced the political conflict over the railroad. Although, secession reduced the short-term conflict between North and South in Congress and thus facilitated the passage of the transcontinental project, the Civil War and the long-term political conflict remained. The tremendous demands for capital by the federal government during the Civil War crowded out private investments. And, if the political equilibrium changed, government and Congress could expropriate or regulate the first transcontinental or subsidize its competitors. The Pacific Railroad Act of 1862 and its subsidies were the result of efforts by north-central interests to reduce their exposure to the Civil War and the effects of long-term political risk on private investment—not government reduction of transport or capital market failure. Rather than the act being inefficient or badly designed, it was one solution to the political conflict created by the railroad itself.
Price Fishback and two anonymous referees provided comments that greatly improved the article. I am grateful to Nick Crafts, Tim Leunig, Henry Overman, and the LSE faculty for their encouragement throughout the project. Jeremy Atack, Cecile Aubert, Lori Beamon, Dan Bogard, Latika Chaudhary, Joe Ferrie, Joel Mokyr, and Andrew Odlyzko provided detailed and insightful comments on previous drafts. Carlos Brando, Hoyt Bleakley, Lou Cain, Charles Calomiris, Greg Clark, Stanley Engerman, Robert Fogel, Avner Greif, Dave Haddock, Tim Guinanne, Knick Harley, Naomi Lamoreaux, Sam Malone, Chris Meissner, Kris Mitchner, Chiaki Moriguchi, Larry Neal, Douglass North, Patrick O'Brien, Alan Olmstead, Nathan Rosenberg, Jean-Laurent Rosenthal, Felipe Tamega, Alan Taylor, Gavin Wright, and participants at meetings at the BHC, UofC-Booth, EHA, EHS, Harvard-HBS, ISNIE summer school, LSE, Northwestern, Stanford, UC-Davis, UCLA, and Yale provided helpful comments. The LSE, Acworth, and Newbery fellowships, the EHS and RHS travel funds provided financial support. John Bromley and Kyle Wyatt kindly guided me through the material at the Union Pacific Railroad Museum, the California State Railroad Museum, and other archives.
Appendix
PARAMETER VALUES AND DESCRIPTIVE STATISTICS