Introduction
Self-monitoring is a specific type of source monitoring (Johnson et al. Reference Johnson, Hashtroudi and Lindsay1993; Brebion et al. Reference Brebion, David, Ohlsen, Jones and Pilowsky2007; Versmissen et al. Reference Versmissen, Myin-Germeys, Janssen, Franck, Georgieff, a Campo, Mengelers, van Os and Krabbendam2007b) that enables the person to distinguish self-generated actions from those elicited by external stimuli (Frith, Reference Frith1987; Knoblich et al. Reference Knoblich, Stottmeister and Kircher2004). It has been proposed that the internal monitoring of speech generation and inner thoughts is analogous to the monitoring of motor actions (Frith, Reference Frith1987, Reference Frith1992, Reference Frith1996; Blakemore et al. Reference Blakemore, Smith, Steel, Johnstone and Frith2000; Seal et al. Reference Seal, Aleman and McGuire2004; Fu et al. Reference Fu, Vythelingum, Brammer, Williams, Amaro, Andrew, Yaguez, van Haren, Matsumoto and McGuire2006; Jones & Fernyhough, Reference Jones and Fernyhough2007). According to this model, ‘thinking’ is operationalized as an action with a clear intention, thus providing a sense of agency for thoughts (Frith, Reference Frith1992; Frith et al. Reference Frith, Rees and Friston1998, Reference Frith, Blakemore and Wolpert2000; Gallagher, Reference Gallagher2004). Misattributions of self-generated thoughts as voices coming from the outside could provide a plausible mechanism underlying the hallucinatory process in psychosis (Shergill et al. Reference Shergill, Bullmore, Simmons, Murray and McGuire2000). A deficit in the process of self-monitoring thoughts may therefore result in thought insertion and auditory hallucinations (Frith, Reference Frith1992; Brebion et al. Reference Brebion, Smith, Amador, Malaspina and Gorman1998, Reference Brebion, David, Jones and Pilowsky2005; Ditman & Kuperberg, Reference Ditman and Kuperberg2005). Several studies in patients with schizophrenia have indeed provided evidence that a deficit in self-monitoring of one's own cognitive actions is associated with psychotic symptoms e.g. (Harvey, Reference Harvey1985; Bentall et al. Reference Bentall, Baker and Havers1991; Daprati et al. Reference Daprati, Franck, Georgieff, Proust, Pacherie, Dalery and Jeannerod1997; Blakemore et al. Reference Blakemore, Smith, Steel, Johnstone and Frith2000; Keefe et al. Reference Keefe, Arnold, Bayen, McEvoy and Wilson2002; Brunelin et al. Reference Brunelin, Combris, Poulet, Kallel, D'Amato, Dalery and Saoud2006; Johns et al. Reference Johns, Gregg, Allen and McGuire2006; Costafreda et al. Reference Costafreda, Brebion, Allen, McGuire and Fu2008), although not all studies were able to find an association between psychotic symptoms and alterations in self-monitoring (Vinogradov et al. Reference Vinogradov, Willis-Shore, Poole, Marten, Ober and Shenaut1997; Fourneret et al. Reference Fourneret, Franck, Slachevsky and Jeannerod2001; Li et al. Reference Li, Chen, Yang, Chen and Tsay2002; Versmissen et al. Reference Versmissen, Janssen, Johns, McGuire, Drukker, a Campo, Myin-Germeys, van Os and Krabbendam2007a).
Importantly, studies suggesting that alterations in self-monitoring are associated with psychotic disorder were unable to consistently address the question of whether self-monitoring alterations are a vulnerability marker for psychotic disorder or merely a state marker of acute psychotic symptoms. Johns et al. (Reference Johns, Gregg, Allen and McGuire2006) found a self-monitoring deficit in patients currently experiencing hallucinations but not in patients who previously experienced hallucinations. Franck et al. (Reference Franck, Rouby, Daprati, Dalery, Marie-Cardine and Georgieff2000) found worse detection accuracy in patients experiencing hallucinations during the experiment compared to non-hallucinating patients. Several studies have used functional neuroimaging paradigms to detect abnormal regional activation in hallucination-prone patients when performing tasks engaging the verbal self-monitoring system, compared to non-hallucination prone patients with schizophrenia and healthy controls, focusing on various regions such as the Broca area, the anterior cingulate, the left temporal cortex and the supplementary motor area (SMA) (McGuire et al. Reference McGuire, Silbersweig, Wright, Murray, David, Frackowiak and Frith1995, Reference McGuire, Silbersweig, Wright, Murray, Frackowiak and Frith1996; Schnell et al. Reference Schnell, Heekeren, Daumann, Schnell, Schnitker, Moller-Hartmann and Gouzoulis-Mayfrank2008). These studies reported both under- and overactivation associated with self-monitoring alterations (Shergill et al. Reference Shergill, Bullmore, Simmons, Murray and McGuire2000; Schnell et al. Reference Schnell, Heekeren, Daumann, Schnell, Schnitker, Moller-Hartmann and Gouzoulis-Mayfrank2008; Raij et al. Reference Raij, Valkonen-Korhonen, Holi, Therman, Lehtonen and Hari2009), and these findings were hypothesized to result from a pathological increase in microstructural elements supporting excitatory neurotransmission, leading to instability (for a detailed discussion, see Bates et al. Reference Bates, Kiehl, Laurens and Liddle2002).
Some studies in healthy control subjects have found evidence suggesting that alterations in self-monitoring may be associated with vulnerability for psychosis rather than acute psychosis per se. For example, several studies have found that healthy individuals who experienced hallucinations displayed more reality or action-monitoring errors compared to normal subjects who had not experienced hallucinations (Bentall & Slade, Reference Bentall and Slade1985; Rankin & O'Carroll, Reference Rankin and O'Carroll1995; Laroi et al. Reference Laroi, Van der Linden and Marczewski2004; Debbané et al. Reference Debbané, Van der Linden, Gex-Fabry and Eliez2009). An additional argument that alterations in self-monitoring are not merely epiphenomena of acute psychosis is that some studies have also reported an inverse association between self-monitoring and negative symptoms (Brebion et al. Reference Brebion, Amador, Smith, Malaspina, Sharif and Gorman1999, Reference Brebion, Gorman, Amador, Malaspina and Sharif2002, Reference Brebion, David, Jones and Pilowsky2005). Negative symptoms are thought to be stable over time (Pfohl & Winokur, Reference Pfohl and Winokur1982; Pogue-Geile & Harrow, Reference Pogue-Geile and Harrow1985; Katsanis et al. Reference Katsanis, Iacono and Beiser1990; Keefe et al. Reference Keefe, Lobel, Mohs, Silverman, Harvey, Davidson, Losonczy and Davis1991; Rey et al. Reference Rey, Bailer, Brauer, Handel, Laubenstein and Stein1994; Dollfus & Petit, Reference Dollfus and Petit1995) and to index genetic liability to psychotic disorder better than positive symptoms (Tsuang et al. Reference Tsuang, Gilbertson and Faraone1991; Fanous et al. Reference Fanous, Gardner, Walsh and Kendler2001; Schurhoff et al. Reference Schurhoff, Szoke, Bellivier, Turcas, Villemur, Tignol, Rouillon and Leboyer2003).
Further evidence suggesting that self-monitoring alterations are associated with vulnerability for psychosis may be derived from studies investigating groups at risk for psychotic disorder such as first-degree relatives of patients with schizophrenia (Johns & van Os, Reference Johns, Rossell, Frith, Ahmad, Hemsley, Kuipers and McGuire2001; Hanssen et al. Reference Hanssen, Krabbendam, Vollema, Delespaul and van Os2006) or individuals with psychometric risk states. To our knowledge, only two studies have used this approach. Johns et al. (Reference Johns, Allen, Valli, Winton-Brown, Broome, Woolley, Tabraham, Day, Howes, Wykes and McGuire2009) found a significant difference in self-monitoring in persons with an at-risk mental state (ARMS) compared to healthy controls, and Versmissen et al. (Reference Versmissen, Myin-Germeys, Janssen, Franck, Georgieff, a Campo, Mengelers, van Os and Krabbendam2007b) found evidence for self-monitoring alterations in three psychometrically and genetically defined at-risk groups compared to controls.
Of note is that the use of verbal recognition or signal detection tasks, as applied in previous research (Bentall & Slade, Reference Bentall and Slade1985; Rankin & O'Carroll, Reference Rankin and O'Carroll1995; Morrison & Haddock, Reference Morrison and Haddock1997; Brebion et al. Reference Brebion, Smith, Amador, Malaspina and Gorman1998, Reference Brebion, Amador, David, Malaspina, Sharif and Gorman2000, Reference Brebion, David, Jones and Pilowsky2005; Ragland et al. Reference Ragland, Moelter, McGrath, Hill, Gur, Bilker, Siegel and Gur2003; Heinrichs & Vaz, Reference Heinrichs and Vaz2004; Johns et al. Reference Johns, Allen, Valli, Winton-Brown, Broome, Woolley, Tabraham, Day, Howes, Wykes and McGuire2009), may yield biased results because performance on these tasks is strongly associated with cognitive performance in general and could thus be influenced by characteristics such as verbal intelligence, time elapsed between acquisition and recognition, memory dysfunction and executive dysfunction (Johnson et al. Reference Johnson, Hashtroudi and Lindsay1993; Seal et al. Reference Seal, Crowe and Cheung1997). Therefore, in the present study we used an action-monitoring task, which may be less biased by cognitive performance, in patients with schizophrenia, their unaffected siblings and healthy controls. We hypothesized that: (1) patients with a non-affective psychotic disorder would show worse self-monitoring compared to healthy controls; (2) the unaffected siblings would show intermediate accuracy, supporting the notion of self-monitoring alterations as a vulnerability marker for psychosis; (3) self-monitoring accuracy would be inversely related to psychotic symptoms at the level of subclinical positive schizotypy in unaffected groups as well as at the level of psychotic symptoms in the patients; and (4) self-monitoring alterations would also be associated with negative symptoms in both patients and in non-affected groups.
Furthermore, it was hypothesized that patients do not automatically change their own movements to compensate for the action change by the computer compared to healthy controls or their first-degree relatives, as reported consistently in previous research (for an overview, see Jeannerod, Reference Jeannerod2009).
Method
Sample
The study sample consisted of 42 patients with a non-affective psychotic disorder according to DSM-IV-TR, 32 unaffected siblings of the patients and 49 control subjects. Written informed consent conforming to the local ethics committee guidelines was obtained from all subjects. Inclusion criteria were: fluency in Dutch; aged 16–55 years; and, for patients, first contact with mental health facilities within the past 10 years. For the controls, the occurrence of a psychotic disorder in either the control or a first-degree family member was considered an exclusion criterion.
Patients were recruited through the Community Mental Health Centres and the Psychiatric Hospitals of the catchment area (South Limburg, The Netherlands). All unaffected siblings were sampled through participating patients. Twenty-two families contributed one unaffected sibling and one patient, two families contributed two siblings and one patient, one family contributed two patients, seven unaffected siblings participated without their patient sibling and 16 patients participated without an unaffected sibling. Control subjects were recruited through random mailings in nearby municipalities and through advertisements.
The 42 patients had DSM-IV-TR diagnoses of schizophrenia (n=32), schizo-affective disorder (n=4), brief psychotic disorder (n=5) and psychotic disorder not otherwise specified (NOS) (n=1). Five siblings and five healthy controls had had one episode of major depressive disorder (MDD), in full remission at the time of testing, and two controls had had one episode of MDD, in partial remission at the time of testing. The remaining siblings and controls had no DSM-IV diagnosis.
Procedures
To study the hypothesis that symptoms are associated with problems in the central monitoring of action (Frith & Done, Reference Frith and Done1989), studies on error correction can be used to test the source-monitoring system. These studies test the central monitoring system because the error correction is too rapid to use exteroceptive feedback. In this study, an error correction task was used as described previously (Knoblich & Kircher, Reference Knoblich and Kircher2004; Knoblich et al. Reference Knoblich, Stottmeister and Kircher2004).
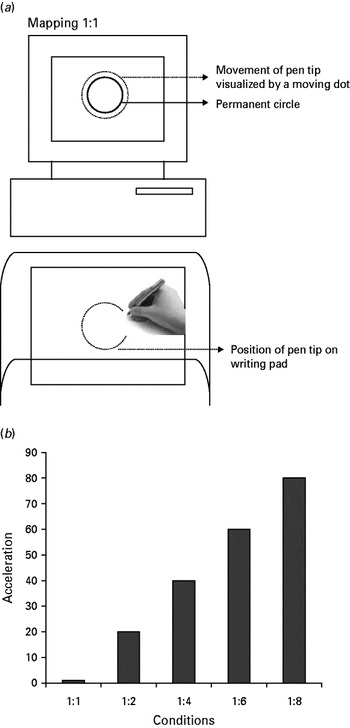
Seated in front of a computer screen, at a distance of about 60 cm, subjects were exposed to the image of a full circle (see Fig. 1 a). A covered writing pad was located between the subject and the computer screen. By covering the writing pad we could ensure that the subjects could not observe their own hand movements while they were drawing with a pen.
(a) Visual representation of the task. Each separate trial consisted of drawing five circles around the full, permanent circle that remained on the screen during the whole trial. Participants were instructed to interrupt the test by lifting their pen from the drawing map as soon as they noticed a difference between the actual movement they made on the drawing map and the representation they saw on the computer screen. (b) The different conditions used in the error correction task. In the interval between the sixth and the eighth second, the movement of the dot on the screen was accelerated relative to the movement of the pen tip on the drawing map by 20, 40, 60 or 80%.

The computer screen was an Apple Vision (Apple, USA) 17-inch monitor with a horizontal resolution of 800 pixels and a vertical resolution of 600 pixels. The vertical sync frequency was 75 Hz. The movement of the pen tip was recorded using a pressure-sensitive Wacom writing pad (Wacom Europe GmbH, Germany) with a sampling rate of 75 Hz, a horizontal resolution of 15 000 dots and a vertical resolution of 11 250 dots. An Apple Power PC controlled these devices. The sampling rate of the writing pad was synchronized with the screen refresh rate. Hence, the constant delay between the visual effect and the movement of the pen tip was about 13 ms.
The experiment was made up of four tasks, which were presented in the following order.
Tracking task
The objective of the first task (20 trials) was to assess the subject's tracking performance. In each trial the subject tracked a circular target, which moved with constant velocity, using the pen and the writing pad. The location of the pen tip was indicated by a solid circular dot. Neither the circular target nor the dot left a trace on the screen. In this task the mapping between the computer screen and the writing pad was 1:1, that is a similarity of 100% between the drawing made by the subject and the visual consequence shown on the computer screen. In each trial the circular target completed five circles around the full, permanent circle, which remained on the screen during the whole trial, with a velocity of 2 s per circle and an eccentricity of 9° visually for the full circle. Crossing the 12 o'clock position of the target was indicated by a short beep (200 ms, 1000 Hz).
Training task
In this task 10 trials with mapping changes (from 1:1 to 1:2) were introduced to the subjects, similar to the main experiment.
Colour change detection task
In this condition we could assess whether there were difficulties lifting the pen during a movement. Therefore, the subject had to lift the pen as rapidly as possible when the solid circular dot changed colour. This colour change occurred while in the fourth circle.
Main experiment
Each trial (120 in total) of the experiment started by successfully crossing a small quadratic box, located above the 12 o'clock position of the circle, accompanied by a short beep. Each separate trial was composed of drawing five circles around the full, permanent circle that remained on the screen during the whole trial. Whenever the dot that represented the pen tip passed the 12 o'clock point (after 2, 4, 6, 8 and 10 s), the same beep was heard.
Participants were instructed to interrupt the test by lifting their pen from the drawing map as soon as they noticed a difference between the actual movement they made on the drawing map and the representation they saw on the computer screen. A trial could come to an end by the lifting of the pen or automatically after 11 s if no pen lift occurred.
The position of the pen tip's coordinates were recorded at the time of each beep to determine to what extent the mapping change was compensated for in the movement. This position reflects the distance between the centre of the drawn circle and the pen position on the writing pad. Therefore, the position of the pen tip at each beep represents the radius of the circle the subject was ending at the time of the beep.
Five different conditions (20% of the trials each) were possible (see Fig. 1 b). The first 6 s, the mapping between the writing pad and the screen was 1:1. In the interval between the sixth and the eighth second, the movement of the dot on the screen was accelerated relative to the movement of the pen tip on the drawing map by 20, 40, 60 or 80%. In 20% of the trials, no acceleration occurred.
Instruments
For all participating patients, the Operational Criteria Checklist for Psychotic Illness (OCCPI; McGuffin et al. Reference McGuffin, Farmer and Harvey1991) was completed, based on case-note material, and also the Positive and Negative Syndrome Scale (PANSS) interview (Kay et al. Reference Kay, Fiszbein and Opler1987). Where necessary, additional information was derived from ward staff or case managers. Using the information in the OCCPI, the computerized program OPCRIT (McGuffin et al. Reference McGuffin, Farmer and Harvey1991) yielded DSM-IV diagnoses.
The Structured Interview for Schizotypy – Revised (SIS-R) was used to measure the positive, negative and disorganization dimensions of the subclinical psychosis or ‘schizotypy’ phenotype (Vollema & Ormel, Reference Vollema and Ormel2000; Pfeifer et al. Reference Pfeifer, van Os, Hanssen, Delespaul and Krabbendam2009). Items are scored on a four-point scale ranging from absent (score 0) to severe (score 3). Positive schizotypy covers the items referential thinking, magical ideation, illusions and suspiciousness. Negative schizotypy contains the items social isolation, social anxiety, introversion, restricted affect, referential thinking and suspiciousness. Disorganization schizotypy encompasses the items goal directness of thinking, loosening of associations, and oddness.
Finally, two verbal subtests, Information and Arithmetic, and two performance subtests, Block Design and Symbol Search, of the Wechsler Adult Intelligence Scale III (WAIS-III; Wechsler, Reference Wechsler1997) were used to obtain a measure of intelligence quotient (IQ; Blyler et al. Reference Blyler, Gold, Iannone and Buchanan2000).
Analysis
Associations between psychosis risk and self-monitoring ability
A three-level ordinal group variable was constructed reflecting the risk for psychosis, with a value of 2 for patients, 1 for relatives and 0 for controls. The number of correct pen lifts in the five conditions, representing a certain extent of mapping change (hereafter ‘detection accuracy’), were saved as average values over all trials for each subject. Pen lifts in the baseline conditions are errors in self-monitoring (no transformation occurs), whereas pen lifts in the other conditions are indicative of adequate self-monitoring. Therefore, to create a measure of the individual's overall detection accuracy, four observations were created for each subject, reflecting the four velocity transformation conditions where transformation occurred (1:2, 1:4, 1:6, 1:8). To account for hierarchical clustering of detection accuracies across different conditions (1:2, 1:4, 1:6, 1:8), nested in individual participants, between-group differences in the pattern of detection accuracy were modelled using multilevel linear regression analysis using the XTREG routine in STATA version 11.0 (StataCorp, 2008), with detection accuracy as the dependent variable and ‘group’ and ‘condition’, and also their interaction term, as the independent variables. This analysis investigates the increase in detection accuracy with increasing acceleration (i.e. over the different conditions), as indicated by the ‘group×condition interaction’. This approach allows for the combined analysis of all self-monitoring data, which is a better solution than analysing the conditions separately. Age, sex and IQ were included as possible a priori confounders. To determine whether differences between individual groups were statistically significant, post-hoc Wald tests based on the group×condition interaction model were used. Effect sizes were obtained by examining the appropriate linear combinations using the lincom routine.
Associations between psychotic symptoms and self-monitoring ability
To examine the hypothesis that higher levels of positive and negative symptoms are associated with worse action-monitoring in patients, multilevel linear regression analysis was applied, with detection accuracy as the dependent variable and psychotic symptoms, condition and their interaction term as independent variables. A similar analysis was conducted with SIS-R subclinical symptoms in controls and unaffected siblings. For this analysis, the controls and the unaffected siblings were combined to increase the sample size and variability, resulting in greater statistical power.
Given the known overlap between positive and negative symptoms, the multilevel regression analysis investigating the association between positive symptoms and self-monitoring was controlled for the presence of negative symptoms, as in a previous study (Brebion et al. Reference Brebion, Amador, Smith, Malaspina, Sharif and Gorman1999), and vice versa. In addition, age, sex and IQ were included as possible a priori confounders. The role of antipsychotic use was also considered as potentially relevant because antipsychotics exert a direct effect on symptomatology and it may be that they also influence the ability to monitor one's motor actions given the effects on nigrostriatal dopaminergic neurotransmission. Therefore, the analysis in patients was additionally controlled for use of antipsychotic medication (yes/no) and subanalyses also investigated the association between detection accuracy and symptomatology in patients stratified for current use of antipsychotic medication. Two-way interactions between condition and symptoms stratified for antipsychotic use were derived from the three-way condition×symptoms×antipsychotic use interaction model.
Compensation of mapping change
The radial components, reflecting the radius of the pen tip at the time of each beep, were transcribed for each beep (five beeps per trial), with separate values for the various mapping change conditions. Because the velocity transformation occurred after radius 3, the compensation movement per velocity transformation was calculated by subtracting the mean radial component before the velocity transformation from the mean radial component after the velocity transformation. Similar to the detection accuracy, the mean compensation movements per velocity transformation per subject were reshaped into five observations per subject based on the latter five velocity transformation conditions. Between-group differences were assessed, with ‘mean compensation’ as the dependent variable and ‘group’ and ‘condition’ and also their interaction term as the independent variables.
Results
Sample characteristics
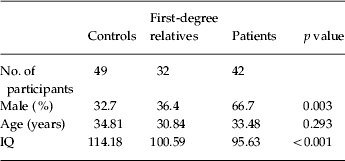
The error-correction task was carried out by 124 subjects: 42 patients with psychosis, 32 siblings and 49 healthy controls. Significant between-group differences were found for intelligence and sex (see Table 1). Twenty-nine patients with psychosis were currently using antipsychotic medication, 10 patients were not, and no information on antipsychotic use was available for three patients. There were no large or significant differences between patients with or without current antipsychotic treatment in positive (t=−0.28, p=0.778) or negative symptoms (t=−0.90, p=0.374).
Demographics

Self-monitoring ability and psychosis
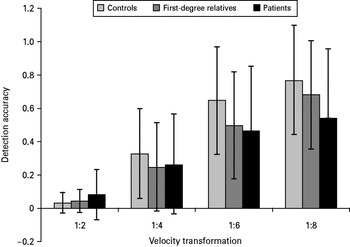
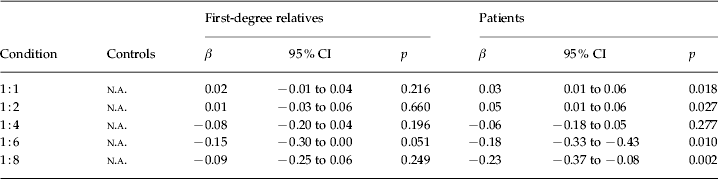
The detection accuracy increased significantly in all groups as the transformations became larger (p<0.001 for all). Performance on the action-monitoring task was modestly associated with IQ in the patient group (β=0.02, s.e.=0.01, p=0.033) but not in the siblings (β=0.004, s.e.=0.01, p=0.61) or healthy controls (β=0.01, s.e.=0.01, p=0.14). Significant differences between groups were found in detection accuracy over the different conditions when covarying for age, sex and IQ [group×condition interaction χ2(2)=29.3, p<0.0001], as depicted in Fig. 2 and Table 2. Patients showed the worst detection accuracy (β=0.41, s.e.=0.04), controls had the best (β=0.68, s.e.=0.03) and the siblings performed at a level that was intermediate between the other groups (β=0.56, s.e.=0.04). Differences between controls and patients were statistically significant [χ2(1)=29.8, p<0.0001], as were differences between controls and siblings [(χ2(1)=5.8, p=0.016] and patients and siblings [χ2(1)=7.0, p=0.008]. Because psychomotor slowing, as measured by the Symbol-Digit Substitution task, was observed in both patients (β=−18.0, s.e.=1.57, p<0.01) and unaffected siblings compared to the controls (β=−4.26, s.e.=1.69, p=0.012), a sensitivity analysis investigated action monitoring while covarying for psychomotor performance (in addition to the a priori confounders age, sex and IQ). This did not alter the results, indicating that the observed associations are not due to psychomotor slowing in the siblings and patients. Patients did not perceive changes significantly more often than their unaffected siblings or the controls in the 1:1 condition in which there was no acceleration (siblings: β=0.02, s.e.=0.02, p=0.30; controls: β=0.02, s.e.=0.02, p=0.13).
Patterns of detection accuracy in different conditions across groups.

Differences in self-monitoring in the five conditions between the genetic risk groups

CI, Confidence interval; n.a., not applicable.
Self-monitoring ability and symptoms (Fig. 3)
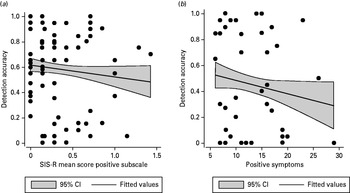
In the non-patient groups (i.e. the combined group of healthy controls and the unaffected siblings), detection accuracy over the different conditions was associated with positive schizotypy as measured by the SIS-R (β=−0.16, s.e.=0.07, p=0.026). This was not the case for negative schizotypy (β=−0.05, s.e.=0.12, p=0.694).
Scatter plots of the detection–symptoms relationship in the most discriminative condition (1:6, see Table 2) in (a) unaffected participants and (b) patients with psychotic disorder. SIS-R, Structured Interview for Schizotypy – Revised; CI, confidence interval.

In patients, the level of positive psychotic symptomatology was not robustly associated with detection accuracy over the different conditions (β=−0.01, s.e.=0.01, p=0.094). Although the overall three-way condition×symptoms×antipsychotic use interaction was not statistically significant [interaction χ2(1)=1.4, p=0.232], probably because of limited power, further stratification revealed a borderline significant association in patients not using antipsychotic medication (β=−0.03, s.e.=0.01, p=0.052), whereas no association was apparent in patients on antipsychotic medication (β=−0.01, s.e.=0.01, p=0.407). A similar pattern of associations was found for negative symptoms. There was a suggestion of an association between negative symptoms and detection accuracy (β=−0.01, s.e.=0.01, p=0.064), which was much larger in patients not using antipsychotic medication (β=−0.04, s.e.=0.02, p=0.052), and which was absent in patients on antipsychotic treatment (β=−0.01, s.e.=0.01, p=0.167), whereas the overall three-way interaction was non-significant [interaction χ2(1)=2.2, p=0.135]. Covarying for indicators of severity of illness, that is the number of psychotic episodes and age at first onset, did not alter the results (data not shown).
Compensation for mapping change
The distance of the compensation movements increased with the acceleration in all three groups. Multilevel regression analysis revealed no significant differences in compensation among groups over all mapping changes [group×condition interaction: χ2(2)=1.66, p=0.44].
Discussion
This study assessed the relationship between self-monitoring in healthy controls, patients with psychosis and their unaffected siblings using an action-monitoring task. Several findings emerged. Detection accuracy increased if the mapping change was more obvious in all three groups, but this pattern was more pronounced in the healthy controls than in the patients. Detection accuracy of the unaffected siblings was at an intermediate level between patients and controls. In addition, associations between detection accuracy and symptoms were found. In the combined unaffected groups, an association between detection accuracy and positive schizotypy, but not negative schizotypy, was shown. In patients, associations between detection accuracy and symptoms were less convincing, although there was suggestive evidence that this association may only be detectable in patients off antipsychotic medication.
The finding that self-monitoring in patients with psychosis was significantly worse than in healthy controls is in line with a large body of work (McGuire et al. Reference McGuire, Silbersweig, Wright, Murray, David, Frackowiak and Frith1995; Rankin & O'Carroll, Reference Rankin and O'Carroll1995; Stirling et al. Reference Stirling, Hellewell and Quraishi1998, Reference Stirling, Hellewell and Ndlovu2001; Keefe et al. Reference Keefe, Arnold, Bayen and Harvey1999, Reference Keefe, Arnold, Bayen, McEvoy and Wilson2002; Bocker et al. Reference Bocker, Hijman, Kahn and De Haan2000; Frith et al. Reference Frith, Blakemore and Wolpert2000; Franck et al. Reference Franck, Farrer, Georgieff, Marie-Cardine, Dalery, d'Amato and Jeannerod2001; Ditman & Kuperberg, Reference Ditman and Kuperberg2005; Woodward et al. Reference Woodward, Menon and Whitman2007). The finding that unaffected siblings also show worse self-monitoring than healthy controls, but better than their affected brother or sister, is in agreement with two studies that have assessed self-monitoring in groups at increased risk for psychotic disorder (Versmissen et al. Reference Versmissen, Myin-Germeys, Janssen, Franck, Georgieff, a Campo, Mengelers, van Os and Krabbendam2007b; Johns et al. Reference Johns, Allen, Valli, Winton-Brown, Broome, Woolley, Tabraham, Day, Howes, Wykes and McGuire2009). Johns et al. (Reference Johns, Allen, Valli, Winton-Brown, Broome, Woolley, Tabraham, Day, Howes, Wykes and McGuire2009) found a significant difference in self-monitoring in persons with an ARMS compared to healthy controls whereas Versmissen et al. (Reference Versmissen, Myin-Germeys, Janssen, Franck, Georgieff, a Campo, Mengelers, van Os and Krabbendam2007b) found evidence for self-monitoring alterations in three psychometrically and genetically defined at-risk groups, in a comparison with well controls. These findings may thus suggest that self-monitoring alterations are not merely epiphenomena of acute psychosis in patients. The hypothesis that alterations in the process of the monitoring of one's motor actions may have relevance for the aetiology of psychotic disorder carries the implicit assumption that action-monitoring alterations are associated with psychological processes relevant for the development of psychotic symptoms. Following this reasoning, a global rather than a modality-specific self-monitoring deficit (i.e. limited to the monitoring of one's motor actions) is most likely to increase the risk for psychotic disorder. Future work should address this hypothesis empirically.
In addition, the finding that self-monitoring may be associated with positive symptoms at the level of the disorder and also at the level of subclinical expression suggests that alterations in self-monitoring may have aetiological relevance, as suggested by previous experimental and neuroimaging studies (see Allen et al. Reference Allen, Aleman and McGuire2007 for an overview). Nevertheless, the present results do not entirely support previous claims of alterations in self-monitoring as a so-called ‘endophenotype’ or ‘intermediate phenotype’ for psychosis (Versmissen et al. Reference Versmissen, Myin-Germeys, Janssen, Franck, Georgieff, a Campo, Mengelers, van Os and Krabbendam2007b), given the possible moderating role of antipsychotic use in the association between self-monitoring and expression of psychosis, which is not in agreement with the notion that endophenotypes are characterized by stability over time and independence of phase of the illness and treatment (Gottesman & Gould, Reference Gottesman and Gould2003). However, the three-way condition×symptoms×antipsychotic use interaction was not significant, because of limited power, indicating that any suggestion of moderation by antipsychotics should be interpreted with caution. If replicated, however, it may be one reason for the non-replication of the association between symptoms and self-monitoring in several previous studies (Vinogradov et al. Reference Vinogradov, Willis-Shore, Poole, Marten, Ober and Shenaut1997; King, Reference King1998; Fourneret et al. Reference Fourneret, Franck, Slachevsky and Jeannerod2001; Li et al. Reference Li, Chen, Yang, Chen and Tsay2002; Moller, Reference Moller2003; Erhart et al. Reference Erhart, Marder and Carpenter2006; Versmissen et al. Reference Versmissen, Janssen, Johns, McGuire, Drukker, a Campo, Myin-Germeys, van Os and Krabbendam2007a). A similar pattern of results was found for negative symptoms in patients, but this association was not found in the unaffected groups, suggesting that the association with psychotic symptoms may be primary, especially given the known overlap between positive and negative symptoms in patients, which is difficult to account for statistically (Kay, Reference Kay1990).
Although the detection accuracy of non-self-generated actions was impaired among patients with psychotic disorder and their unaffected siblings, the groups were not impaired in their ability to automatically compensate for the mismatch between self-generated action and their consequences. This was expected and is in accordance with previous work (Kircher & Leube, Reference Kircher and Leube2003; Knoblich et al. Reference Knoblich, Stottmeister and Kircher2004). This finding confirms the literature showing that automatic processes are usually left intact in patients with psychotic disorder, even though conscious cognitive processes are known to be affected (see Jeannerod, Reference Jeannerod1999 for an overview).
Previous work has claimed that impaired verbal memory, guessing biases or generalized cognitive impairment, rather than alterations in self-monitoring per se, may underlie the observation of worse self-monitoring performance in psychosis (Keefe et al. Reference Keefe, Arnold, Bayen, McEvoy and Wilson2002). In addition, the use of signal detection tasks using detection of distorted feedback of the patients' speech, which has been applied in previous research (Johns & McGuire, Reference Johns and McGuire1999; Johns et al. Reference Johns, Rossell, Frith, Ahmad, Hemsley, Kuipers and McGuire2001; Fu et al. Reference Fu, Vythelingum, Brammer, Williams, Amaro, Andrew, Yaguez, van Haren, Matsumoto and McGuire2006), has also been criticized because these tasks may pick up problems with the appraisal of distorted stimuli instead of problems related to the self-monitoring of the intention to generate (verbal) material (Levelt, Reference Levelt1983). This is supported by the observation of patients with auditory verbal hallucinations and also non-clinical subjects making misattributions of their own voice while passively hearing recorded tapes (Allen et al. Reference Allen, Johns, Fu, Broome, Vythelingum and McGuire2004, Reference Allen, Freeman, Johns and McGuire2006). An action-monitoring task, as applied in the present study, is less prone to these possible sources of bias, which is a strength of the study, as is the use of a genetic at-risk group (the unaffected siblings). An important limitation of the study is the small number of patients with psychosis who were not on current antipsychotic treatment. A further limitation is the significant difference in IQ between the three groups tested. Although differences in IQ were present, it is unlikely that this explains the present results because we controlled statistically for IQ a priori, and IQ was only moderately associated with self-monitoring accuracy in the patients but not in the controls or unaffected siblings. To a degree, cognitive alterations such as attention deficits or psychomotor slowing present in families affected with psychotic disorder could explain the observed between-group differences in self-monitoring. Although we did not observe this effect with regard to psychomotor slowing, attention was not specifically assessed in this sample. In addition, environmental factors that are associated with both psychotic disorder and attention deficits, such as cannabis use, could be a source of unmeasured confounding.
Acknowledgements
This work received funding from the European Community's Seventh Framework Programme under grant agreement HEALTH-F2-2009-241909 (Project EU-GEI).
Declaration of Interest
None.