I. INTRODUCTION
Titanium dioxide (TiO2) is a wide band gap semiconductor with energy of 3.0–3.2 eV. It is widely used in applications such as hydrogen production, gas sensors, photocatalytic activities, dye-sensitized solar cells, and photoelectrochemical cells because of its relative high efficiency and high stability.Reference Hanaor and Sorrell1 However, due to its wide band gap energy, TiO2 is active only under near-ultraviolet irradiation. Therefore, numerous studies have been carried out over the last 20 years to develop modified TiO2 catalysts so that they are active under visible light irradiation (>400 nm). One of the most studied methods is by doping the TiO2 materials with metal ions (Fe, Ni, Co, and Va)Reference Anpo, Ichihashi, Takeuchi and Yamashita2–Reference Hamal and Klabunde5 or nonmetallic elements (N, S, and C).Reference Virkutyte, Baruwati and Varma6–Reference Bai, Im, Kim and Lee15 For instance, N-doping of TiO2 can result in visible light response by virtue of a narrowing in the band gap due to the mixing of p states of nitrogen with O 2p states. Among these doping methods, doping with transitional metals is one of the most efficient methods. Recent theoretical calculations showed that 3d transition metals such as Mn have good potential as a substitutional dopant for TiO2 because of their ability to induce significant spin polarization and reduce the energy gap of rutile by forming intermediate bands with adequate curvatures and density of states.Reference Shao16–Reference Xia, Lu, Walton, Ward, Han, Brydson, Luo and Shao18 Unlike defect states in the form of nearly straight horizontal lines within the energy gap, these curvy intermediate bands can act as stepping-stones to relay valence electrons to the conduction band.Reference Shao16, Reference Shao17 As a result, the optical absorption edge of TiO2 is shifted into the visible or even infrared spectral range of solar irradiance.Reference Xia, Lu, Walton, Ward, Han, Brydson, Luo and Shao18
Using a simple electrochemical anodization technique, highly ordered arrays of doped TiO2 nanotubes with enhanced photocatalytic properties can be grown on a thin sheet of titanium.Reference Roy, Berger and Schmuki19 X-ray photoelectron spectroscopy (XPS) results showed that the doped nanotube samples contained N, C, B, and F elements and the doped TiO2 showed the shift in the band gap transition down to 2.98 eV. The photocatalytic activity of doped TiO2 was 1.61 times better than undoped TiO2.Reference Bai, Im, Kim and Lee15 Metals compounded on semiconductor materials increase charge collection efficiency due to a much slower electron–hole recombination, giving rise to longer electron lifetime, which will result in an increasing interfacial electron transfer process.Reference Hanaor and Sorrell1, Reference Asahi, Morikawa and Ohwaki12
Hitherto, the doping of TiO2 has been widely synthesized using the sol–gel method.Reference Kuroda, Mori, Yagi, Makihata, Kawahara, Nagao and Kittaka20–Reference Tseng, Kuo, Huang, Li, Chou, Cheng and Wong24 However, ion implantation has now emerged as an alternative but effective doping method to improve the separation of the photogenerated electron–hole pairs or to extend the wave length range of the TiO2 photoresponses into the visible region.Reference Yamaki, Sumita and Yamamoto25–Reference Yamashita, Harada, Misaka, Takeushi and Anpo30 XPS measurements revealed that the implanted nitrogen species were mainly interstitial ones. The nitrogen concentration was increased with increasing the flux of ions, which could be controlled by adjusting the gas flow rate of the ion source, resulting in improved visible light photocatalytic activities.Reference Shen, Mi, Xu, Shen and Wang26 Higher visible light photocatalytic efficiency was achieved with higher implanted nitrogen concentration.Reference Shen, Mi, Xu, Shen and Wang26, Reference Park, Lee and Cho27
In this paper, we present x-ray diffraction (XRD) results on the role of Cr-doping on the in situ crystallization behavior and phase stability of TiO2 nanotubes in the temperature range 25–1000 °C. The effect of Cr-doping on the resultant microstructure, composition depth profile, and binding energy is discussed in terms of scanning electron microscopy (SEM), ion beam analysis by Rutherford backscattering spectrometry (RBS), and XPS.
II. EXPERIMENTAL METHODS
A. Sample preparation
Ti foils (99.6% purity) with dimensions of 10 × 10 × 0.1 mm3 were used for the anodizing to produce self-organized and well-aligned TiO2 nanotube arrays. The process of potentiostatic anodization was performed in a standard two-electrode electrochemical cell, with Ti as the working electrode and platinum as the counter electrode. Before anodization, Ti foils were mechanically polished, degreased by sonicating in ethanol, isopropanol, and acetone for 5 min each, followed by rinsing with deionized water, and then drying using nitrogen stream. After drying, the foils were exposed to the electrolyte, which consists of 100 mL of ethylene glycol, 2.04 mL of water, and 0.34 g of NH4F. The electrolyte’s pH was kept constant at pH = 6 and its temperature was kept at about 25 °C. The anodization process was performed under an applied voltage of 60 V for 0.5 h.Reference Vega, Prida, Hernández-Vélez, Manova, Aranda, Ruiz-Hitzky and Vázquez31, Reference Vega, Cerdeira, Prida, Alberts, Bordel, Pereiro, Mera, García, Hernández-Vélez and Vázquez32 After that, the resulting TiO2 structures were then rinsed in ethanol, immersed in hexamethyldililazane, and dried in air.
B. Cr-doping by ion implantation
The as-anodized samples were doped with Cr ions by exposure to a flux of ions directed perpendicular to the sample surface. The Cr ions were produced using a direct extraction high flux ion source, with a charge distribution close to the theoretical prediction (9% Cr+1, 75% Cr+2, 13% Cr+3, 3% Cr+4), corresponding to an average charge of +2.1, giving an average implantation energy of 63 keV. With these implantation parameters, the depth of Cr peak in TiO2 is close to the stopping and range of ions in matter (SRIM) prediction of 35 nm. The near-surface composition depth profiling of ion-implanted samples was measured by RBS using He1+ ions at 1.8 MeV and the implanted dose was ∼7 × 10¹⁴ ions/cm2. This phase of work was conducted at the Australian Nuclear Science and Technology Organisation.
C. In situ high-temperature x-ray and synchrotron radiation diffraction
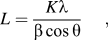
The in situ crystallization behavior of as-anodized or undoped TiO2 was characterized using high-temperature XRD up to 1000 °C in air using an Anton Paar HTK16 hot stage (Graz, Austria). The XRD patterns were acquired in steps of 100 °C from 400 to 1000 °C. The mean crystallite sizes (L) of anatase and rutile were calculated from (101) and (110) reflections, respectively, using the Scherrer equationReference Cullity and Stock33:
 $$L = {{K{\rm{\lambda }}} \over {{\rm{\beta }}\cos {\rm{\theta }}}},$$
where K is the shape factor (0.94), λ is the x-ray wave length, β is the line broadening at half the maximum intensity [full width at half maximum (FWHM)] in radians, and θ is the Bragg angle. The relative abundance of anatase and rutile at each temperature was computed using the Rietveld method. The models of Djerdj and TonejcReference Djerdj and Tonejc34 and Howard et al.Reference Howard, Sabine and Dickson35 were used to calculate the phase abundance of anatase and rutile, respectively, using the Rietica 1.7.7 software.
The in situ crystallization behavior of Cr-doped TiO2 was characterized using high-temperature synchrotron radiation diffraction (SRD) up to 900 °C in argon to avoid oxidation of the implanted Cr ions. The SRD measurements were conducted at the Australian Synchrotron using the Powder Diffraction beamline in conjunction with an Anton Paar HTK20 furnace and the Mythen II microstrip detector. The SRD patterns were acquired in steps of 100 °C from 100 to 900 °C at an incident angle of 3° and wave length of 0.11267 nm.
The collected XRD and SRD data were analyzed using the CMPR program/software to evaluate the integrated peak intensities of all phases present. The sum of all the integrated peak intensities in 2θ range of 10°–50° was used to calculate the relative phase content of all the phases present at each temperature as follows:
 $$W_{\rm{A}} = \left( {{{I_{\rm{A}} } \over {I_{\rm{A}} + I_{\rm{R}} + I_{\rm{T}} }}} \right) \times 100,$$
where W A is the wt% of anatase, I A is sum integrated intensity of anatase, I R is sum integrated intensity of rutile, and I T is sum integrated intensity of titanium. A similar ratio method was used to calculate the wt% of rutile (W R) or titanium (W T). This method is expected to be more accurate than the method of Spurr and MyersReference Spurr and Myers36 where only the peak intensities of anatase (101) and rutile (110) are used. The use of integrated peak intensities in Eq. (2) can minimize issues relating to preferred orientation, grain size, and/or degree of crystallinity. The CMPR program was also used to determine the FWHM of anatase (101) and rutile (110) reflections, respectively, to calculate the crystallite size using Eq. (1).
D. Scanning electron microscopy
The morphologies of the anodized and ion-implanted samples were characterized using a focused ion beam SEM operating at working distances of 5 mm with an accelerating voltage of 5 kV. The samples were gold-coated before the microstructure examination, and the images were taken using both secondary and backscattered electrons. Energy dispersive x-ray spectroscopy (EDS) was also conducted to analyze the elemental compositions of the samples.
E. X-ray photoelectron spectroscopy
XPS with Al Kα x-ray (hν = 1486.6 eV) radiation operated at 150 W was used to investigate the surface properties and to obtain the valence band spectra. The operating pressure of the spectrometer was typically 1 × 10⁻⁹ Torr. The x-ray spot diameter was ∼500 μm. The spectra were recorded in the fixed analyzer transmission mode with pass energy of 150 eV for recording survey spectra.
III. RESULTS AND DISCUSSION
A. Crystallization behavior
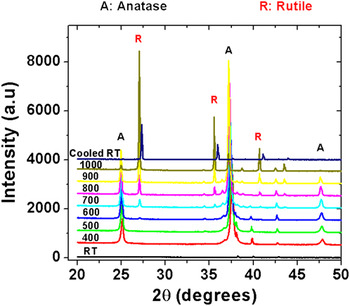
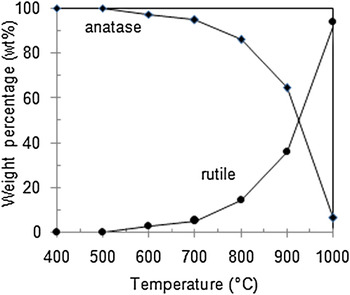
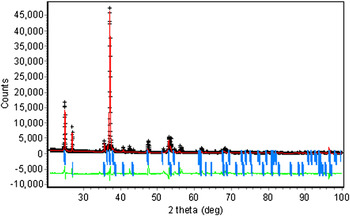
Figure 1 shows the XRD plots of undoped TiO2 before and after thermal annealing in air at different temperatures ranging between 20 and 1000 °C. The anodic TiO2 nanotube arrays before thermal treatment were amorphous but eventually crystallized at 400 °C to form anatase, which started to decrease in abundance but persisted at up to 1000 °C. A small amount of rutile started to form at 600 °C and its abundance increased rapidly after 800 °C, which corresponds to the rapid decrease in anatase. Since anatase is well known to be metastable, it began to transform into rutile at about 600 °C. Figure 2 shows that phase abundances of anatase and rutile as a function of temperature. A typical Rietveld profile fit for the XRD data at 800 °C is shown in Fig. 3. The good refinement quality of diffraction data can be discerned by the acceptable fitting parameters of R p = 17.4; R wp = 26.0; R exp = 3.5; R B (anatase) = 5; and R B(rutile) = 10.
High-temperature XRD plots for pure TiO2 showing the in situ crystallization of anatase and rutile from the amorphous TiO2 in the temperature range 20–1000 °C.

Phase abundances of anatase and rutile for pure TiO2 in the temperature range 20–1000 °C.

XRD profile plot for pure TiO2 nanotubes at 800 °C. Measured and calculated patterns are indicated by crosses (black) and solid line (red), respectively. Intensity differences between the two patterns are shown along the bottom of the plot (green). Vertical bars (blue) represent the allowable peak position for each of the phases (from top to bottom: anatase and rutile).

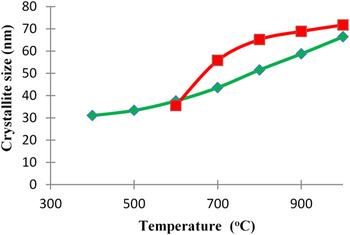
There was also a distinct narrowing and sharpening in the (101) peak for anatase and (110) peak for rutile. The corresponding increase in crystallite size calculated from the Scherrer equation is shown in Fig. 4. The crystallite size of anatase was about 30 nm at 400 °C and increased gradually with temperature to ∼65 nm at 1000 °C. The crystallite size of rutile formed at 600 °C was about 35 nm, which grew rapidly and leveled off at 1000 °C with a size of 70 nm. It should be emphasized that the values of crystallite size reported here are only relative because the contribution of strains on peak broadening has been ignored in the calculation using the Scherrer equation.
Variations of crystallite size of anatase (♦) and rutile (■) as a function of temperature for pure TiO2.

The fraction of anatase-to-rutile transformation in the samples annealed at between 600 and 1000 °C can be calculated from the followed equationReference Spurr and Myers36:
 $$x = 1/[1 + 0.8(I_{\rm{A}} /I_{\rm{R}} )],$$
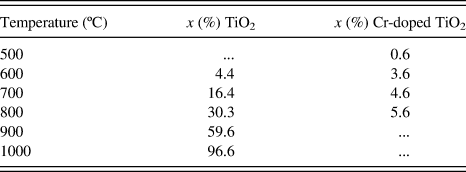
where I A is the x-ray integrated intensities of the (101) reflection of anatase at about 25.5°, while I R is that of the (110) reflection of rutile at about 27.7°; x is the weight fraction of rutile in the nanotubes, which is calculated to be 4.4% for the nanotubes annealed at 600 °C, 16.4% at 700 °C, 30.3% at 800 °C, 59.6% at 900 °C, and 96.6% at 1000 °C (see Table I).
Fractions of anatase-to-rutile transformation in pure and Cr-doped TiO2 at various temperatures.
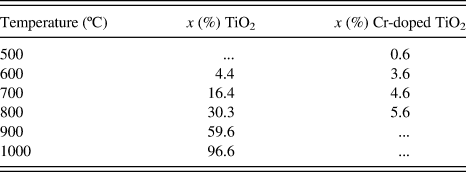
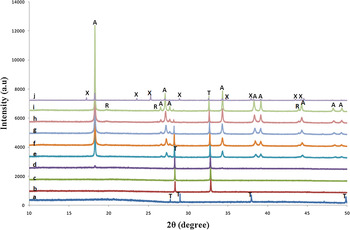
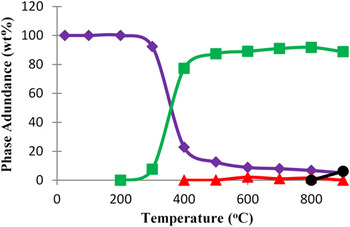
Figure 5 shows the SRD plots of Cr-doped TiO2 nanotubes before and after thermal annealing in argon at 20–900 °C. The TiO2 nanotube arrays were initially amorphous but eventually crystallized to anatase at 300 °C. The peak intensities of anatase increased rapidly when the annealing temperature rises from 300 to 400 °C and continued to increase until 900 °C. The formation of rutile commenced at 500 °C but its growth was sluggish where the peak intensities increased very slightly from 500 to 800 °C. However, rutile disappeared at 900 °C with the concomitant appearance of TiO2−x where x = 0.2 (see Fig. 6). This suggests that rutile was unstable in argon atmosphere at 900 °C and decomposed to form a nonstoichiometric titanium oxide and oxygen vacancies (Ov) as follows:
 $$5{\rm{TiO}}_2 \buildrel {900\,\circ {\rm{C}}/{\rm{argon}}} \over \hscale350%\longrightarrow {\rm{Ti}}_{\rm{5}} {\rm{O}}_{\rm{9}} + {\rm{O}}_{\rm{v}} .$$
In situ SRD plots of Cr-doped TiO2 nanotubes showing the existence of anatase (A), rutile (R), Ti5O9(X), and titanium (T) in the temperature range 20–900 °C. (Legend: a = 20 °C, b = 100 °C, c = 200 °C, d = 300 °C, e = 400 °C, f = 500 °C, g = 600 °C, h = 700 °C, i = 800 °C, j = 900 °C).

Variations of phase abundances as a function of temperature for Cr-doped TiO2 nanotubes. [Legend: titanium (♦); anatase (■); rutile (▲); TiO2−x(•)].

In contrast, no decomposition of rutile was observed in undoped TiO2 nanotubes (see Fig. 1). When compared to Cr-doped TiO2, both anatase and rutile in pure TiO2 crystallized at a higher temperature, i.e., 400 and 600 °C, respectively. Using Eq. (3), the fraction of anatase-to-rutile transformation in Cr-doped TiO2 at between 600 and 1000 °C was computed to be 0.6% at 500 °C, 3.6% at 600 °C, 4.6% at 700 °C, and 5.6% at 800 °C. As shown in Table I, these values are significantly when compared to pure TiO2.
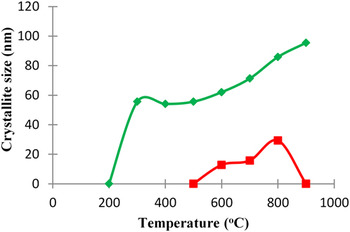
Figure 7 shows the influence of annealing temperature on crystallite size for anatase and rutile in Cr-doped TiO2. The crystallite size of anatase was about 55 nm at 400 °C and increased gradually with temperature to 100 nm at 900 °C. In contrast, the crystallite size of rutile formed was much smaller than anatase and peaked at 700 °C with only 33 nm in size.
Variations of crystallite size (L) of anatase (♦) and rutile (■) as a function of temperature for Cr-doped TiO2 nanotubes.

It appears that the presence of Cr-doping has accelerated the formation of anatase and rutile at a lower temperature, probably through the facilitation of defects such as vacancies. It is widely accepted that the onset temperature of the anatase to rutile phase transformation and the rate at which it proceeds can be affected significantly by dopants, firing atmosphere, microstructure, sample morphology, and the presence of impurities in the material.Reference Hanaor and Sorrell1 The process of the anatase-to-rutile transformation is known to occur via (i) the nucleation of rutile at point defects, oxygen vacancies, secondary phase inclusions, particle surfaces, and/or at (112) twin interfaces in anatase and (ii) the subsequent consumption of the anatase phase by the growing rutile phase. The formation of rutile from the metastable phase anatase is reconstructive and so takes place through atomic rearrangement involving the breaking of two of the six Ti–O bonds in the TiO6 octahedra.Reference Riyas, Krishnan and Mohandas37 As anatase transforms into rutile, significant grain growth takes place, resulting in lower surface area and thus poorer photocatalytic performance.
Transition metals (e.g., Cr) of variable valence are reported to enter the titania lattice and create oxygen vacancies through reduction effects as followsReference Hanaor and Sorrell1, Reference Mackenzie38:
 $$2{\rm{M}}^{n + } + {\rm{O}}^{2 - } \to 2{\rm{M}}^{(n - 1) + } + {1 \over 2}{\rm{O}}_2 + {\rm{O}}_{\rm{v}} ,$$
where M denotes a transition metal atom and Ov denotes an oxygen vacancy. Once substituted for Ti4+, the reduction of such species gives rise to new oxygen vacancies and so enhances rutile formation from metastable anatase through easing of structural rearrangement. These oxygen vacancies are believed to be responsible for crystallization of anatase at a lower temperature in Cr-doped TiO2 as well as destabilization and subsequent decomposition of rutile to form nonstoichiometric TiO2−x.
B. Microstructures and formation mechanisms of nanostructured TiO2
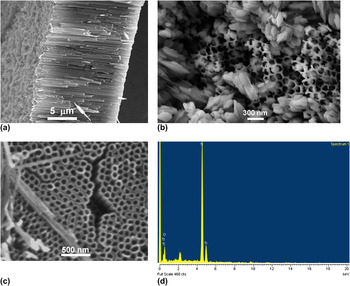
After anodizing in the electrolyte of NH4F/H2O/Ethylene glycol at 25 °C for 20 h, a homogeneous layer of TiO2 nanotubes formed on the Ti foil. Figure 8(a) shows the SEM image of the microstructure of amorphous TiO2 nanotubes in the as-anodized sample. Upon annealing at 400 °C for 2 h, vertically oriented and highly ordered arrays of anatase nanotubes with diameter of ∼80 nm formed [Fig. 8(b)], which concur well with previous studies on anodized TiO2.Reference Prida, Hernandez-Velez, Pirota, Menendez and Vazquez39, Reference Varghese, Gong, Paulose, Grimes and Dickeya40 The EDS analysis of nanotubes in Spectrum 1 of Fig. 8(c) indicated 31.04% Ti and 68.96% O, thus confirming the presence of TiO2 in the sample. Upon annealing at 900 °C for 1 h, some anatase transformed into rutile that appeared as elongated grains randomly distributed among the nanotubes, as shown in Fig. 8(d).
Scanning electron micrographs showing the microstructure of pure TiO2 nanotubes (a) at room temperature, (b) at 900 °C, (c) at 400 °C for 2 h, and (d) the corresponding EDS analysis of composition in Spectrum 1.

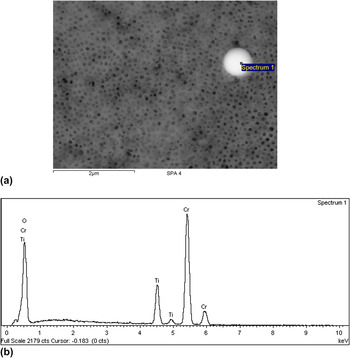
The microstructure of Cr-doped TiO2 is shown in Fig. 9(a) where the morphology of nanotubes has been retained during the process of ion implantation. The existence of implanted Cr ions has been verified by the EDS analysis of a bright region in Spectrum 1 as shown in Fig. 9(b).
Scanning electron micrographs showing the microstructure of (a) Cr-doped TiO2, (b) EDS analysis of composition in Spectrum 1.

C. Composition depth profiles and binding energies
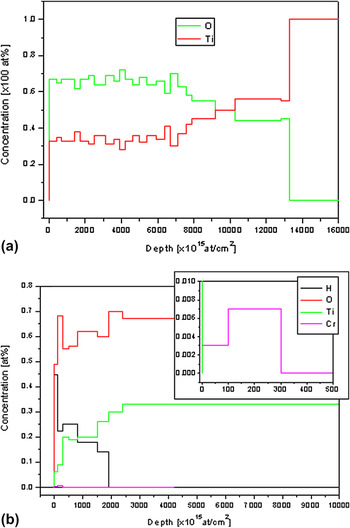
The RBS results in Fig. 10 show the concentration of elements (at.%) versus depth (at./cm2) for both the undoped and Cr-doped samples. The depth profile of Ti and O for undoped TiO2 is shown in Fig. 10(a) where the composition at near-surface layer is fairly constant but a composition gradation in both O and Ti exists at the interface between the substrate and the oxide layer. In the Cr-doped sample [Fig. 10(b)], it is shown that a maximum Cr concentration of 0.7 at.% has been implanted in TiO2 down to a depth of about 300 monolayers. A composition gradation also appears to exist at the interface between the substrate and the oxide layer.
Composition depth profiles in (a) pure TiO2 and (b) Cr-doped TiO2 nanotubes. Inset shows the close-up view of Cr concentration.

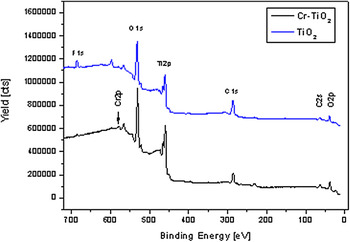
The XPS plots in Fig. 11 show the binding energies of elements present in both undoped and Cr-doped TiO2 nanotubes. The presence of Cr in the doped sample is evident by the display of Cr 2p peak. When compared to Cr-doped TiO2, significantly, more fluorine is present in pure TiO2. The cause of this diminished fluorine in Cr-doped TiO2 is uncertain, although it is quite possible that the process of ion implantation may have caused some fluorine to escape. Also noticeable is the slight peak shifts of Ti 2p and O 1s to the lower binding energy for Cr-doped TiO2. Such peak shifts have also been observed for Cu-doped TiO2.Reference You, Kim and Sung41 This suggests that the Ti 2p binding energy in Cr-doped TiO2 nanotubes increased when compared to that of pure TiO2. The peak shift also illustrates the incorporation of Cr ions into the TiO2 lattices. These results suggest that the Cr3+ ions are doped in the TiO2 lattice forming a substitutional solid solution. When TiO2 is doped with Cr3+ ions, the binding energy change in each atom occurs due to the electron transfer from Ti4+ to Cr3+. In essence, the Fermi level of Cr2O3 is lower than that of TiO2, thus resulting in the outer electron cloud density of Ti to decrease and that of Cr to increase.
XPS plots showing the chemical states and binding energies for pure and Cr-doped TiO2 nanotubes.

IV. CONCLUSIONS
High-temperature SRD has been used to study the effect of Cr-doping on in situ crystallization of anatase and rutile in as-anodized TiO2 nanotubes. The TiO2 was initially amorphous but crystallized to anatase and rutile at elevated temperature. Cr-doping has lowered the crystallization temperature of anatase from 600 to 400 °C and rutile from 600 to 500 °C. In addition, it has reduced dramatically the fraction of anatase-to-rutile transformation. The rutile formed in TiO2 was very stable after annealing at 1000 °C but became unstable in Cr-doped TiO2, which decomposed to form TiO2−x at 900 °C. Ion beam analysis by RBS has confirmed the existence of Cr ions composition gradation in doped TiO2. The real doping of Ti lattices with Cr ions was evidenced by the analyses of surface compositions and chemical states of the nanotubes using XPS.
ACKNOWLEDGMENTS
This work was supported by funding from the Australian Synchrotron (PD-3611), the Australian Institute of Nuclear Science and Engineering (AINGRA-11134), and Spanish MAT2010-20798-C05-04. We thank Ms. E. Miller of Curtin Centre for Materials Research for assistance with the SEM work. The scientific support from the University of Oviedo SCTs, particularly to the Nanoporous Membranes Unit and Photo-electronic Spectroscopy Laboratories is also acknowledged.