In a series of studies of commodity market integration, Kevin O'Rourke and Jeffrey Williamson do not see evidence of “significant pre-nineteenth-century global price convergence for the (competing) commodities that really mattered to the economic lives of the vast majority.'Footnote 1 Using commodity price convergence as a “hard” definition of globalization, they argue that “globalization became economically meaningful only with the dawn of the nineteenth century, and it came on in a rush.”Footnote 2 Although some have qualified this statement by emphasizing a “soft” form of globalization that emphasizes migrations and transmissions of disease and culture, among many factors, the claim that globalization was not important economically until the nineteenth century remains very influential among economists and economic historians, and not without good reason.Footnote 3
We present historical and statistical evidence showing that the integration of international commodity markets started in the eighteenth century. By 1790 the integration of grain markets between the United States and Europe and within Europe had already reached high and unprecedented levels by any standard. The process was gradual and experienced setbacks, particularly during wars, of varied spatial extension, intensity, and duration. The path of commodity market integration in the eighteenth century was an accumulation of small incremental changes explained by the 1) emergence of new grain exports from British North America and Russia, 2) liberalization of trade within and across boundaries of national and imperial political entities, 3) expansion of national and international grain trade, and 4) reduction in the costs of moving goods and spreading information throughout expanding domestic and international markets. Early globalization was aided by the easy access to the sea and the availability of waterways in Europe and North America and by Europe's “proximity to America.”Footnote 4
Market disintegration occurred with the French Revolution and during the Napoleonic Wars in ways that reinforce the findings on the Atlantic economy by O'Rourke and confirm Karl Gunnar Persson's intuition and Giovanni Federico's assertion on the behavior of grain price dispersion in Europe.Footnote 5 The impact of this reversal was still perceptible long after Waterloo. In the 1830s and 1840s some grain markets in the West were still less integrated than in the 1780s. By then, however, the trend toward globalization had resumed and adopted many of the features that have been captured by O'Rourke and Williamson's contributions.
In addition to the discussion of abundant historical evidence, we perform extensive time-series analysis of wheat price series for a number of markets in Europe (Arévalo, Gdansk, Holland, London, Milan, Strasbourg, and Vienna) and the Americas (Buenos Aires, Mexico, and Pennsylvania) for the period 1703 to 1815. Due to data restrictions, our analysis has only been extended into the nineteenth century for some markets (Holland, London, Pennsylvania, and Vienna). We perform the analysis using all nominal and relative price time series in the sample.Footnote 6 We assume that a key sign of increasing market integration is a reduction over time in the dispersion of the unexpected shocks affecting the relative prices. We call this process synchronization of nominal prices. We approximate this dispersion with the Standard Deviation of the Residuals (SDRs) of the Autoregressive Integrated Moving Average (ARIMA) models of the relative price time series. It is worth noting that synchronization and convergence of nominal prices are different properties. Synchronization relates to a declining dispersion of the unexpected shocks that affect the relative prices between two given markets, while convergence implies a reduction in the gap between nominal prices. Both synchronization and convergence are found in the time series of wheat prices analyzed.
Formally, we define the Law of One Price (LOP hereinafter) as holding when the time series of the nominal prices for the same commodity in different markets are nonstationary, and the time series of the relative prices between different markets are stationary. In comparison with alternative methodologies, our definition proves to be a rather strict sufficient condition for the hypothesis that markets are integrated. Therefore, the first two steps in our methodology allow distinguishing whether or not two markets are integrated. Additionally, for those markets that proved to be integrated, a third step permits us to measure and compare their integration level over time.
HISTORICAL EVIDENCE ON EARLY MARKET INTEGRATION: TRADE FLOWS AND TRANSACTION COSTS
Diverse pieces of historical evidence about the location of trade and the size of the flow suggest that grain markets became more integrated over the eighteenth century and reached a peak by the 1780s that had not been reached earlier. New producers emerged; intercontinental political entities increased the openness of trade; international trade increased in spite of warfare and mercantilist policies; and transactions costs decreased.
Emergence of New Producers for the International Market
The United States and Russia emerged as international grain traders much earlier than has usually been recognized in the relevant literature. From 1739 forward grain and flour from British North America was being unloaded in Marseilles. By the late eighteenth century, the Ukraine was exporting wheat to Turkey, France, Spain, and Portugal.Footnote 7 Plenty of evidence suggests that the cereal economy of the Thirteen Colonies experienced fast growth long before their independence.
Paul Sharp shows convincing evidence of the “long American grain invasion of Britain” that had begun by the mid-eighteenth century. The Navigation Acts, the Seven Years' War, and the conflict between the colonies and Britain that developed into the Revolutionary War interfered with the ongoing process of intercontinental market integration. British North American exports of wheat may not have been very significant quantitatively, but Sharp's econometric analysis suggests that “some degree of long-run market integration was already present in the trade in wheat between the United States and the United Kingdom from the eighteenth century.”Footnote 8
In fact, Sharp's findings do not fully capture the real extent of this initial intercontinental market integration. Abundant evidence suggests that British North American grain influenced other European markets directly, via exports or reexports, and indirectly, via flows of information.Footnote 9 Cathy Matson shows that grain production and exports from the Thirteen Colonies had been responsive to the conditions in the Atlantic economy since the 1740s.Footnote 10 American wheat had already been exported to Britain in years of bad harvest before to the passing of the Corn Law of 1774, which inaugurated an era of bilateral “free trade” in grain that lasted until 1815.Footnote 11 By 1768–1772 significant quantities of grain were exported from the Middle Colonies to continental Europe, greatly exceeding the amounts sent for consumption in Britain and Ireland as a destination and similar to the quantity sent to the West Indies.Footnote 12 Southern Europe constituted an important market for the wheat from the Middle Colonies.Footnote 13 Exports of wheat and flour from the Mid-Atlantic region, Pennsylvania in particular, increased by half between 1768–1772 and 1790–1792.Footnote 14
Russia also emerged as an important grain exporter in the eighteenth century. Territorial conquests, forest cleaning, and transformation of meadows and pastures led to a more than twofold rise in the plowed land area in Russia between 1696 and 1796.Footnote 15 Russian exports of grains were facilitated further by the foundation of Saint Petersburg in 1703.Footnote 16 As in other European countries, the state made a significant contribution to domestic market integration by purchasing grain for the armed forces, liberalizing the grain trade in the 1760s, and the construction of ports, canals, and roads.Footnote 17 New areas were cultivated along the Volga River. Two successful military campaigns against the Turkish Empire in 1768–1774 and 1787–1792 gave Russia access to trade routes in the Black Sea. By 1791–1801 exports of wheat through the Black Sea ports had grown enormously and even exceeded that of the shipments through the Strait of Sound. The share of grains in Russian exports rose from 2.9 percent in 1710 to 16.9 percent in 1769 to 20 percent by the early 1800s, while total exports increase by a factor of almost 50.Footnote 18
Significant Openness Reached by Intercontinental Political Entities
The expansion of grain markets was aided by increasing policy openness to foreign trade within the Spanish Empire. Spain partially liberalized import policy in 1756 and 1757 and then approved domestic free trade of grain in 1765. Tariffs declined from the 1760s in Britain, France, Spain, and Russia. All had opened their national markets to foreign trade, although their policies on grain imports were not always consistent.Footnote 19 Widespread trade liberalization of the nineteenth century therefore had, at least for grain, a precedent in the decades predating the years 1792–1815. Similar to the British case, Spain proved to be less protectionist in the grain trade during the last decades of the eighteenth century than after 1820, when imports were simply forbidden.
The main Spanish port, Cádiz, received significant quantities of wheat and flour from Northern Europe, Italy, and the Western Mediterranean, Eastern Mediterranean and Black Sea, North America, and Atlantic Africa-Barbary from at least 1768 to 1806.Footnote 20Footnote 21 Cataluña, self-sufficient in grains by the early eighteenth century, was importing by 1800 more than thirty thousand metric tons of wheat annually, a significant part of total consumption in coastal areas.Footnote 22 Barcelona and the Mediterranean towns of Alicante and Valencia also relied on imports for satisfying an increasing demand for wheat and flour in response to their growing population and economic specialization.Footnote 23 British North America's exporters of wheat and flour were given access to the peninsula and the Canary Islands long before the boom of 1812–1814.Footnote 24 American wheat reached Alicante from 1777 onward and had been arriving in the Canary Islands since mid-eighteenth century.Footnote 25
Grain from the Levant, some originating in Russia, and Northern Africa was indispensable for the Spanish towns in the Mediterranean.Footnote 26 Trade flows were enhanced as the Spanish Navy increased its effectiveness at suppressing Muslim piracy on Spanish coastal provinces and vessels in the mid-eighteenth century. Between 1767 and 1791 Treaties of Peace, Friendship, and Commerce between the Hispanic Monarchy and Morocco, the Ottoman Empire, Tripoli, Alger, and Tunisia were signed.Footnote 27
During the American Revolution, wheat and flour exports found a niche within Spanish America. Cuba was allowed to trade with British North America and became an important outlet for American grain.Footnote 28 Some shipments had already been arriving at the island on an irregular basis in the 1760s.Footnote 29 In 1797, as a consequence of the British Navy's blockade, the “commerce of neutrals” with the Spanish American territories was authorized.
After 1783 a decrease in the Spanish tariffs on flour triggered the reexports of U.S. flour from the Canary Islands to Cuba.Footnote 30 Mexican wheat was shipped through Veracruz to the Caribbean.Footnote 31 Exports of wheat from Chile to Peru were common and quite significant during the colonial period and predated those made to California, Australia, and the Pacific in the mid-nineteenth century.Footnote 32 However, as our empirical results show, distance, regulations, and differences in nutritional habits prevented the entire economic union formed by the Spanish territories in America from becoming a fully integrated market for grain.
As in other European countries, domestic market integration increased in Spain during the second half of the eighteenth century.Footnote 33 A similar process is observed after the 1780s in Mexico.Footnote 34
Increasing International Trade in Spite of Warfare and Mercantilism
Skepticism about globalization in the eighteenth century might also have been strengthened by an overestimation of the effects of mercantilism and warfare on grain market integration. Certainly, restrictive mercantilist policies along with repeated and widespread international armed conflicts did not facilitate market integration.Footnote 35 However, expansion of a “cereal economy” in British North America and rapid population growth and increasing grain prices in Europe seem to have been powerful stimuli that compelled governments to adopt a series of ad hoc market-friendly policies toward grain, including reductions in tariffs, liberalization of imports, and suppression of medieval regulations on market function, if only because of the generalized political problem represented by feeding a growing number of subjects facing more and more expensive staples.Footnote 36
Some of the obstacles to globalization in the early modern era found by Jan De Vries, O'Rourke, and Williamson and Ronald Findlay and O'Rourke might not have applied to grain trade in the West.Footnote 37 A few privileged companies did not monopolize national and international commerce in grain. The Baltic trade “was characterized by free enterprise.”Footnote 38 “Some 70 merchant companies were involved” in the wheat and flour trade between Veracruz and La Habana of the 1800s.Footnote 39 The competition likely reduced the markups on shipping costs relative to the markets where the East India Company and other privileged companies traded.
Moreover, the volume of the grain trade within the West was significantly larger than the Asian-European trade. Between 1700 and 1759 the yearly average volume of English and Baltic exports of grain quadrupled the tonnage, ballast included, of the vessels involved in the commerce between Asia and Europe.Footnote 40 From 1760 to 1795 the volume of Baltic grain exports through the strait of Sound exceeded the tonnage of the Euro-Asian trade.Footnote 41
In the eighteenth century, in spite of mercantilism and almost constant warfare between Western powers, foreign trade increased substantially. Neutrality proved very beneficial for the shipping and trading companies of Denmark-Norway, even after the 1790s. Sweden benefitted from neutrality in its Mediterranean trade.Footnote 42 The tonnage of the combined merchant fleets of North America, Scandinavia, France, and Britain grew threefold between 1670 and 1780.Footnote 43 Following an almost century-long stagnation, the Dutch shipping industry resumed growth in the second half of the eighteenth century.Footnote 44 The dramatic fall in the volume of shipping caused by the Fourth Anglo-Dutch War in 1781 and 1782 was followed in 1783 by a strong recovery.
Foreign trade experienced significant growth in Britain, British North America, France, Russia, Spain, and Spanish America.Footnote 45 Constant warfare and mercantilist policies were not intense enough to permanently suppress the forces favoring the long-run growth of international trade in the West. It well might be that Leos Müller is right when claiming that warfare had “less negative impact on the functioning of the eighteenth-century trading system than some historians believe.”Footnote 46
Reductions in Transaction Costs
The impact on integration of improvements in transport and communications, reductions in other transaction costs, and the defeat of piracy in the Mediterranean may have been underestimated. Integration can improve without a transport revolution. Witness the expansion in the second half of the twentieth century despite the absence of a sharp or dramatic fall in transport costs.” Footnote 47 David Jacks and Krishna Pendakur do not attribute a primary role to the maritime transport revolution in the explanation of the trade boom of the late nineteenth century.Footnote 48 Neither David Hummels nor Saif Mohammed and Williamson find any clear downward trend in ocean shipping rates during the globalization of the late twentieth century.Footnote 49 Both periods of globalization appear to have been fostered more by changes in communications with the telegraph and telephone in the 1800s and later the internet, satellites, radio, and television in the twentieth century.
Milja Van Tielhof convincingly shows substantial improvements in the postal system, which resulted in faster, cheaper, and more regular transmission of commercial information between Amsterdam and Baltic markets.Footnote 50 There was progress in most postal services across the West.Footnote 51 Christian Van Bochove concludes that “substantial improvements in the quality and speed of information” caused the narrowing of the connection between Northern European grain markets over the eighteenth century.Footnote 52 More generally, the importance of the improvements in information transmission for the growth of trade and market integration during the second quarter of the nineteenth century, some decades before the diffusion of the electric telegraph, has also been argued by Yrjö Kaukiainen.Footnote 53
Jean-Michel Chevet and Pascal Saint-Amour emphasize the role of information in the integration of French regional markets before any significant improvement in transport networks.Footnote 54 A similar claim is made for eighteenth-century Spain.Footnote 55 Bertrand Roehner argues that the idea of arbitrage results in an “effet de contagion de proche en proche” that contributed to better information flows.Footnote 56 Market integration, then, was not just solely about transporting grain physically between distant markets but also about transmitting information between them.
Communications were facilitated by physical improvements in transport networks within countries. Dan Bogart shows that transport in England experienced substantial improvements long before the arrival of the railways.Footnote 57 Improvements in roads, canals, and ports also took place in France, Russia, and Spain. Besides, maritime transport, if only because of its higher regularity and predictability, also contributed to domestic and international market integration. Likely, this contribution was reinforced by some, even if small, reduction in the cost of freights as well.
Other transaction costs seem to have decreased as well. The decline of piracy has been proposed as a factor to explain the increasing efficiency of Atlantic Ocean shipping during the first half of the eighteenth century.Footnote 58 Van Tielhof shows evidence of substantial reductions in transactions costs and storage and measuring costs in the Amsterdam grain trade from 1730 onwards.Footnote 59 More efficient and open markets, as well as reductions in handling costs might have been behind the “early globalization” in exotic overseas commodities.Footnote 60 Steven Topik offers a similar explanation for his claims that the world coffee market had reached a high degree of integration by the second half of the eighteenth century.Footnote 61 Improvements in the expanding insurance industry based in London have also been noted.Footnote 62 Carles Manera shows some decrease in maritime insurance rates in the Mediterranean port of Mallorca over the eighteenth century.Footnote 63
DATA
The dimension of market integration and globalization on which O'Rourke and Williamson and many economic historians focus is the convergence of prices and reductions in fluctuations in prices in response to shocks. To examine this issue, we consider ten markets for wheat in Europe: Amsterdam and Holland (H), Arévalo in Central Spain (A), London and Southern England (L), Gdansk (G), Milan (M), Strasbourg (S), and Vienna (V). Prices for the Americas come from Buenos Aires (BA), Upper Bajío in Central Mexico (Mx, hereinafter Mexico), and Pennsylvania (P). The selection of markets is based on data availability and geographical representativeness. Markets in the Baltic, the North Sea, the Mediterranean, Central Europe, and North and South America are represented in our sample.Footnote 64 Given the geographical and economic differences between markets, we expect dissimilarities in terms of intra- and intercontinental integration. Within Europe, more integration is expectable from London or Holland, which occupied leading trade positions, than from a market, like Arévalo, which was located in a landlocked location and more isolated from international commercial flows.Footnote 65
In the Americas, more integration is expected in the grain trade between European cities and Pennsylvania than between the cities in Europe and Mexico and Buenos Aires. Pennsylvania was part of a specialized, maritime economy and the main grain producer for domestic and foreign markets. On the contrary, regulation and geography conspired against the integration of Mexico and Buenos Aires in international grain markets.
We use annual data series that cover the eighteenth and early nineteenth centuries for most markets. In Holland, London, Pennsylvania, Strasbourg, and Vienna, data are available that allow us to study intra- and intercontinental market integration throughout the eighteenth and nineteenth centuries. The data come from publicly available, reliable, secondary sources that are shown in the Appendix.Footnote 66
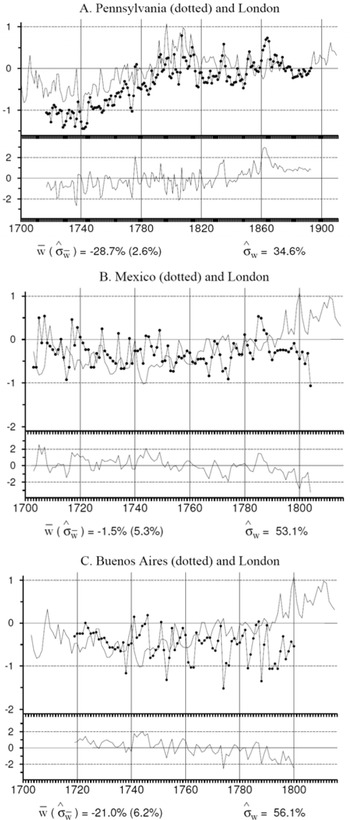
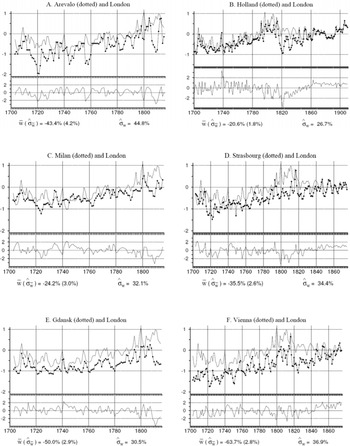
As a common unit of measure, we use prices in terms of grams of silver per liter of wheat. The natural logs of the price data are depicted in Appendix Figures 1 (America) and 2 (Europe)—see the Appendix. As a robustness check of our results, prices in terms of the domestic currency of all the markets (except Gdansk and Holland) have also been used with little change in the results, except for some particular events in a few countries.Footnote 67
METHODOLOGY AND MODELS
The methodology involves three steps that are illustrated by comparison of the London and Pennsylvania markets. The process is followed for all market pairs.
Drawing on economic theory, it is expected that any market-clearing (log) nominal price follows a nonstationary process over time.Footnote 68 By definition, a stationary price level cannot change over the long run as to clear the market precisely because stationarity implies a long-term fixed, constant value. However, since market conditions can change owing to many factors, prices need to react to those changes in order to clear the market. Therefore, our analytic framework requires that the level of the time series of log nominal prices in the markets considered (for example, the natural log of the wheat price in London (lnPLt) from 1703 to 1815) follows a nonstationary process if only because otherwise they would not be market-clearing prices.
Second, integration between distant markets—globalization being an extreme case—is tested in a way consistent with the LOP. The intuition behind the LOP is that arbitrage opportunities in an efficient market can only be temporary. In the long run, trade makes arbitrage opportunities disappear. Thus, in an ideal world without transaction costs prices for the same good in two different markets would be identical if those markets are integrated. Stochastically, the strong version of the LOP implies that the natural log of the relative price for Pennsylvania and London (ln(PPt/PLt) or lnPPt – lnPLt) from 1720 to 1815 can be represented as a constant zero-mean random variable with transitory shocks that fluctuate around this mean. However, in the real world, a weaker version of the LOP permits that the constant mean of two log nominal prices can be distinct from zero. This nonzero mean captures the size of transaction costs.Footnote 69 Therefore, a second requirement of our analytic framework is the stationarity, the existence of a zero or nonzero constant mean, of the time series of the natural log of the relative prices.Footnote 70
Third, the (autocorrelation-corrected) fluctuations around the constant mean of the relative price time series can be considered as the net idiosyncratic shocks in the two markets (in other words, Pennsylvania and London). Integration enhances the ability of the two markets to cope with those shocks in nominal prices. Therefore, one would expect that as integration between these two markets increases, the dispersion of those transitory shocks would decrease. Thus, we should observe a decline over time in the Standard Deviation of the Residuals (SDRs) of the relative price. This is our third and last requirement for the existence of integration between two markets.
Empirically, we proceed this way. Our analysis starts by testing for nonstationarity of the time series of the log of the nominal Pennsylvania wheat price (ln PPt) and the nonstationarity of the time series for the log nominal price in London (ln PLt). If an individual time series of the level of log prices is not stationary, we take the first differences of the series (for Pennsylvania, for example: lnPPt – lnPPt –1) and test for nonstationarity again. In all cases when the level of the series was nonstationary, it turned out that the first difference of the series was stationary. Only the Mexico and Buenos Aires' price series are stationary in levels.Footnote 71 In the second step, we test for cointegration in the price series that require one difference to be stationary. Following Mario Forni, we test cointegration by just testing the nonstationarity of the log relative price (e.g., ln(PPt/PLt)).Footnote 72 After having confirmed that the nominal prices need one difference to be stationary, testing the stationarity of the relative prices implies testing whether the LOP holds between London and Pennsylvania.
We agree with Persson, Mette Ejrnaes, and Persson, and Carol Shiue and Wolfgang Keller that cointegration provides substantial evidence in favor of market integration.Footnote 73 In our article, however, we are more restrictive, as we require the LOP to hold, which means the cointegration parameter must be equal to −1. When the nominal price time series for London and Pennsylvania are nonstationary and the time series of their relative price is stationary, we can be certain that the two markets operate according to the LOP and are integrated. But integration can evolve over time and vary across space. Our analytical framework is flexible enough to measure those changes and differences. Were London and Pennsylvania more integrated in the 1740s than in the 1790s? Were London and Pennsylvania more integrated than Arévalo and Gdansk in the 1750s?
Thus, when the LOP cannot be rejected, we analyze the SDR obtained from the ARIMA model of the relative prices for any pair of markets. Peter Földváry and Bas Van Leeuwen discuss the advantages of using the dispersion of the residuals for measuring market integration over other commonly used approaches like coefficients of variation.Footnote 74 The SDR from the log relative price time series reflects the effect of unexpected shocks on the relative price volatility. If market integration improves, the impact of unexpected shocks has less effect on relative prices. Consequently, a decrease (increase) in SDRs suggests an increase (decrease) in the markets' ability to cope with shocks on nominal prices and, hence, a higher (lower) degree of integration. We call this process synchronization (desynchronization) of nominal prices and take it as an indicator of market integration (disintegration).
Notice that synchronization and convergence are different concepts. Synchronization means a decline in the dispersion of the unexpected shocks affecting the log relative prices. Convergence, however, implies a significant contraction in the gap between nominal prices due to reductions in transactions costs.
Our study of the SDRs is twofold: formal statistical testing and graphical inspection. The formal statistical test consists of estimating the residual variances for two subsamples, period a (from 1703 to 1757) and period b (from 1758 to 1792). We then test whether the ratio of the residual variances (σ2a/ σ2b) is greater than one with 90 percent confidence. If so, the residual variance is lower in the second period than in the first one. Graphical inspections can be performed with Figures 1, 2, and 3. They show the standard deviation calculated with rolling windows of 35 residuals (from time t − 35 to time t) obtained from the ARIMA model of the relative price of any pair of markets.
ECONOMETRIC MODELS
All nonstationary time series for log nominal prices have the following statistical properties: a stochastic trend that can be removed by taking differences; a small number of outliers; a zero-mean; a second-order autoregressive structure that represents cyclic behavior (ranging from 5.4 years in Strasbourg to 10.6 in Vienna); and a first-order moving average operator.Footnote 75 The following univariate additive model represents the nominal log prices

where is a vector of intervention terms designed to capture worldwide shocks and Nt is the log nominal price corrected for interventions that follows an ARIMA(2,1,1) model.Footnote 76
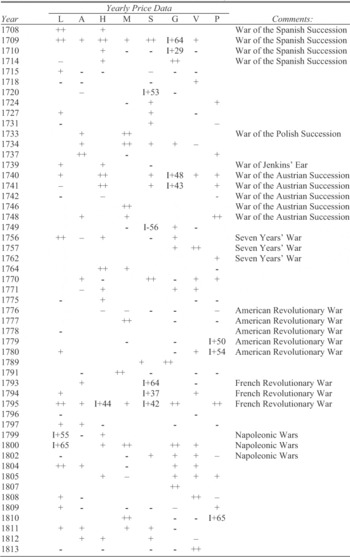
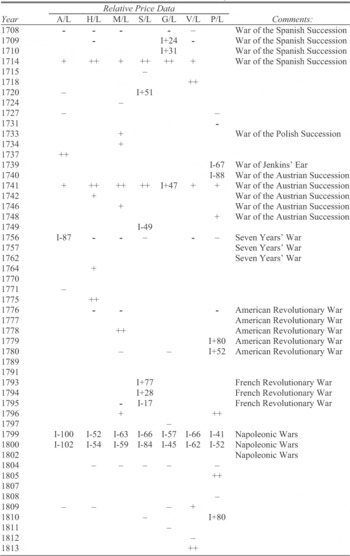
The intervention terms were included to control for major shocks, typically wars. Tables 1A and 1B show the presence of extreme residuals in many cities in the same years suggesting that most markets were hit by the same shocks. In Europe, the extreme residuals appeared most often in the years associated with the War of the Spanish Succession, the War of Jenkins' Ear, the French Revolution, and the Napoleonic Wars. In Pennsylvania, the extreme residuals coincide with the American Revolutionary War.
The results of the estimation of model 1 are presented in Table 2. The nonstationarity suggests that all the nominal price time series but Mexico and Buenos Aires need one difference to be stationary.
We also use univariate analysis of log relative prices to test the LOP.Footnote 77 The empirical identification for the log relative prices,= ln(Pit) – ln(Pjt) leads to the model

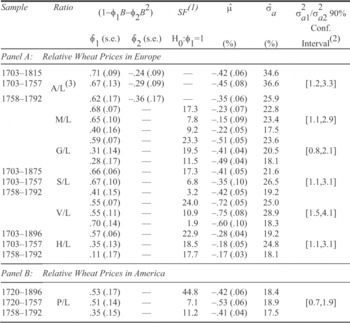
where again ξt represents a sum of intervention terms, μ measures the log nominal price gap, and Nt is the demeaned and log relative price corrected for interventions that follows a AR(1) stationary process.Footnote 78Table 3 shows the parameters estimated for the log relative prices with London as numéraire, as London is assumed to be the link between Europe and British North America. In robustness exercises, the analysis was replicated for every pairwise combination. Our conclusions are not sensitive to the reference market chosen.
COMMON UNIVARIATE RESIDUAL EXTREME VALUES AND POSSIBLE HISTORICAL EXPLANATION, 1703–1815

COMMON UNIVARIATE RESIDUAL EXTREME VALUES AND POSSIBLE HISTORICAL EXPLANATION, 1703–1815

Notes:
I+ number. There is a positive influential impulse intervention term at this date in this series (I- for negative) with the estimated irate of increment (decrement) expressed as a percentage (%), ++ stands for positive residuals with an absolute value greater than two standard deviations and + between one and two standard deviations (–, - for negative values). This table provides a benchmark for coincidences in extreme values that might reveal how prices are related. Some extreme values that are not common are not reported.
EMPIRICAL FINDINGS
The results of our econometric analysis show increasing integration over the eighteenth and nineteenth centuries, with some setbacks between the European and North American markets. The results for Mexico and Argentina are quite different and are discussed separately.
Europe and North America
The statistical analysis of the log relative prices between each pair of cities reveals four main arguments in favor of increasing market integration during the eighteenth century.
First, the null hypothesis of nonstationarity of the log relative prices is clearly rejected. The Shin-Fuller statistic is greater than the critical value of nonstationarity at the 5 percent level (1.7), with values ranging from 1.9 to 44.8 in Table 3. This implies a cointegration relationship with a cointegrating parameter equal to −1 between the natural log of nominal wheat prices in each pair of cities. Therefore, the nominal prices in these city pairs operate according to the LOP.
Second, the cycles found in each city's log nominal price time series are no longer present when the log of the relative price is modeled. Notice that the cycles are represented by the second order autoregressive process for price levels in equation 1 and Table 2, and the cycles are no longer identified in equation 2 and Table 3 for relative prices. These results suggest the existence of common cycles between nominal wheat prices for nearly every market. Arévalo is the only market for which common price cycles with other markets are not found, as the second- order autoregressive is still visible for the Arévalo/London price ratio in Table 3. This might be caused by Arévalo's idiosyncratic distance from the coast and lack of waterways.
Third, the first-order autoregressive parameter, in Table 3, is larger during the period 1703–1757 than the period 1758–1792 for all of the market pairs, except London and Vienna. For example, the autoregressive parameter for the Milan/London log price ratio falls from 0.65 in the earlier period to 0.40 in the later period. A higher autoregressive parameter in the first period implies that following a shock, the relative prices take longer to return to their constant long-term mean between 1703 and 1757 than they did between 1758 and 1792. Thus, there were fewer opportunities to make profits through arbitrage between markets in the later than in the earlier period.
ESTIMATED UNIVARIATE MODELS OF FIRST LOG DIFFERENCES OF WHEAT PRICE SERIES

* Does not reject the GLR null hypothesis at the 5 percent level.
Notes:
(1) Period of the cycle related to the second-order autoregressive, calculated as  (2) Generalized Likelihood Ratio (GLR) test of Davis, Chen, and Dunsmuir, “Inference.” Cut-off values at 10 percent and 5 percent levels are 1.0 and 1.9, respectively.
Fourth, the SDR of the log relative prices is always lower for the period 1758–1792 than the period 1703–1757. The largest drops were the decline from 36.6 to 25.9 for the Arévalo/London pair and the decline from 28.9 to 18.3 for the Vienna/London pair. The 90 percent confidence intervals in the last column of Table 3 show the confidence interval for the ratio of residual variances of the periods 1703–1757 and 1758–1792. Values greater than one for most of the markets paired with London confirm that the residual variance was smaller in the second period than in the first one. The exceptions were the pairings of London with Pennsylvania and Gdansk, which experienced small changes in the SDRs because they had already reached a level of integration from 1703 to 1757 that the remaining markets did not reach until the later period from 1758 to 1792. The SDRs for Gdansk/London fell from 20.5 to 18.1 and for Pennsylvania from 18.9 to 17.5 between the two periods. The next lowest SDR in 1703–1757 was 23.5 for the Milan/London pair. In the later period the SDRs ranged from 17.5 to 25.9.
ESTIMATED UNIVARIATE MODELS FOR RELATIVE PRICES (LOGS) (London as numéraire)

Source:
(1) Shin and Fuller (“Unit Root”) statistic (SF). It tests whether an AR(1) operator is nonstationary. (2) and are, respectively, the residual variances estimated in the period 1703–1757 and 1758–1792. (3) A/L presents an AR(2) with imaginary roots and the unit root SF test is not justified. In this case, we estimate an ARIMA(2,1,1) and we test the null hypothesis of noninvertibility with GLR whose critical values are 1.0 (10%) and 1.9 (5%). GLR value for A/L (period 1703–1815) is 0.0, thus cannot be rejected.
The reductions in the autoregressive parameter and the SDRs imply increasing synchronization of nominal prices. After a shock, the relative prices returned faster to the equilibrium and the magnitude of impact of the shocks on the relative prices decreased. This suggests that the wheat market was more integrated. On the other hand, the cointegration relationships held throughout the century and no evidence of contraction in the gaps between nominal prices was found. Both facts posit that there was no significant nominal price convergence during the eighteenth century.
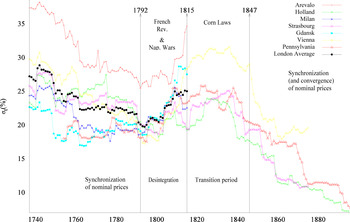
INTRA- AND INTERCONTINENTAL MARKET INTEGRATION, 1737–1896 (London as numéraire)

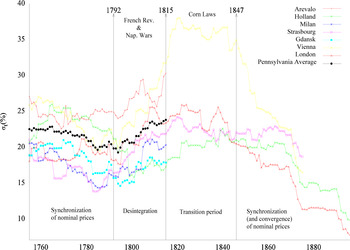
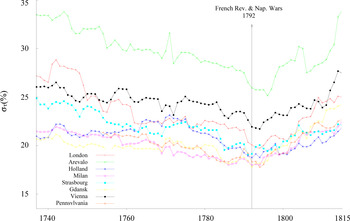
The SDRs during the eighteenth and nineteenth centuries can be seen in Figures 1 and 2. The series in Figure 1 depict the SDRs between every market and London. The series London average is calculated as a simple average in year t of the SDRs for all the seven markets with which it is paired from 1737 to 1815. From 1815 on the SDR of the available pair of markets is also shown. The Holland/London and Pennsylvania/London city-pairs have the lowest SDRs in 1896, displaying the highest level of synchronization of any market pairs in either century.
Between 1737 and 1815 the 35-year SDRs for every market pairing with London show a similar pattern. They were substantially lower in 1780 to 1792 and thus the markets more synchronized than they were prior to 1750. The Seven Years' War and the American Revolutionary War temporarily interrupted the downward trends. From 1792 to 1815, during the French Revolutionary and Napoleonic Wars, the synchronization declined as the SDRs rose sharply for every market. Between 1815 and 1847 the SDRs for the four market pairings with London stay roughly the same until the late 1830s. The SDRs then start a long-term decline that follows the path of globalization originally described by O'Rourke and Williamson. Notice that the disintegration suffered during the Napoleonic Wars was so strong that the degree of synchronization achieved circa 1792 was not reached again until sixty years later when England's Corn Laws were repealed in 1846. Between 1846 and 1896 the SDIs converged quickly to a level of about 7 percent, the maximum degree of integration of the period 1703–1896. Figure 2 shows that a similar picture, albeit with different magnitudes, arises when Pennsylvania is compared with all of the other markets.
In further robustness checks, we have calculated the 35-year SDRs for all 28 market-pairs. In Figure 3, we show the average 35-year SDRs in each year when we use each of the markets as numéraire. This average is calculated in the same way as the London average in Figure 1. As an example, Figure 3 shows the mean of the 35-year SDRs for Arévalo for each year t calculated by averaging the 35-year SDRs for Arevalo's pairings with London, Holland, Strasbourg, Milan, Gdansk, Vienna, and Pennsylvania in year t. Figure 3 ends in 1815, the last year available for the shortest series.
No matter which numéraire is chosen, there is a clear decline in the SDRs from 1737 to 1792 and hence greater synchronization between all those markets. This is the main contribution of the article and the fundamental statistical support for our hypothesis of an early rise of globalization in the West. By 1790 synchronization had improved and therefore market integration had increased, not only between Pennsylvania and London but also within Europe and between the Continent and North America.
This statistical evidence offers an alternative view on the historical process of globalization. In spite of the alleged obstacles to intra- and intercontinental market integration, by the mid eighteenth century some western markets—not only in the Baltic and the North Seas but also in British North America, Central Europe, and the Mediterranean—had already reached a significant level of integration. Confirming previous works by Van Tieholf, Jacks, and Van Bochove, the Baltic and Holland had reached a high degree of integration earlier than other European regions.Footnote 79 Surprisingly, Milan was also relatively well-integrated already at the end of the first half of the eighteenth century. In contrast, Arévalo remained as a less integrated market during the whole period. Even though Pennsylania was across the Atlantic, it appears to be more synchronized on average with other European markets than Arévalo, Holland, and Vienna between the mid-1760s and 1780s. This fact gives an intercontinental character to this early process of market integration since it allows for extending the geographical influence of the “long American grain invasion of Britain” to the Continent.Footnote 80 Thus, in our view, the potential for globalization in the eighteenth century seems to have not been fully exploited rather than being “constantly frustrated by mercantilist policies and warfare,” as is claimed by O'Rourke.Footnote 81
INTRA- AND INTERCONTINENTAL MARKET INTEGRATION, 1754–1896 (Pennsylvania as numéraire)

INTRA- AND INTERCONTINENTAL MARKET INTEGRATION, 1737–1815 (average of any market with the others, no numéraire)

Consistent with O'Rourke's findings, on the other hand, all markets unequivocally experienced a substantial decrease in integration during the late eighteenth and early nineteenth centuries. The “return to normality” after 1815 proved to be not much easier than after the First World War. Integration, despite substantial improvements in communication and transportation techniques, remained at pre-1792 levels during most of the “transition period” (1816–1846). Quoting O'Rourke, “the disintegrating effects of war were propagated through domestic political processes.”Footnote 82 The British Corn Laws and the prohibition of grain imports in Spain adopted by the liberals in 1820 are cases in point.Footnote 83 Not until circa 1840 did intra- and intercontinental integration resume. This finding is consistent with the canonical version on globalization and later qualifications. Thus, in the second half of the nineteenth century, globalization—convergence of prices included—reached an unprecedented level.Footnote 84
Mexico and Argentina
The two areas that did not join the eighteenth-century rise in synchronization were Mexico and Argentina. Neither exports nor imports of wheat were allowed in Buenos Aires before 1813.Footnote 85 Only small amounts of wheat were occasionally permitted to cross the Río de la Plata in order to feed the military garrison in the sparsely populated area of what today is Uruguay. Thus, by regulation Buenos Aires was practically a closed market. The peculiarities of the price series for Buenos Aires are revealed by our econometric results in Panel B in Table 2. As the GLR test in Table 2 shows, nominal prices in Buenos Aires are stationary and Buenos Aires was not integrated with other markets. Besides, the values of and imply that Buenos Aires did not experience cycles, as opposed to what happened in the rest of markets except for Mexico.
As to Mexico, some nontrivial similarities with Buenos Aires are observed. We have not found any reference in the literature to imports of grain whatsoever. Mexico seems to have been self-sufficient in wheat.Footnote 86 This idea is consistent with the stationarity of the Mexican nominal price series seen in Table 2. As in the case of Buenos Aires, the Mexican series does not fulfill the first necessary condition for a market to be integrated with others. Neither series presents the cyclical behavior that we find in Europe and North America.
FINAL REMARKS
This article makes methodological and historical contributions to the study of globalization. Our methodology is based on the Law of One Price. The analysis focuses on the dispersion of the shocks in the relative price. It provides a measure of market synchronization that can be used along with measures of market integration to make comparisons over time and space.
If O'Rourke and Williamson's definition of globalization as international commodity market integration is accepted, we can conclude that the beginning of globalization is perceptible several decades before the start of the canonical period. It began as commodity price synchronization between distant markets in the eighteenth century. After periods of disintegration (1792–1815) and transition (1815–1846), commodity price convergence is also found. This view may be considered a partial revision of the standard version of globalization since it emphasizes an earlier origin, a nonexplosive initial development, a longer duration, and a non-monotonic evolution over almost two centuries from the first half of the eighteenth century to 1913.
Our results offer a broader perspective on the complexity of the historical process of globalization across centuries and continents. They may cast some shade of doubt over the distinction between “soft” and “hard” globalization. The latter overlapped and coexisted with the former instead of simply following it at some point in the nineteenth century. Therefore, we agree with Klas Rönnbäck that “the issue of an ‘early globalization' cannot be dismissed as easily as has often been done so far.”Footnote 87
We are well aware that the economic consequences in terms of mobility and prices of goods, services, and production factors in the early phase of globalization were of lesser importance than in the canonical period. However, its real dimensions have been overlooked so far in the relevant literature.
Our results do not contradict the findings of Daron Acemoglu, Simon Johnson, and James Robinson in that an important role is given to the Atlantic trade and related institutions and the policies that favored the Industrial Revolution.Footnote 88 However, they diverge from Shiue and Keller's findings because we find substantial progress in market integration before the industrialization.Footnote 89 Therefore, if properly expanded, our research might contribute to the debate on the “Great Divergence.”Footnote 90
Appendix
Sources of data and methods of conversion from local units into grams of silver per liter are:
Amsterdam and Holland, 1703–1896: Wheat prices in grams of silver per liter from series elaborated by Robert C. Allen and shown in the section “Europe” of the International Institute for Social History's web page (http://www.nuff.ox.ac.uk/users/allen/studer/amsterdam.xls). From 1703 to 1819 and from 1867–1896 prices are from Utrecht/Groningen and from Amsterdam in 1820–1866. Missing observations are 1771, 1802/03, 1822/23, and 1826/27. In these and all cases, missing observations have been estimated through state-space algorithms.
Arévalo, 1703–1815: Wheat prices in reales de vellón per fanega from Llopis and Jerez, “El mercado.” Conversions of Spanish units into grams of silver per liter: 1 fanega = 55.5 liters; reales de vellón converted into grams of silver at rates of exchange from Hamilton, “Wheat, War.” From 1801 onwards, the exchange rate vellón/silver in 1801–1815 is assumed to be that of 1800.
Buenos Aires, 1719–1800: Wheat prices are assumed to be originally expressed in reales de vellón per fanega. Conversions of Spanish units into grams of silver per liter: 1 fanega = 55.5 liters; reales de vellón converted into grams of silver at rates of exchange from Hamilton, “Wheat, War.” Otherwise they would be the highest wheat prices on earth, which is difficult to accept. In any case, cointegration is not affected by the prive level. Missing observations are 1724, 1726, 1729, and 1731. Source is the series elaborated by Martín Cuesta and Leticia Arroya and shown in the section “Buenos Aires, Argentina, 1700–1800” of the Global Price and Income History Group' web page (http://gpih.ucdavis.edu/Datafilelist.htm#Latam).
Gdansk, 1703–1815: Wheat prices in grams of silver per liter from series elaborated by Allen and shown in the section “Europe” of the International Institute for Social History's web page (http://www.nuff.ox.ac.uk/users/allen/studer/gdansk.xls).
London and Sothern England, 1703–1896: Wheat prices in grams of silver per liter from series elaborated by Allen and shown in the section “Europe” of the International Institute for Social History's web page (http://www.nuff.ox.ac.uk/users/allen/studer/london.xls).
Milan, 1703–1815: Wheat prices in grams of silver per liter from series elaborated by Allen and shown in the section “Europe” of the International Institute for Social History's web page (http://www.nuff.ox.ac.uk/users/allen/studer/Northern%20Italy.xls). Missing observations are 1805–1807.
Pennsylvania, 1720–1896: Wheat prices in grams of silver per kilo from the series elaborated by Peter Lindert, Salvador Puente, Will Ambrosini, and Leticia Arroyo and shown in the section “Pennsylvania spliced series, 1720–1896” of the Global Price and Income History Group' web page (http://gpih.ucdavis.edu/files/Penn_spliced_1720–1896.xls). The kilo/liter ratio used is 0.772 (http://gpih.ucdavis.edu/files/Weight_vs_volume.xls).
Strasbourg, 1703–1875: Wheat prices in grams of silver per liter from the series elaborated by Allen and shown in the section “Europe” of the International Institute for Social History's web page (http://www.nuff.ox.ac.uk/users/Allen/studer/strasbourg.xls). Missing observations are 1794/95.
Vienna, 1703–1875: Wheat prices in grams of silver per liter from the series elaborated by Allen and shown in the section “Europe” of the International Institute for Social History's web page (http://www.nuff.ox.ac.uk/users/allen/studer/vienna.xls).
Upper Bajío, 1703–1804: Wheat prices in silver reales per carga from Garner (Economic Growth). Conversion of colonial units into grams of silver per liter: 1 carga = 149.578 kilos (Florescano, Precios). Content in silver grams of the real taken from Burzio (1956–1958). The kilo/liter ratio used is 0.772. (http://gpih.ucdavis.edu/files/Weight_vs_volume.xls). Missing observations are 1791–1795.
PRICE OF WHEAT (LOGS) IN THE AMERICAS AND LONDON AND STANDARDIZED RELATIVE PAIRWISE PRICE

WHEAT PRICE (LOGS) IN THE EUROPEAN CONTINENT AND LONDON AND STANDARDIZED RELATIVE PRICE PAIRWISE