INTRODUCTION
When building predictive models for use in daily decision support systems, model selection can be problematic because the variable of interest, future model performance, is never available when model selection is performed (Kunst Reference Kunst2008). These difficulties are only amplified when dealing with spatially and temporally auto-correlated data such as weather data. Agroecosystem decision support systems typically rely on some types of weather data and forecast quality affects the economic livelihood of individuals as well as the quality of the food supply. The availability and quality of digital weather forecasting datasets have increased dramatically in recent years. For those with a goal of consistently submitting crop disease forecasting model output to growers for use in daily decision making, the quickening pace of turnover in weather data sources is daunting (Baker et al. Reference Baker, Lake, Roehsner and Schrantz2012). Growers have been advocates for the increasing number of early warning systems for crop disease risk that integrate with crop-specific decision support systems (Roberts et al. Reference Roberts, Schimmelpfennig, Ashley, Livingston, Ash and Vasavada2005) as regional weather patterns have recently deviated from climate norms, confounding the expectations of even the most experienced growers.
The current analysis compares two weather-based forecasting models for predicting potato late blight risk 5 days in advance, NWN07 and 10-year hourly optimized model (THOM). Potato late blight (Phytophthora infestans) damages foliage and tubers and is the most limiting factor to profitable potato production in the USA (Guenthner et al. Reference Guenthner, Michael and Nolte2001). Environmental conditions during the growing season in the North Central Region of the USA, including Michigan, are sporadically but frequently conducive to development of epidemics of potato late blight and significant financial costs, in terms of crop protection (up to US$700/ha) and crop losses (up to US$5000/ha), are incurred when intervention measures to control potato late blight are unsuccessful (Guenthner et al. Reference Guenthner, Michael and Nolte2001). In addition, from 1950 to the present, climatic conditions in this region have been becoming steadily more conducive for the initiation and development of potato late blight outbreaks (Baker et al. Reference Baker, Kirk, Andresen and Stein2004), making accurate early warning systems critical for management (Baker & Kirk Reference Baker and Kirk2007).
Of the two forecast models compared, the earlier model (NWN07) is an artificial neural network (ANN) model developed at point locations in Michigan in 2007 (Baker & Kirk Reference Baker and Kirk2007). The original approach to using weather forecasts for disease risk prediction were novel since such model development was not possible before National Weather Service (NWS) improvements in 2004 and the accumulation of a data archive allowing for sufficient analysis (3–5 years). In the time since the initial model development, much has been learned about using the weather service point data forecasts as part of the ANN crop-specific risk models.
Although new datasets and capabilities have come online in the intervening years, confidence in the ability of the models introduced by Baker & Kirk (Reference Baker and Kirk2007) to achieve the quality results in growing seasons that run the spectrum of weather variability in this region is only felt now, after 10 years of continuous data availability. Over the 10-year period, extremely wet conditions (up to 35% above normal, in Southwest Michigan) and extremely dry conditions (up to 21% below normal, in Northern Michigan) have both occurred during the growing season (SRCC 2013). The time period also includes the positive, negative and neutral phases of El Nino/Southern Oscillation (COAPS 2009), whereas other oscillations such as Atlantic Multidecadal Oscillation have remained in a single phase for over a decade (NOAA ESRL-PSD 2012). Variability of this extent could not be achieved with typical modelling datasets that often rely on three growing seasons of data. Accuracy of model results has continued to improve significantly, especially on days with weather patterns that are highly conducive to disease. The new THOM has benefitted from advances in technology and increasing archive length (Baker et al. Reference Baker, Lake, Roehsner and Schrantz2012). Accuracy improvements represent greater decision support for potato growers in Michigan, but these improvements also have widespread implications as new datasets come online with limited data archives for model training, testing and validation. Most new datasets used for regional agroecosystem decision support systems are gridded data, making a revisiting of point forecasts seem almost antiquated; however, approaching the previous methods with data of increased archive length is critical to aid the transition to these new datasets. Point forecasts (e.g. model output statistics (MOS) products) will always be needed as they are the locations verified with real observations during NWS forecast development, but gridded models in areas of high agricultural productivity can also be verified at state or local automated weather network sites during model development. The objective of this study was to compare the accuracy of predictions made using the NWN07 model with the accuracy of predictions made using the THOM from 2009 to 2011 at 26 locations in Michigan.
METHODS
Accuracy of predictions made using the NWN07 model were compared with the accuracy of predictions made using THOM over 3 years, 2009–2011, at 26 locations in Michigan. These 3 years were not used in the training of either model.
NWN07 model development
Extended range forecast MOS including 192 h maximum and minimum daily temperatures have been produced by the US NWS since 1994 with the Global Forecast System (GFS) numerical model (Carroll & Maloney Reference Carroll and Maloney2004). After 2003, improvements to NWS forecasting accuracy dramatically improved the usefulness of this data for agricultural and environmental modelling (Carroll & Maloney Reference Carroll and Maloney2004). Baker & Kirk (Reference Baker and Kirk2007) developed a method to derive hourly microclimate variables associated with potato late blight risk from the available MOS produced by the NWS. The ANN version of this method yielded consistently higher accuracies up to 5 days in the future compared with those developed using determinacy analysis, discriminant analysis or logistic regression. A generalized pilot model developed from only 12 stations with long archive records was first assessed for usefulness at a local scale. This generalized pilot model was then expanded for use with 48 stations throughout the state of Michigan and trained using data from the 2003–2005 growing season. The 2006 and 2007 growing seasons were used for model validation. Derived variables are described in a detailed discussion in Baker & Kirk (Reference Baker and Kirk2007).
Accuracy of predictions for all stations and years, as quantified by the simple percentage of days when the forecast was correct versus incorrect during the growing season, was examined through comparison of predicted potato late blight disease severity values with those computed based on the Unedited Local Climatological Data (NCDC 2013). The NWS-produced local climatological dataset consists of hourly, daily and monthly summaries for approximately 1600 US locations. This early model was trained on the unedited version. Subsequent versions have been trained on the quality-controlled local climatological data, available since 2005. A modified Wallin disease severity value (DSV) model (Wallin Reference Wallin1962) has been used consistently to calculate the risk of potato late blight by Michigan State University (MSU) for daily distribution to Michigan potato growers through a web-accessible management recommendation site (MSU 2005). For purposes of the current paper, the MSU model was used without modification. The present paper does not attempt to justify or increase the quality of the current system, but focuses strictly on the integration of NWS predictions within this system's framework. The MSU model was simplified to a Boolean scale from the more typical Wallin-type risk scale from 0, no risk, to 4, high risk. The relative infrequency of high risk days in this region makes it impractical to create a model that predicts individual DSV day types separately. Days with high late blight risk are typically associated with precipitation events that are difficult to predict, particularly in areas such as Michigan where lake-effect storms can arise quickly and produce scattered precipitation. In the simplified system, days were considered to be risk days for potato late blight infection if relative humidity remained above 80% during specific hours when temperatures remained between 7·2 and 11·7 °C for more than 16 h, between 11·7 and 15·0 °C for more than 13 h, or between 15·0 and 27·0 °C for more than 10 h (MSU 2005). All other days were considered non-risk days. Hourly values for both relative humidity and temperature were taken directly from the NCDC local climatological data.
The accuracy of these forecasts (81%) was significantly higher than expected values based on climate norms (72%) and the model was deemed successful enough to be used by growers in real world situations. The model was implemented for a test set of 26 stations through web-based delivery for public use by Michigan potato growers beginning with the 2008 growing season as part of the USDA NC-IPM grant (Wharton et al. Reference Wharton, Kirk, Baker and Duynslager2008).
Ten-year hourly optimized model development
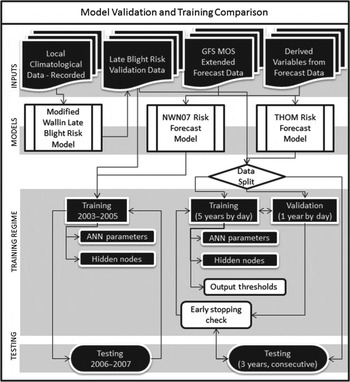
The THOM model was developed using a more detailed training, validation and testing procedure (Fig. 1). The early ANN model used 48 inputs, ten hidden nodes and one output (Baker & Kirk Reference Baker and Kirk2007), but through analysis of input combinations a more parsimonious model was achieved. Although several limited variable sets succeeded at decreasing the number of input variables needed without dramatically decreasing overall accuracy, none of the variable sets was usefully accurate on days conducive to disease development. Since only about 28% of days are conducive to disease in the region, it became clear that low accuracy on these days was likely to be the result of class imbalance combined with over-fitting.
Comparison of Modified Wallin, NWN07 and 10-year hourly optimized (THOM) models. Training, validation and testing of the THOM model followed a more detailed procedure. Improvements included a three-way data split of a larger data archive, monitoring and selection of appropriate thresholds for model output and checks for early stopping.

Overfitting occurs when a statistical model learns spurious relationships between input and output variables. Artificial neural networks are especially susceptible to this problem since they typically have a large number of free variables and can construct highly nonlinear decision boundaries. In earlier modelling efforts, overfitting had been reduced by using a grid search procedure to select the number of training iterations to be used by observing error reductions and test set performance. However, there are a number of problems with this approach, including: (a) the search procedure is time-consuming; (b) the search procedure would need to be repeated when changes are made to the model or data; and (c) training artificial neural networks with back-propagation is a stochastic process and thus variations in initialization and the order of data presentation from training run to training run may influence optimal training time.
To eliminate the problems outlined above the training procedure was modified to include early stopping (Caruana et al. Reference Caruana, Lawrence and Giles2000). This was done by dividing the available data into three sets: training, validation, and testing, rather than the original method that only used training and testing sets (Fig. 1). While the NWN07 model was trained on full years, the data split for the THOM was random by day for training and validation. Continuous growing seasons were only used in the testing phase of model development to simulate use of the model on complete unknown years after completion. The purpose of the additional validation set is to allow generalization accuracy to be assessed during training over a set of data distinct from that being used to fit model parameters. Then, when performance consistently shows no improvement on the validation set, the training procedure can be terminated. Since the validation set of data is also distinct from the testing set, using it in this manner does not influence the validity of accuracy reports on the testing set.
Two techniques were used to handle the class imbalance problem. First, rather than simply monitoring accuracy during early stopping, the average of accuracy and true positive rate were monitored. This has the effect of allowing the training to explicitly prefer models with a high true positive rate. In other words, a correct forecast on a day with risk was valued more highly than a correct forecast on a day without any late blight risk. Next, the threshold used to transform the probability of risk output by the neural network model into a discrete risk/no-risk value was lowered. This is a simple fix frequently employed in the machine learning community for dealing with class imbalance and was found to compare favourably to more complicated techniques such as up-sampling, down-sampling or reweighting (Japkowicz Reference Japkowicz2000).
Accuracy of predictions between the NWN07 and the THOM were compared using standard daily accuracy of the forecasts as experienced by the grower during the growing seasons 2009–2011. A paired t-test was used to test for significant differences in accuracy across each location and year combination between the models.
RESULTS
Model training
By employing the early stopping method described above it was found that the previously estimated optimal training times were too short. Overall model accuracy was improved by allowing the model to train for many more iterations. Related to the class imbalance problem, it was also found that optimal thresholds describing class membership were too large. Using a lower threshold to transform the probability of risk into a discrete risk/no-risk value typically produced an increase in overall model accuracy. Most important however, it was found that a majority of this increase was obtained by more accurately predicting conditions conducive to disease development when those conditions were truly present.
The THOM incorporates nine variables derived from the extended-range GFS-based MOS guidance alphanumeric message generated by the US National Weather Service, published each day at 00·00 h GMT (Maloney et al. Reference Maloney, Gilbert, Baker and Shafer2010). These daily variables include minimum temperature, cloud cover (am and pm), quantity of precipitation estimates (am and pm) and four variables calculated from the MSU modified-Wallin potato late blight model (MSU 2005). Two of these variables were potato late blight day typing values with values of 0–4. One was calculated assuming no precipitation by using temperature and humidity estimates directly as available in the data; the other artificially inflated relative humidity above 80% throughout the day as a way to simulate the influence of rain on potato canopy conditions. These two variables, used in conjunction, describe the expected range of potato late blight risk in a forecast day. In a similar way, two variables encompassing the range in the number of hours above both the temperature and humidity thresholds during a forecast day, without specifying to which risk type bin those hours were associated, were also used as a complement to the day typing range.
The inclusion of variables calculated both with and without the assumption of precipitation accounts for the range of potato late blight disease risk expected due to the uncertainties associated with precipitation forecasts. The model employed was a standard feed-forward ANN with a single hidden layer consisting of ten units using tanh activation functions. Neural network weights were optimized using the back-propagation algorithm with a learning rate of 0·01 and momentum of 0·1.
Mean accuracies
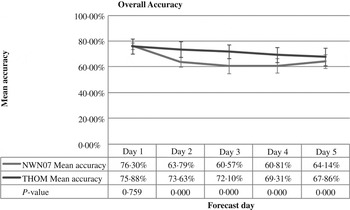
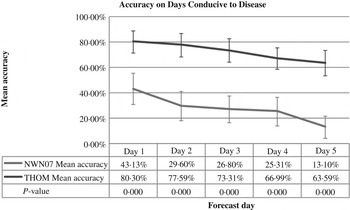
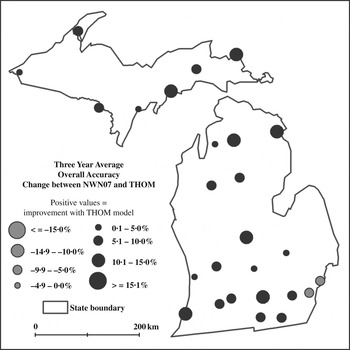
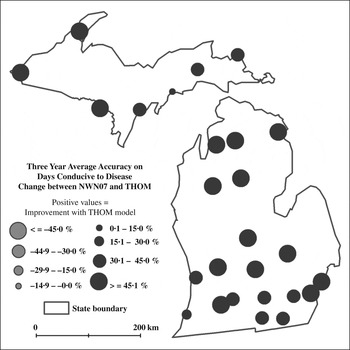
Accuracy values at all stations were averaged to obtain a mean accuracy for each of five forecast days in advance (D1–D5) for all three growing seasons, for both models. Results indicate that while the NWN07 and THOM models were statistically equivalent for the first 24 h forecast (D1), the THOM had significantly higher mean accuracy for all other forecast durations (Fig. 2). The increase in accuracy on days with conditions conducive to disease development was particularly striking. Accuracy on the first forecast day (D1) nearly doubled and by the fifth forecast day more than tripled in forecast quality with the THOM (Fig. 3). When examined spatially, these improvements came primarily in the central and southwest portions of the lower peninsula of Michigan (Figs 4 and 5).
Comparison of overall accuracy by forecast day with paired t-test significance.

Comparison of accuracy by forecast day on days conducive to disease with paired t-test significance.

Three year average change from NWN07 to 10-year hourly optimized model overall accuracy. Range is ±15%.

Three year average change from NWN07 to 10-year hourly optimized model on days conducive to disease. Range is ±45%.

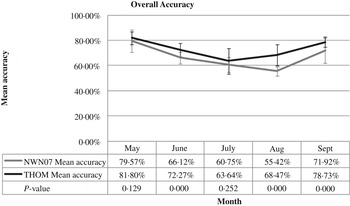
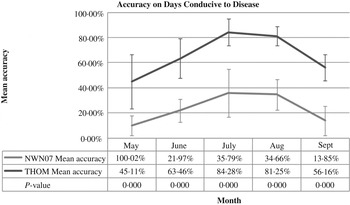
A monthly breakdown of accuracy shows that the THOM is statistically equivalent to the NWN07 model during May and July (Fig. 6). During other months the THOM achieves significantly higher accuracy. When only days conducive to disease development are examined (Fig. 7), the THOM is dramatically more accurate throughout the growing season.
Comparison of overall accuracies by month with paired t-test significance.

Comparison of risk day accuracies by month with paired t-test significance.

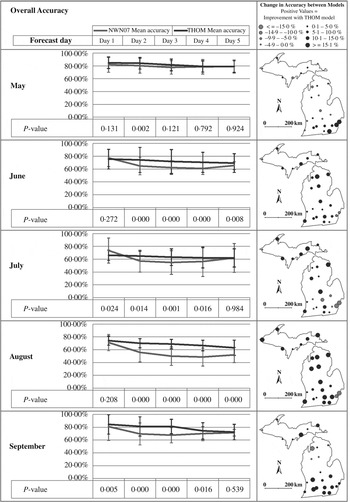
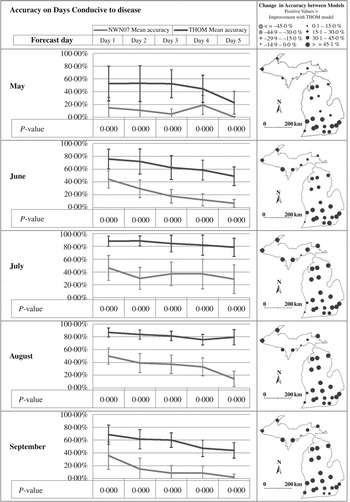
The accuracy of these predictions was further examined by month and forecast day and the two models’ performance were compared using paired t-tests. Regarding overall accuracy, the THOM was generally more accurate, except for May, when the models were generally equal in accuracy. July had the most variation, with the NWN07 model being more accurate on Forecast Day 1, THOM being more accurate on Forecast Days 2, 3, and 4, and the models being equal on Forecast Day 5 (Fig. 8). On days conducive to disease development, the THOM was significantly more accurate for each month on each forecast day (Fig. 9).
Overall accuracy for each month and forecast day with paired t-test significance. Range is ±15%.

Accuracy on days conducive for disease for each month and forecast day with paired t-test significance. Range is ±45%.

DISCUSSION
Potato late blight prediction models have been used to estimate environmental conditions that are favourable for risk of infection and to make appropriate fungicide recommendations for more than 50 years (Wallin & Schuster Reference Wallin and Schuster1960; Wallin Reference Wallin1962; MacKenzie Reference MacKenzie1981). Such models work to limit grower expenditure and reduce the amount of chemical released to the environment whilst achieving optimal control of potato late blight. With the advent of the internet, institutions such as MSU have started to offer growers late blight disease risk management systems via an interactive website. One of the downfalls of these models is that they use weather data that is at best real-time. The incorporation of extended range forecast data into a disease risk system renders these systems even more valuable by providing prediction of risk conditions up to several days in advance of their occurrence.
Improvement in quality of publicly available forecasts in recent years has enabled the development of models specifically designed to utilize such data for the benefit of growers. These benefits are enhanced as the archive length grows, and more of the natural seasonal variability in a particular region can be incorporated into training, validation and testing of new models. A closer look at optimization thresholds and the need for early stopping also enhanced the usability of the THOM, particularly on days that are conducive to potato late blight risk, with respect to the NWN07 model that was developed by the same research team.
The potato industry in Michigan uses the interactive risk management system, including forecasts, to make decisions to bring forward or delay fungicide applications mostly by prediction of days that are non-conducive for late blight spread. The THOM significantly increased accuracy in predicted forecasts of late blight-conducive days in comparison with the current system. Improving the prediction of late blight-conducive days will further enhance integrated disease management strategies for potato late blight control. The Michigan potato industry has now experienced several years of electronically delivered extension information. The industry has reacted positively to this format and future models can be tested with confidence in Michigan. Late blight infections have decreased in Michigan since the adoption of electronic forecasting systems even during the widespread regional outbreaks from 2009 to 2012 (Kirk Reference Kirk2010; USDA 2013). Although this may not be completely due to the adoption of forecasting technology, the integration of such tools into the overall education and management system are essential.
The current research has examined the value of retraining and re-evaluating an operational model in light of new data. Results indicate that this is far from a fruitless exercise. Although potato late blight risk forecast models had been thoroughly trained and had been accessible online for several years in Michigan, dramatic improvements were made when an extended dataset was available for testing and validation and a greater understanding of input variables, gleaned from experience with other similarly structured models in other crops and regions (Bondalapati et al. Reference Bondalapati, Stein and Baker2012), was achieved.
The results are valuable to two groups general of stakeholders. From the perspective of potato growers in the region, improvements are most dramatic on days that are conducive to disease development. Spatially, improvements focus on the central and southern portions of the state where most of Michigan agriculture occurs. Temporally, improvements are greatest during July and August when conditions are most conducive to disease outbreaks. From the perspective of agroecosystem forecasters, this is one of many steps to understanding how an increased archive length can benefit model development.
Global climate change may result in significantly increased risk of late blight epidemics on all continents where potatoes are grown (Hijmans et al. Reference Hijmans, Forbes and Walker2000; Savary et al. Reference Savary, Nelson, Sparks, Willocquet, Hodson, Duveiller, Mahuku, Padgham, Forbes, Pande, Sharma, Garrett, Yuen and Djurle2011). In many areas of the USA, the patterns of rainfall are changing and winters are getting milder, leading to conditions that are more conducive for the initiation and development of potato late blight epidemics (Baker et al. Reference Baker, Kirk, Stein and Andresen2005). This problem may be countered through the use of disease risk forecasting models (Wharton et al. Reference Wharton, Kirk, Baker and Duynslager2008). The improved forecasting model may be deployed as part of more complex decision support systems developed to predict yield losses. Such complex decision support systems often incorporate guidelines which allow choosing good control methods such as the use of healthy seeds, adapted pesticides, cultural practices and biological control agents for potato diseases such as late blight and possibly others such as early blight and botrytis blight. The complexity of the interactions between a pathogen and its host, influenced by biotic and abiotic factors of the environment, make the control of the diseases often very difficult. However, deep knowledge of pathosystems allows setting up integrated pest management systems that facilitate the production of healthy and good quality potatoes.
The use of the online environment for rapid access to updates has been beneficial to growers, but can provide challenges to modellers. Increasing quality and resolution of data does not necessarily increase model output quality if the mathematical distribution or scale of the input variables changes. This experience raises questions about modellers’ ability to maintain stable models in the face of continuous data upgrades that have been the hallmark of the national funding agencies in recent years. Future research should improve our understanding of critical archive length and seasonality that may impact long-term utility of the specific agroecosystem models.