In ancient Sumer, the customary annual interest rate for loans in barley was 33⅓ per cent and 20 per cent in silver. In fifteenth-century Europe, the interest rate still varied significantly, from 5 to 20 per cent, while private usurers could charge over 30 per cent (Homer Reference Homer1977, pp. 29 and 106–7). By the eighteenth century, real interest rates in Western Europe had fallen to 3 to 5 per cent. The long-term fall in interest rates has been seen as a precondition for the rise of capitalist society. The traditional hypothesis is that changes in institutions, especially the rise of banking and improved property rights, lowered the risks involved in lending (North and Weingast Reference North and Weingast1989). Against this view, Gregory Clark (Reference Clark2007, pp. 167–75) argues that risks did not change much up to 1800. For example, death rates of investors were unchanged before the nineteenth century. He also points out that, with interest rates above 10 per cent, default rates could not be as high as 6 to 8 per cent. His major conclusion in A Farewell to Alms is that high interest rates must, instead, be explained by higher time preference rates, which declined in Western Europe after the thirteenth century due to changes in the demographic composition.
One problem with studying interest rates in the pre-industrial period is that sources are ambiguous. For example, in his study of sixteenth- and seventeenth-century Sweden, Eli Heckscher points out that interest rates showed large differences even in the same centre, as a consequence of the underdeveloped financial markets (Heckscher Reference Heckscher1936, pp. 577–81). Considering the large variations in the same centre in the same time period, comparing interest rates across countries and over time could be misleading. It is also difficult to find examples of interest rates reflecting true market conditions, because of various regulations and customs concerning usury, such as interest ceilings.
In the early modern period, different credit instruments were developed based on exchange rate derivatives. Bills of exchange were used to circumvent usury ceilings and hide actual market interest rates. During this period, foreign exchange went through a major transformation, from exchange of coins to exchange by bills (McCusker Reference Mccusker1978, p. 18). The bill of exchange was a written order by a drawer in centre i (say, Stockolm) to a drawee in centre j (say, Amsterdam) to pay money to the payee at a certain date in the currency of centre j, although the bill was normally sold in the currency of centre i. Bills of exchange had different terms to maturity, from a few days (sight bills) to up to six or eight months. The price of bills with longer maturities should normally be lower than sight bills; in theory, the difference should be explained by the prevailing interest rate in centre j ‘according’ to centre i. This bilateral rate is sometimes termed a ‘shadow interest rate’. In a recent study of eighteenth-century markets, Flandreau et al. show that shadow interest rates could be calculated from the foreign exchange, and that a continuous homogenous series can be constructed. As they explain (2009, p. 177), such a rate ‘is not recorded in any periodical or price current' and ‘exists only implicitly in the price at which bankers are prepared to trade domestic balances against foreign time deposits’.
One problem is that the price of the sight bill is not usually equivalent to the spot exchange rate, because it took time to move the bill from one city to another. There was a grace period between the time when the bill was presented and the time when it was paid, which could last up to 12 days (Hayes Reference Hayes1740, p. 307). However, the difference between, say, a two-month and a three-month bill should reflect an annual forward interest rate on a one-month bill, irrespective of the grace period (Shiller and McCulloch Reference Shiller, Mcculloch, Friedman and Hahn1990, p. 632). Estimating implied spot exchange rates of bills (i.e. when the time to maturity is zero and no grace period exists) is not necessary to calculate forward interest rates implicit in bills of different maturities.
Flandreau et al. (Reference Flandreau, Galimard, Jobst, Nogués-Marco, Atack and Neal2009, p. 181) point out that the shadow interest rate should be somewhat higher than the local rate, which they show was the case in the early twentieth century. The shadow interest rate includes additional transaction costs, since the foreign market is located further away than the domestic market. For the period after 1720 up to the French Revolution, they estimate the average annual effective shadow interest rates to be in the range of 3 to 5 per cent.
By investigating a peripheral economy, where the use of bills of exchange was just being introduced on a larger scale, this study sheds light on a relatively underdeveloped credit market in the early modern period. Section I provides full details of the data set used; Section II describes the method used to estimate shadow interest rates; Section III presents and discusses the results. In contrast to earlier findings concerning the eighteenth century, this study finds that during most of the second half of the seventeenth century, bilateral shadow interest rates in Amsterdam, Hamburg and especially Paris, ‘according’ to Stockholm, were very high. Another interesting finding is that shadow interest rates tended to decline during the period. Initially, high interest rates in Sweden reflected the underdeveloped conditions of the foreign exchange markets. In the second half of the seventeenth century, quoting became more regular and bills became standardised, which lowered the perceived risks and also the shadow interest rates. This finding supports an institutional explanation for the decline in interest rates over time.
I
Once a poor, peripheral country in the north, Sweden in the seventeenth century became one of the great powers in Europe, and was drawn into the international payments system. The war efforts and large exports of iron and copper generated an increased use of bills of exchange. Along the model of the Amsterdam Bank, a private bank, Stockholm Banco, was formed in 1657. In 1661, the first notes in Europe were issued by this bank. Due to over-issuing, in 1668 it was nationalised, and transformed into Sveriges Riksbank, the world's oldest central bank. A law concerning bills of exchange came into force in 1671 (Heckscher Reference Heckscher1936).
In this article, a unique data set is used to study exchange rates reported in Stockholm for the period 1660–85. The source consists of two handwritten volumes, covering 1660–9 and 1670–85 respectively. Bills on Amsterdam and Hamburg were the most quoted ones (bills on London became common later in the eighteenth century). This material is of high quality since bills of exchange of various maturities (8 days, 14 days, one month, two months and longer) are reported.Footnote 2 The two volumes, collected by Kammarkollegium (Legal, Financial and Administrative Services Agency) in 1686 and 1691 (both volumes are signed by the same person), are based on records of various brokers in Stockholm, which were obliged to deliver them to the authorities. There does not seem to be any systematic difference between these brokers. One of them, Roloff Cornelisson, provided data for all months in 1660–85. According to Josef Wolontis, who studied various sources on exchange rates and prices in this period, Cornelisson had an authoritative position, since official sources usually referred to his attestations (Wolontis Reference Wolontis1936, pp. 143–4). Quotations were annotated several times a month. Most often, the exact day is also given; occasionally the same exchange rate data is reported for two or three different days (which could also be viewed as daily notations). Unfortunately, the volumes only cover the period 1660–85, and for Sweden, such detailed price differentiation between bills of various maturities is later found only from the mid nineteenth century onwards.
This study uses over 3,000 daily notations of exchange rates on bills of exchange to estimate shadow interest rates. Notations when the exact day is not specified have been excluded, except for bills of longer maturities. As discussed below, a distinction must be made between the parametric (‘population’) shadow interest rate implicit in the pricing of bills of various terms to maturity and the estimators of these rates calculated from the price ratios of such bills. Since exchange rates fluctuated sharply, individual observations, and even the sample mean or median rate if the sample size is small, could deviate significantly from the underlying parametric rate.
During the period studied, the prices of various foreign currencies were expressed in the Swedish currency unit mark kopparmynt (mark copper coin). Five domestic metallic currencies were in use, three based on silver, one on copper and one on gold, with a floating market exchange rate relative to each other. One of the silver currencies, the Swedish riksdaler, mainly functioned in international trade, and had a value roughly equal to the German reichstaler. The mark kopparmynt functioned as a unit for the copper currency, while the three silver currencies were paid premiums relative to their pars with the copper currency.
The source of the present study does not specify exactly which foreign currencies are quoted, but only the foreign centre quoted (Hamburg, Amsterdam, Paris and Gdańsk, respectively). However, this information can be inferred by observing how various foreign currencies were quoted in other European cities. Internationally, the exchange rates on Amsterdam and Hamburg could be quoted in two different currencies, in actual coins, termed current money (courant), or in bank money (banco) (McCusker Reference Mccusker1978, pp. 42–79). In Sweden, the quoted currency unit on Amsterdam was the rijksdaalder courant, while the quoted unit on Hamburg was the reichstaler banco (Attman Reference Attman1983, p. 8). The reichstaler banco was considered to contain around 25.3 grams of fine silver (Heckscher Reference Heckscher and Van Dillen1934, p. 194; Shaw 1895, p. 387), about the same as the Swedish riksdaler, while the fine silver content of the rijksdaalder courant was somewhat lower (Shaw 1895, pp. 350–5; Posthumus Reference Posthumus1946, pp. cviii–cix). The exchange rate on Paris was most likely quoted in écu de change, which was the French equivalent of the reichstaler. In Stockholm, bills on Gdańsk were also quoted occasionally, but only one-month bills were sold. Henceforth, no shadow interest rates can be estimated from them.
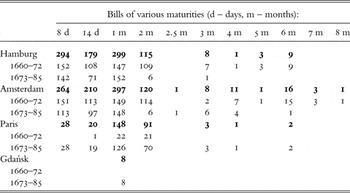
In Stockholm, bills of various maturities were available. Table 1 summarises for how many months in 1660–85 (in total 312 months) various types of bills were available. Hamburg and Amsterdam currencies were traded during all of the months in the period investigated, while the Paris and Gdańsk currencies were traded only in 1668–85 and 1675–81 respectively. For all four currencies, the one-month bills were the most frequent, but for Hamburg and Amsterdam, 8-day bills were almost as common. Bills with maturity longer than two months were quite unusual.
Number of months for which bills of various maturities were quoted in Stockholm, 1660–85
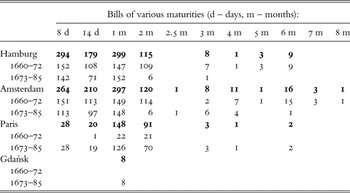
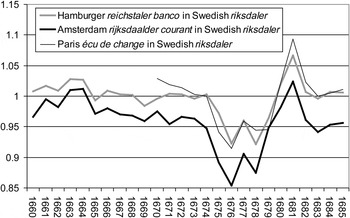
Figure 1 presents the estimated spot rates on the Hamburg reichstaler banco, the Amsterdam rijksdaalder courant and the Paris écu de change in Swedish riksdaler (with stable fine silver content), during the period 1660–85. The par level was one-to-one for the Hamburg reichstaler banco, and 0.96 for the Amsterdam rijksdaalder courant in 1660–81 and 0.95 in 1682–5. These were also the geometric averages for the two currencies based on the estimated spot rates in Figure 1. The coefficient of variation was lowest for Hamburg (at 3 per cent) and highest for Paris (at 4 per cent). However, the high volatility could mostly be explained by the abnormal fluctuations in 1675–81. The low valuations in 1675–9 can be explained by the overvaluation of the Swedish silver coins at that time. The low point of the French and Dutch currencies in 1675 occurred during the Franco-Dutch War (1672–8), which also involved Sweden as one of France's allies.
Hamburger reichstaler banco, Amsterdam rijksdaalder courant and Paris écu de change in Swedish riksdaler, 1660–85 (estimated spot rates)
Note: Spot rates are based on 8-day bills for Amsterdam and Hamburg, and the assumption of a 12-day grace period and 12 per cent annual interest rate (the latter rate is roughly in line with the estimates in Table 4). The spot rates of écu de change are calculated from cross-rates between bills on Paris and Hamburg.

II
To estimate shadow interest rates, the prices of bills are compared for the same time period. Assuming the yield curve (the relation between the interest rate and the time to maturity) on bills in seventeenth-century Stockholm was not flat, the spot exchange rate would be difficult to derive. The estimated interest rates could, instead, be described as forward rates, i.e. future yields based on debt instruments (which must not be confused with the concept of forward exchange rates). Shiller and McCulloch (1990, p. 632) show that one can earn a forward rate by trading bonds (which, according to them, could also be bills) of different maturities, for example, by buying at time t a discount bond maturing at time T at price p d(t, T), and issuing at time t at price p d(t, t′) another bond (of the same fixed payment at maturity) maturing in time t′ (‘d’ stands for discount). The (logarithmic) forward rate f d(t, t′, T) at time t that applies to the time interval t′ to T can then be calculated as:

where time is measured in years.
Using formula (1), the annual effective forward rate (f d(t i, t′ j, T j)in per cent) in per cent applying to the time interval t′ to T in centre j (i.e. Amsterdam, Hamburg or Paris) ‘according’ to centre i (i.e. Stockholm) at time t can similarly be calculated as:

where p d(t i, T j) is the price of a longer bill traded at time t and maturing at time T, while p d(t i, t′ j) is the price of a shorter bill, traded at the same time, but maturing at t′ (t < t′ < T). Both bills are traded in the market i in the currency of i and payable in the foreign centre j in the currency of j. Equation (2) implies that a compound interest rate is calculated. Thus, equation (2) slightly differs from the one used by Flandreau et al. (Reference Flandreau, Galimard, Jobst, Nogués-Marco, Atack and Neal2009).Footnote 3
The calculations in this article are based on logarithmic compounded returns (LN(1 + r/100) as in equation (1), where r is the interest rate in per cent), and the difference between them, although for the convenience of the reader they are converted to percentage points (as in equation (2)). The arithmetic average of logarithmic compounded returns is equivalent to the geometric average of effective rates (expressed as 1 + r/100).
Estimating shadow interest rates from price ratios of short-term bills, for example one-month relative to 14-day bills, is problematic since the prices were rounded off. This could distort the computed interest rate in a systematic way. Unfortunately, notations of bills of two-and-a-half-month and longer maturities are quite rare, especially for the later period. Even two-month bills became less common after 1670. This limits the possibility to investigate a possible decline in the interest rate during the period studied.
The variance of the difference between the natural logarithms of the prices of two bills traded at time t and maturing at times T and t′, respectively, could be expressed as follows:

During 1666–72, when the Swedish currency was very stable, the standard deviation of bills was around 0.3 mark kopparmynt, while the correlation was around +0.75 for most bills of different maturities, but on the same city, sold on the same day, by the same broker. Using formula (3), this would imply a standard deviation of around 0.2 mark kopparmynt, or a coefficient of variation of 1 per cent. Calculating forward rates applying to a time interval of at least one and half months would imply a standard deviation of 8–10 percentage points for the estimated annual rates that were connected directly to the normal fluctuations of the exchange rate. For comparisons of one month difference, it would imply 12–16 percentage points and for half a month, 25–30 percentage points for the estimated annual rates. The rounding off also implies that only certain values could be taken; there would, therefore, not be a normal distribution of the individual estimates of shadow interest rates.Footnote 4 However, the focus of this study is on the sample means, and statistical theory shows that the sampling distribution of sample means converges to normality with as few as 30 cases.
There are also a number of examples displaying anomalies. In July 1676 (on the same day), the broker Roloff Cornelisson sold one-month bills on Amsterdam for 22.5 mark kopparmynt, but 8-day bills for 20.625 mark kopparmynt (however, the same broker sold one-month bills on Hamburg more cheaply than the 8-day bills). Such individual estimates of negative interest rates are produced by the fluctuations in the price of bills, although a real-life consequence was that lending through market operations at the foreign exchange could yield negative returns for shorter periods. There could also be some lags in how various prices were registered, so that some prices actually referred to the previous month. There is also the possibility that the empirical material simply contains some erroneous notations.
The important point is that individual estimates must not be confused with the parametric (‘population’) forward rates, implicit in the pricing of bills. The underlying rate can be revealed by having a sufficiently large number of observations. If the fluctuations are random, and the price difference between the two compared bills is sufficiently large that rounding-off does not have a major impact, the statistical law of large numbers implies that these fluctuations would be evened out.
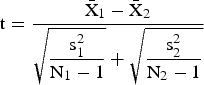
To perform a test in order to assess whether the difference between averages of two samples, 1 and 2, of unequal standard deviation, is significant, the following formula (based on the logarithmic numbers) is used to estimate the t-value (where, in each sample, the  is the average, s the standard deviation, and N the number of cases):
III
Table 2 presents the estimated annual effective forward rates when two bills of various maturities are compared (converted from logarithmic differences to percentage points). To counteract the effects of price differences between brokers and fluctuations during the month, all notations, except for the comparison with bills with more than two months to maturity, are based on transactions performed by the same broker on the same day. Most striking are the high levels of the estimated rates: all sample averages were above 10 per cent. The only comparable known situation in the eighteenth century was the average rate of 9.4 per cent found for bills on Paris sold in London in 1791–5 following the French Revolution (Schubert Reference Schubert1989, p. 4).
The estimated annual forward rates based on the comparisons of bills of various maturities in Stockholm, 1660–85 (logarithms converted to percentage points)
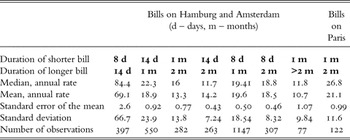
An interesting feature is that forward rates tended to decrease with forward time (i.e. with the time interval t′-t in equation (1)). For Amsterdam and Hamburg bills, the sample average of 8-days-ahead annual forward rate of 6-day bills (14 days minus 8 days, not considering the grace period) was as high as 69.1 per cent; the 14-days-ahead annual forward rate of 16–17-day bills (one month less 14 days) was 18.9 per cent; and the one-month-ahead annual forward rate of one-month bills was 13.3 per cent. Two- or three-months-ahead forward rates were probably even lower. This implies an inverted yield curve, at least for the studied terms. Estimating the term structure is usually based on debt instruments with no or very low default risks, which obviously was not the case for the bills of exchange sold in seventeenth-century Stockholm. If the differences in forward rates reflected risk, the pricing of the bills seemingly implies that there was a significantly higher risk per unit of time during the six days for extra waiting for payment in Amsterdam or Hamburg by buying a 14-day bill instead of an 8-day bill.
The sample average interest rate of 69.1 per cent may seem to be extreme. However, it must be remembered that this is based on only six days difference between two bills. On average, 8-day bills were valued 1 per cent above 14-day bills. This could also reflect pure transaction costs, the effect of rounding-off, or simply the need to differentiate between the prices of the two bills.
While differences between the sample average forward rates on Amsterdam and Hamburg (respectively) were quite small, forward rates calculated from Paris bills deviated substantially from the two latter cities. The sample average forward rate on Paris, calculated by comparing two-month bills with one-month bills, was 21.1 per cent. Compared with the Amsterdam and Hamburg bills, the difference is statistically highly significant.
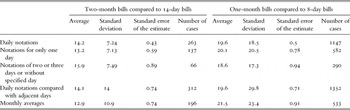
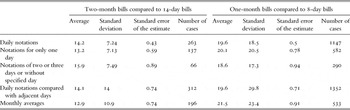
One question is whether the sample average forward rates could be influenced by the method of calculation, and most importantly, whether the sharp exchange rate fluctuations could have any systematic bias. Table 3 presents the average forward rates for Amsterdam and Hamburg according to various methods and series. When two types of recorded notations are compared – that is, notations that are specified for one day and one broker only, and notations that are recorded for two or three days or where no exact day is given (but for the same broker) – there is no significant difference, either in the sample means or sample standard deviations (using formula (4) and Levene's test, respectively). However, when forward rates are calculated from daily notations of bills compared to notations in adjacent days of bills of other maturities or from monthly averages of bills, the standard deviation is at a significantly higher level compared to the daily comparisons; however, the sample means do not deviate significantly. Henceforth, optimally shadow interest rates should be calculated from bills noted the same day, but if this is not possible, the sample means should still be quite reliable.
The sample average annual forward rates according to various methods based on the comparisons of bills of various maturities in Stockholm, 1660–85 (logarithms are converted to percentage points)
High interest rates in seventeenth-century Sweden are known from many other sources. According to Eli Heckscher (Reference Heckscher1936, p. 578), an interest rate of 1 per cent per month was very common in that century (amounting to 12.7 per cent on an annual basis). He also mentions an interest rate as high as 42 per cent in 1631, which is comparable with the high rates found in Stockholm for bills on Paris in the 1670s.
Lower interest rates are also known for Sweden before 1660. In 1600, three different loans given in silver daler (with stable fine silver content) were paid an annual interest of 3.6, 6.7 and 10 per cent, respectively.Footnote 5 In 1604, a loan in the same currency was paid an annual interest of 5.8 per cent.Footnote 6 According to its regulations from the late 1650s, Stockholm Banco loaned at a 6 per cent interest rate for sums of 1,600 mark kopparmynt (the equivalent of 530 daily wages for a manual worker) and above, 8.25 per cent for sums of 400–1,600 mark kopparmynt, and 10.16 per cent for sums below 400 mark kopparmynt (Brisman Reference Brisman1918, p. 22).
Flandreau et al. (Reference Flandreau, Galimard, Jobst, Nogués-Marco, Atack and Neal2009, pp. 174–5) argue that the calculated shadow interest rate from bills on centre j sold in centre i should theoretically be seen as reflecting the interest rate in centre j, not centre i. However, the sample means of the forward rates calculated in this study could be compared to the 3 to 6 per cent interest rate that is reported to have predominated in Amsterdam and 6 to 10 per cent for Paris at the time.
One possibility is that the high shadow interest rates calculated from Swedish foreign exchange rates were a wider European phenomenon at the time, reflecting the fact that risks in foreign exchange were perceived as much larger than local loans with security. The Swedish economic historian Christina Dalhede also gives two examples of short-term interest rates in Lübeck, one of 10 per cent per annum in 1664 on a three-month loan, and one of 12 per cent per annum in 1667 on a 4–12-month loan (Dalhede Reference Dalhede2006, p. 117), which shows that high interest rates also existed in the Lübeck–Hamburg region. In 1601, Gerard de Malynes wrote that while domestic credit in Britain at most yielded a 10 per cent interest rate, investment in foreign bills yielded at least a 15–20 per cent interest rate ‘in regard whereof he is contended to stand in adventure to lose sometimes’ (de Malynes Reference De Malynes1601, p. 120). In 1643–61, the French Crown could pay 15–60 per cent interest on short-term loans. Even in Holland, in 1672, after the French invasion, government securities temporarily yielded 12.5 per cent, which is comparable to the rates calculated from Amsterdam bills sold in Stockholm (Homer Reference Homer1977, p. 128–9).
However, evidence from Amsterdam shows that shadow interest rates calculated from the bills of exchange in the same period as those analysed in this study were as low as those in the eighteenth century. Posthumus published one Price Current of the Amsterdam Exchange from November 1669 (Posthumus Reference Posthumus1946, pp. xx–xxi). Some of the foreign bills sold were of different maturities, which allows for the calculation of forward rates. The annual rate calculated from bills on Hamburg was 4 per cent, on London 6 per cent, on Paris 3 per cent, on Antwerp 4 per cent and on Middleburg 4–5 per cent. The low rate on Paris especially stands out, considering the very high rates on Paris ‘as seen from’ Stockholm and that the local rates were high in Paris as well. The risk of holding bills on Paris must have been perceived as much higher when owning them in Stockholm than in Amsterdam. This clearly shows that, when local interest rates varied considerably, the shadow interest rates also reflected the conditions of the centre where bills were sold.
In a situation of inefficient financial markets or uncertainties, the interest rate could vary significantly. Interest rates calculated from one type of transaction or one location should not necessarily reflect general conditions, but rather, the specific conditions of those types of transactions. Proximity seems to have had an impact for markets that were still not fully developed. Communication time lags were substantial. There were also additional risks since it may have been difficult to enforce agreements made in Stockholm in other European cities.
IV
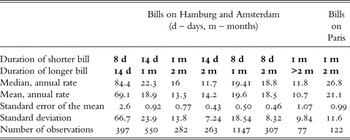
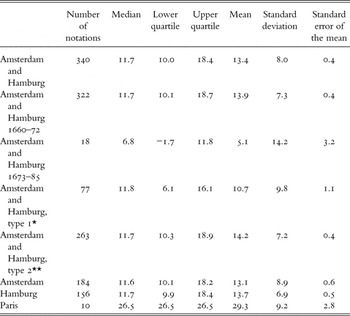
Table 4 presents the average annual forward rates applying to time intervals lasting at least one and a half months. In this way, the effect of rounding-off is minimised. Two types of price ratios are used. For Amsterdam and Hamburg, there are only 77 notations on bills of two-and-a-half to eight-month maturity and for Paris, nine notations. These are compared to one-month bills. In addition, forward rates are also calculated by comparing two-month and 14-day bills when sold by the same broker at the same day. There are 263 such notations that can be observed for Amsterdam and Hamburg, and one for Paris. In this way, forward rates applying to different time intervals are pooled together. In Table 4, the logarithmic compounded returns are converted into percentage points.
Estimated average annual forward rates in Stockholm, 1660–85, based on the comparisons of bills of at least 1.5 months difference in duration (logarithms are converted to percentage points)
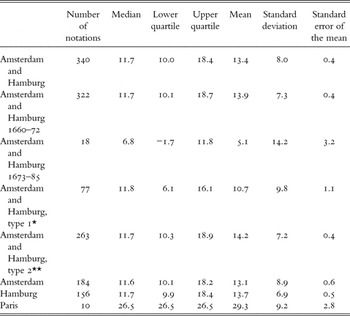
*Type 1: based on comparisons of two-and-a-half to eight-month bills with one-month bills, which could be quoted at different days and by different brokers.
**Type 2: based on the price ratios of two-month to 14-day bills quoted the same day by the same broker.
For Amsterdam and Hamburg, the individual estimates of the forward rates vary between −19.6 per cent and +57.3 per cent. The extreme values can be explained by rounding-off, price differences between various brokers, and the fluctuating prices for the same bill. It must be emphasised that the variations of the individual observations should not be confused with variations in the actual shadow interest rates, which were much lower, but about which our data say nothing.
The median value was 11.7 per cent for Amsterdam and Hamburg. The lower quartile was 10 per cent and the upper quartile 18.4 per cent. The geometric average was higher, at 13.4 per cent, the standard deviation of the sample mean being 0.4 per cent. Thus, Table 4 suggests that the ‘normal’ shadow interest rate was in the double-digit field for the period under investigation.
As shown in Table 4, for Amsterdam and Hamburg, there was a difference between sample averages for different terms. While price ratios of two-month to 14-day bills (type 2 notations) yield an average annual forward rate of 14.2 per cent, the price ratios of bills of two and a half months and longer maturities to one-month bills (type 1 notations) yield an average annual forward rate of 10.7 per cent. This difference is statistically significant at a 5 per cent level (using formula (4)).
The (geometric) sample average rate was 13.1 per cent when estimated from Amsterdam bills and 13.7 per cent when estimated from Hamburg bills, which is a small difference. Using formula (4) implies that the null hypothesis of no difference between Amsterdam and Hamburg cannot be rejected. Henceforth, the risks on both these cities ‘according’ to Stockholm were probably viewed as roughly equivalent.
However, the average forward rates estimated from bills on Paris were much higher, on average, 29.3 per cent, more than twice the average rates on Amsterdam and Hamburg. The difference is highly statistically significant, despite the fact that there are only ten notations on Paris. Comparing the mean for Paris with the mean for Amsterdam and Hamburg, and using formula (4), yields a t-value of 3.9, and p = 0.0001 (two-tailed test). Although it is known that market rates in Paris were higher than in Amsterdam, it is the absolute level that is most striking. The minimum estimate of the interest rate in Paris ‘as seen from’ Stockholm was 17.2 per cent. This is even more surprising when considering that the annual interest rate in Paris ‘as seen from’ Amsterdam was, as discussed above, only 3 per cent in 1669, which was well below the local rate in Paris. The high interest rate ‘as seen from’ Stockholm is only comparable to the conditions in the foreign exchange reported by Gerard de Malynes for the early seventeenth century. Since the exchange rate on Paris was only reported from the late 1660s, the very high bilateral interest rates reflected the underdeveloped financial integration of Stockholm with Paris.
Another interesting result can be noted if we divide the period investigated into two subperiods. For Amsterdam and Hamburg, the average forward rate was 13.9 per cent for the first half, 1660–72, but only 5.1 per cent for the second one, 1673–85, which comes close to the estimates of Flandreau, Galimard, Jobst and Marco for the eighteenth century and the rates in Amsterdam in 1669. The question could be asked whether this can be interpreted as evidence that transition from high to low interest rates was taking place in the Stockholm financial markets. Unfortunately there are only 18 notations for the last period, and the standard error of the mean is quite high, at three percentage points. Using formula (4) yields a t-value of 2.21 for the difference between the two sample means, with p = 0.03 (two-tailed test). Henceforth, while the difference is statistically significant, we cannot be completely assured that the interest rate decreased to the levels of the eighteenth century.
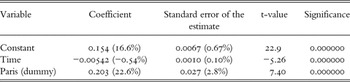
A similar result can be obtained from regression analysis, which is presented in Table 5. The dependent variable is the estimated forward rate measured in natural logarithms (with the equivalent percentage points in parenthesis), where the independent variables are time and a dummy variable with value 1 if the bill was on Paris, and value 0 otherwise. The time is measured in years, and January 1660 is set equal to 0. Both independent variables were highly significant. The regression model of Table 5 shows that there was a highly significant downward trend for the shadow interest rate in 1660–85. On average, the estimated forward rate declined by as much as half a percentage point per year. Other potential independent variables have also been tested, but no statistical significance could be ascertained, which is why they are excluded from the regression. For example, although the Swedish wars increased the forward rate by around one percentage point, this was not statistically significant (the main effect of wars during the periods investigated seems to be a lower exchange rate on foreign currencies, see Figure 1). An Amsterdam or Hamburg dummy also shows no significance, implying that these two cities can, to some extent, be treated together.
Regression where the estimated annual forward rate (based on comparison of bills of at least 1.5 months difference in duration) is the dependent variable (in natural logarithms, and percentage points in parenthesis)
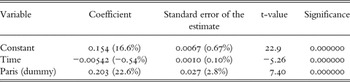
Model summary: R = 0.379; R2 = 0.143; adjusted R2 = 0.138; degrees of freedom: 347; significance: 0.000. Time is measured in years (January 1660 = 0).
Eli Heckscher argues that in Sweden, interest rates fell towards the end of the seventeenth century, and that this was an effect of improved monetary institutions. There is also other empirical evidence that a more homogenised capital market was formed in Sweden in the latter part of the seventeenth century. A legalised maximum interest rate of 8 per cent was introduced in 1666 and 6 per cent in 1687 (Heckscher Reference Heckscher1936, p. 577). Even though interest rate ceilings did disturb the markets, such ceilings partly reflected market conditions as well. However, still in 1690, a published table of interest rates shows that they varied from 5 to 12 per cent, despite the legislated maximum of 6 per cent. Such a large variation is another indication that perceived risks varied significantly between various situations (Heckscher Reference Heckscher1936, pp. 577–81). Lower rates were mostly for loans backed by property and of a somewhat longer duration, involving lower risks.
V
Since notations on bills on Amsterdam and Hamburg of two months or more to maturity are rare from 1673 onwards, the conclusion that there was a decline in the interest rate is uncertain. Since the two most common bills on Amsterdam and Hamburg during the period investigated were the 8-day and one-month bills, respectively, the forward rates estimated from the different pricing of these bills could be of some interest. Furthermore, two-month bills on Paris were quite common also towards the end of the period investigated.
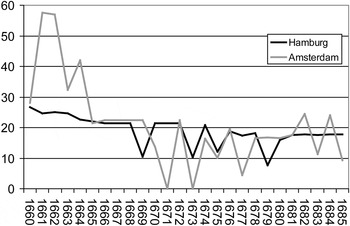
Figure 2 presents the sample median annual forward rates in Amsterdam and Hamburg ‘as seen from’ Stockholm in 1660–85, based on the relative prices of one-month to 8-day bills. It shows that there was a decline through time, which is highly statistically significant. However, the decline can mainly be explained by the extremely high rates in the beginning of the period, roughly 1660–4, when Swedish currencies were also volatile. It was also in this period that the difference between the 8-day and 14-day bills was extremely large. It was the pricing of these short-term bills that became more efficient after 1664, reflecting a certain improvement of foreign exchange in Sweden. A somewhat surprising result is that the rates in Amsterdam ‘as seen from’ Stockholm were not very high in 1675–8, when Sweden and the Netherlands were at war with each other.
Annual median forward rates (in per cent) calculated from the price ratios of one-month to 8-day bills on Hamburg and Amsterdam sold in Stockholm
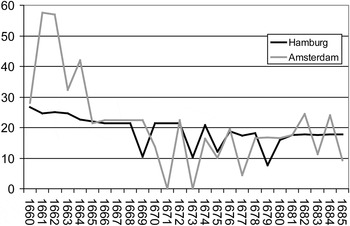
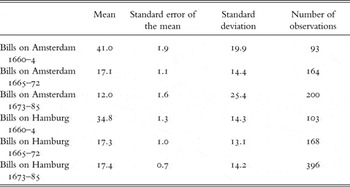
Table 6, presents a comparison of average forward rates for bills on Amsterdam and Hamburg for three periods, 1660–4, 1665–72 and 1673–85 using the same data as for Figure 2. The table shows the extremely high rates for the first period, which was, on average, 41 per cent for bills on Amsterdam and 34.8 per cent for bills on Hamburg. In 1665–72, it declined to 17.1 per cent for Amsterdam and 17.3 per cent for Hamburg. This decline is highly statistically significant. However, in the period 1673–85, the average rate in Amsterdam ‘as seen from’ Stockholm decreased further to 12 per cent (which was barely statistically significant), while the average rate in Hamburg ‘as seen from’ Stockholm basically stayed the same, at 17.4 per cent.
Estimated annual forward rates in Stockholm, 1660–85, calculated from the price ratios of one-month to 8-day bills (logarithms are transformed into percentage points)
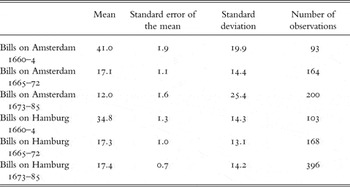
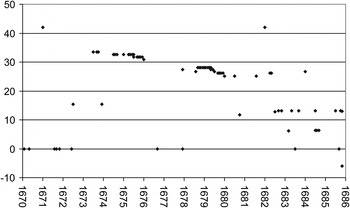
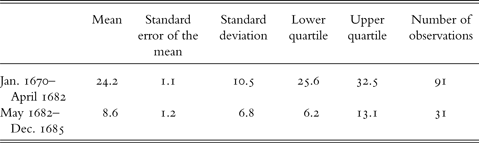
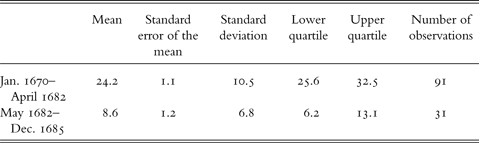
Figure 3 displays the estimated one-month-ahead forward rates in Paris ‘as seen from’ Stockholm, calculated from the price ratios of two-month to one-month bills. It shows that the rates were at a very high level. However, the average rate was evidently at a lower level towards the end of the period, reflecting improved financial integration of Stockholm with Paris. The change could even be dated to May 1682. Table 7 shows that while the average rate was 24.2 per cent before May 1682, it was 8.6 per cent from May 1682 to the end of the period studied. Using formula (4) yields a t-value of 8.42, which is highly significant. The pricing was quite systematic during these two periods. For example, in the period up to April 1682, the lower quartile was 25.6 per cent, and the upper quartile was 32.5 per cent. In the period beginning May 1682, the lower quartile was 6.2 per cent and the upper quartile was 13.1 per cent.
Estimated annual forward rates (in per cent) calculated from the price ratios of two-month to one-month bills on Paris sold in Stockholm

Estimated annual forward rates in Stockholm, 1670–85, calculated from the price ratios of two-month to one-month bills on Paris (logarithms are transformed into percentage points)
VI
The decline in interest rates during the early modern period is of crucial importance for the understanding of the subsequent rise of capitalism. One problem when investigating interest rates is the lack of homogeneous series. During the same time periods and in the same countries, there are numerous examples of very low as well as very high interest rates. Estimating shadow interest rates by comparing foreign exchange bills of various maturities could provide homogeneous series. This article presents a unique data set for the Stockholm exchange in 1660–85, which includes prices of bills of different terms on the cities of Amsterdam, Hamburg and Paris. Three main results can be summarised from this study:
1. The average annual forward rates were very high during the period studied: for most markets segments they were above 10 per cent and for some segments consistently even above 20 per cent. This is in sharp contrast to the estimated shadow interest rates in the range of 3 to 5 per cent during most of the eighteenth century in various European cities, and also the estimated low rates in Amsterdam in 1669. The local rates in Amsterdam and Paris were also much lower than the rates in these cities ‘as seen from’ Stockholm. How do we explain the discrepancy? One important result of this study is that, in underdeveloped financial markets, proximity was of substantial importance when various shadow interest rates were formed. This study shows that the interest rate in centre j (Amsterdam, Hamburg or Paris) ‘according’ to centre i (Stockholm) is also significantly affected by the conditions in centre i, at least when centre i is not well integrated with the global financial markets. Credit in foreign exchange was perceived as quite risky at a time when it was not fully established.
2. There was not one prevalent interest rate in Stockholm, but several. The conditions of ancient Sumer alongside that of modern Europe were present at the same time. The average forward rates implicit in bills on Amsterdam and Hamburg, respectively, were roughly equal, at around 10–15 per cent, while for Paris it was above 20 per cent. The yield curve was inverted at least for the first two months. It must also be considered that low interest rates, at 3 to 5 per cent, were also common in Sweden even before the period studied, alongside much higher rates. The large variation in forward rates for different cities and time periods is an indicator of underdeveloped financial markets. There was no common global rate, as could be found later in the eighteenth century. Whether other European markets at the time were more similar to the developed conditions in Amsterdam or the underdeveloped conditions in Stockholm cannot be answered at this stage.
3. There was a tendency in some segments of foreign exchange for the shadow interest rates, ‘according’ to Stockholm, to decline during the period 1660–85. Such changes in a short period of time provide supporting evidence of the institutional explanation for the decline. Although investigating a 26-year period could hardly account for long-term trends, there is also other empirical evidence of declining interest rates in the second half of the seventeenth century, which was linked to the formation of a banking system and improved payment infrastructures. There is a great need for further studies on this issue before any definite conclusions can be drawn.
Why did arbitrage not eliminate high shadow interest rates, considering that low interest rates existed in various local markets? Theoretically, a trader could buy two-month bills on Paris, retain them for a month and then sell them as one-month bills, earning an annual interest rate of 20–25 per cent from these operations. Alternatively, a trader could buy two-month bills on Paris very cheaply in Stockholm, and sell them at a much higher price in Amsterdam. However, if the transaction costs were even as low as 0.5–1 per cent per sale or purchase, respectively, the profit would be significantly reduced from its initially calculated level. The fluctuations in the market price of bills and slow communications further added to the risk of losing money on such operations, if the possibility of risk spreading was limited. The effectiveness of arbitrage was inversely related to uncertainty (Schubert Reference Schubert1989, p. 7). In fact, arbitrage did lower the shadow interest rates, since the forward rates declined during the course of the period studied. The highest interest rates were probably implicit in bills that were most uncommon in trade. When they became more common, the rates fell.
Theoretically, if there is the possibility of lending and borrowing through the foreign exchange market, the interest rate should be determined by the global rate and the currency risk. However, it is well known that in seventeenth-century Europe, there were significant differences in local rates, which cannot be explained solely by differences in the currency risks. That bills were sold in one location did not necessarily imply that all the sophisticated instruments were available in such locations, which would allow for the use of the foreign exchange to create local loans. Under such circumstances, local rates must also have affected the shadow interest rate where the bills were sold. A more integrated foreign exchange would cause the shadow interest rate to adjust towards the global rate, which, in turn should eliminate the differences between local rates.
Another issue is whether the high interest rates were reflecting risk or whether other factors were contributing to it, such as high time preference rates. However, high default risks were not the only risks involved in lending. High shadow interest rates were also generated by the sharp fluctuations of the exchange rate, which increased the risk involved in lending by buying and selling bills. Creditors were in a precarious situation, because the money that would be returned to them was not necessarily of the same worth in terms of precious metal content as the money that was lent. This was especially problematic for short-term lending, say for a few months. Clipping was a common occurrence. Furthermore, there was risk involved in the postponement of payments, which could have disastrous effects on trade, when other payments had to be made at the same time. Agents had difficulty in estimating actual risks, especially when situated in the periphery of Europe, which further increased the risk premium.
This is linked to the function of money as a standard of deferred payment. Various methods existed to avoid honouring debt obligations. In the marketplace, the seller could refuse to accept certain debased coins, but for a creditor it was not so easy to refuse certain coins when debts were being paid. Postponement of payment to the payee of a bill of exchange when it expired was still very common in the seventeenth century (Heckscher Reference Heckscher1936, p. 625). It was during the seventeenth century that a banking system developed in northern Europe, which was vital for the subsequent decrease in short-term interest rates. Towards the end of this century, it seems, the peripheral financial markets of Stockholm were converging towards the more developed conditions that existed in Amsterdam.