


1 Introduction
A series of laboratory experiments have been conducted to investigate interactions between water waves and thin floating plates, in the so-called scattering regime, where wavelengths and plate lengths are comparable, so that wave propagation and plate dynamics are strongly coupled. A hallmark of the experimental tests has been incident waves spilling onto the upper plate surface, and generating turbulent shallow-water bores (hydraulic jumps) that propagate along the plate surface. The phenomenon is known as overwash, and occurs even for small incident amplitude/steepness, due to the small freeboard of the plates. In the earliest set of experiments, which were analysed by Montiel et al. (Reference Montiel, Bennetts, Squire, Bonnefoy and Ferrant2013a,Reference Montiel, Bonnefoy, Ferrant, Bennetts, Squire and Marsaultb) with a focus on elastic plate responses, a barrier was attached around the perimeter of the plate to prevent overwash, and the resulting wave-induced plate motions were shown to agree with predictions from a linear model. Meylan et al. (Reference Meylan, Bennetts, Cavaliere, Alberello and Toffoli2015) subsequently showed that, perhaps surprisingly, linear model predictions of plate motions are still accurate for a plate with no barrier when overwash occurs, although Bennetts & Williams (Reference Bennetts and Williams2014), McGovern & Bai (Reference McGovern and Bai2014) and Yiew et al. (Reference Yiew, Bennetts, Meylan, French and Thomas2016) found that rigid-body response amplitude operators (RAOs; i.e. rigid-body-mode amplitudes relative to the incident wave amplitude) decrease as the incident wave steepness increases, and attributed this to increasing overwash depths. In comparison, Yiew et al. (Reference Yiew, Bennetts, Meylan, French and Thomas2016) showed that when an edge barrier is used to prevent overwash, RAOs are insensitive to incident steepness.
Bennetts & Williams (Reference Bennetts and Williams2014) studied transmission of regular waves by an array of 40 circular thin wooden plates for small amplitude incident waves over a range of incident wavelengths, and a limited number of larger incident amplitudes. Their results indicated the transmission coefficient (transmitted amplitude relative to the incident amplitude) decreases for increasing wave amplitude in the scattering regime, and they linked it to observations of increased overwash depth for the larger amplitudes. Subsequently, Bennetts et al. (Reference Bennetts, Alberello, Meylan, Cavaliere, Babanin and Toffoli2015) studied transmission of regular waves by a solitary square plastic plate, for a range of incident wavelengths and steepness values, up to storm-like waves with steepness  $k\,a_{inc}=0.15$ (although not reaching the wave-breaking limit). They found the transmitted wave field is regular for low incident steepness, as predicted by linear models, but highly irregular for larger steepness, and, consistent with Bennetts & Williams (Reference Bennetts and Williams2014), showed the transmission coefficient tends to decrease with increasing incident steepness. They related the irregularity and decreasing transmission to increasing overwash depths, which they measured using a wave gauge deployed at the centre of the upper plate surface. Toffoli et al. (Reference Toffoli, Bennetts, Meylan, Cavaliere, Alberello, Elsnab and Monty2015) studied transmission of regular waves by a solitary plastic plate in the simplified, essentially two-dimensional (2-D) setting of a 2 m-wide wave flume, where the plate extends across the breadth of the flume, and is loosely moored to prevent drift down the tank. They showed a linear model accurately predicts transmitted amplitudes for small incident steepness, but increasingly overpredicts them as the incident steepness increases, and correlated the reduced transmission with wave-energy dissipation, which they attributed to wave breaking in deep, energetic overwash when bores generated at the front and rear ends of the plate collide. Nelli et al. (Reference Nelli, Bennetts, Skene, Monty, Lee, Meylan and Toffoli2017) studied an extended dataset to Toffoli et al. (Reference Toffoli, Bennetts, Meylan, Cavaliere, Alberello, Elsnab and Monty2015), containing tests on a plate with an edge barrier, and showed that a linear transmission model accurately predicts transmission coefficients for the plate with a barrier, for all incident steepness values tested, up to
 $k\,a_{inc}=0.15$.
Overwash is a highly nonlinear process; it is not included in linear models (e.g. Meylan & Squire Reference Meylan and Squire1994) or weakly nonlinear models (e.g. Hegarty & Squire Reference Hegarty and Squire2008). However, the occurrence of overwash can be predicted in a straightforward manner from linear model outputs, when the free surface next to a plate end is higher than the plate end. Skene et al. (Reference Skene, Bennetts, Meylan and Toffoli2015) used linear model predictions of the height of the free surface above the plate ends to force a nonlinear shallow-water model of overwash, and showed that the composite linear-potential-flow/nonlinear-shallow-water theory accurately predicts overwash depths from the experiments analysed by Bennetts et al. (Reference Bennetts, Alberello, Meylan, Cavaliere, Babanin and Toffoli2015), up to an incident steepness where wave breaking occurs in the overwash. Skene et al. (Reference Skene, Bennetts, Wright, Meylan and Maki2018) subsequently showed that – for the simplified problem of overwash of a step, where bore collisions do not occur – theoretical-model predictions are accurate in comparison to 2-D numerical simulations based on the two-phase (air/water), incompressible Navier–Stokes equations, for all incident amplitudes tested (maximum steepness  $k\,a_{inc}=0.13$), as long as no-shear boundary conditions are applied on the step surface. Skene et al. (Reference Skene, Bennetts, Meylan and Toffoli2015) did not model the influence of overwash on the surrounding water, so could not predict the decrease in transmission with increasing incident steepness. Orzech et al. (Reference Orzech, Shi, Veeramony, Bateman, Calantoni and Kirby2016) proposed a three-dimensional numerical model of wave transmission through multiple floating plates, based on the single-phase, incompressible Navier–Stokes equations, with the capability of capturing overwash. However, they reported no overwash in their simulations, presumably because they tested wavelengths several times longer than the plates.
In this work, a 2-D numerical, two-phase, incompressible Navier–Stokes model is used to investigate wave transmission by a solitary thin plate in the presence of overwash. Zhao & Hu (Reference Zhao and Hu2012) and Chen et al. (Reference Chen, Taylor, Draper and Wolgamot2019) used laboratory experimental data to validate similar models for the related phenomenon of green water on ship decks, which also involves waves breaking onto the surface of a body and forming shallow-water flows characterised by bores. Here, the experimental tests analysed by Nelli et al. (Reference Nelli, Bennetts, Skene, Monty, Lee, Meylan and Toffoli2017) are simulated numerically, with a thick plate used for the experimental tests where a barrier was attached to the plate edge. Numerical–experimental comparisons are used to validate the model, for the transmitted field and the overwash depth, where the latter uses data from two gauges deployed at the front and rear of the plate in the experiments, which were not reported by Nelli et al. (Reference Nelli, Bennetts, Skene, Monty, Lee, Meylan and Toffoli2017). Numerical outputs are analysed (i) to gain understanding of the influence of overwash on plate motions, and (ii) to identify the sources of wave-energy dissipation during wave–plate interactions, which have not been measured in experiments due to technical difficulties in measuring the relevant quantities.
2 Numerical model
A numerical model is used to simulate wave flume experiments analysed by Nelli et al. (Reference Nelli, Bennetts, Skene, Monty, Lee, Meylan and Toffoli2017), in which regular incident waves interacted with a 1 m long, 1.9 m wide and 0.01 m thick polyvinyl chloride (PVC) plastic plate, loosely moored to the floor of a 2 m wide wave flume. Tests were conducted for three incident periods, giving incident wavelengths comparable to the plate length, and five incident steepness values, ranging from mild to storm like. Each test was conducted three times to assess repeatability, and the tests were also conducted for the plate with an edge barrier to assess the effects of overwash on transmission. The tests are considered as being 2-D, as wave-gauge measurements of both the reflected and transmitted fields were insensitive to location across the flume width, and movies from downward-point cameras mounted above the plate indicate overwash properties are approximately uniform across the plate width (movie S1 is available at https://doi.org/10.1017/jfm.2020.75), notwithstanding small features in the overwash generated at its corners. No effects of occasional collisions between the plate and the flume sidewalls were observed in the measurements.
Schematic (not to scale) of the numerical wave flume with grey box denoting the plate.

Consider a 2-D model flume, as shown in figure 1, of length 40 m, containing water of quiescent depth  $H_{w}=0.9~\text{m}$, density
 $\unicode[STIX]{x1D70C}_{w}=1000~\text{kg}~\text{m}^{-3}$ and dynamic viscosity
 $\unicode[STIX]{x1D707}_{w}=1.00\times 10^{-3}~\text{Pa}~\text{s}$. The flume is bounded at the left-hand end by a piston-type virtual wave maker (different from the elliptic type used in the experiments) and at the right-hand end by a virtual beach (an additional 30 m length of flume in which the mesh gradually coarsens to damp the waves reaching it). A Cartesian coordinate system
 $\boldsymbol{x}=(x,z)^{T}$ defines locations in the flume, where the origin of the vertical coordinate,
 $z=0$, coincides with the undisturbed water surface, and incident waves travel in the positive
 $x$-direction.
In the model, a rigid plate of length  $l=1~\text{m}$ and thickness
 $h$ floats at the surface of the water, with its front (left-hand) end
 $-x_{wm}=29~\text{m}$ from the wave maker and
 $x_{bh}=11~\text{m}$ from the beach (figure 1). The equilibrium plate draft obeys the Archimedean principle, such that its lower surface is
 $z_{L}=-\unicode[STIX]{x1D70C}_{p}\,h/\unicode[STIX]{x1D70C}_{w}$, in which
 $\unicode[STIX]{x1D70C}_{p}$ is the plate density. The plate is free to move in rigid-body heave (up–down translation) and pitch (rotation). Translations in the
 $x$-direction (oscillatory surge and net drift) are omitted, whereas the loose experimental mooring only restricts drift and permits surge.
The wave maker is run at a prescribed frequency and amplitude (i.e. linear signal, mimicking the experiments) to generate regular incident waves of period  $T_{inc}$ and amplitude
 $a_{inc}$. A proportion of the wave is transmitted to the right-hand side of the plate, and a proportion is reflected back towards the wave maker. As will be shown, the remaining proportion of the wave energy is dissipated during the wave–plate interactions. The wave maker runs for long enough to generate ⩾10 wave periods to interact with the plate following the initial transients.
Wave–plate interactions create wave breaking, vortices and air entrainment. Following the green-water studies of Zhao & Hu (Reference Zhao and Hu2012) and Chen et al. (Reference Chen, Taylor, Draper and Wolgamot2019), compressibility of entrained air is considered negligible, noting that compressibility of entrained air is less likely to affect results in the tests considered here, as the incident wave steepness is smaller. Adding compressibility to the model would incur major computational cost (Martnez Ferrer et al. Reference Martnez Ferrer, Causon, Qian, Mingham and Ma2016). Hence, water motions around the plate are modelled using the two-phase, incompressible Navier–Stokes equations
 $$\begin{eqnarray}\displaystyle & \displaystyle \unicode[STIX]{x1D735}\boldsymbol{\cdot }\boldsymbol{u}=0, & \displaystyle\end{eqnarray}$$
 $$\begin{eqnarray}\displaystyle & \displaystyle {\displaystyle \frac{\unicode[STIX]{x2202}(\unicode[STIX]{x1D70C}\,\boldsymbol{u})}{\unicode[STIX]{x2202}t}}+\unicode[STIX]{x1D735}\boldsymbol{\cdot }(\unicode[STIX]{x1D70C}\boldsymbol{u}\,\boldsymbol{u})-\unicode[STIX]{x1D735}\boldsymbol{\cdot }(\unicode[STIX]{x1D707}\,\unicode[STIX]{x1D735}\boldsymbol{u})=-\unicode[STIX]{x1D735}p^{\ast }-gz\unicode[STIX]{x1D735}\unicode[STIX]{x1D70C}+\unicode[STIX]{x1D735}\boldsymbol{u}\boldsymbol{\cdot }\unicode[STIX]{x1D735}\unicode[STIX]{x1D707}+\unicode[STIX]{x1D70E}\,\unicode[STIX]{x1D705}\unicode[STIX]{x1D735}\unicode[STIX]{x1D6FC},\quad & \displaystyle\end{eqnarray}$$
 $$\begin{eqnarray}\displaystyle & \displaystyle \text{and}\quad {\displaystyle \frac{\unicode[STIX]{x2202}\unicode[STIX]{x1D6FC}}{\unicode[STIX]{x2202}t}}+\unicode[STIX]{x1D735}\boldsymbol{\cdot }(\unicode[STIX]{x1D6FC}\boldsymbol{u})=0 & \displaystyle\end{eqnarray}$$
 $$\begin{eqnarray}\unicode[STIX]{x1D6FA}=\{(x,z):x_{wm}<x<x_{bh}\text{ and }-H_{w}<y<H_{a}\}\backslash \unicode[STIX]{x1D6FA}_{p},\end{eqnarray}$$
consisting of the water domain plus air above the water, of equilibrium depth  $H_{a}=0.4~\text{m}$, density
 $\unicode[STIX]{x1D70C}_{a}=1.225~\text{kg}~\text{m}^{-3}$ and dynamic viscosity
 $\unicode[STIX]{x1D707}_{a}=1.80\times 10^{-5}~\text{Pa}~\text{s}$, and where
 $\unicode[STIX]{x1D6FA}_{p}(t)$ is the moving domain occupied by the plate. In (2.1a)–(2.1c),
 $$\begin{eqnarray}\boldsymbol{u}(x,z,t)=\left(\begin{array}{@{}c@{}}u(x,z,t)\\ w(x,z,t)\end{array}\right)\quad \text{is the velocity field,}\end{eqnarray}$$
 $\unicode[STIX]{x1D6FC}(x,z,t)\in [0,1]$ is the local phase fraction of water (
 $\unicode[STIX]{x1D6FC}=0$ denotes pure air and
 $\unicode[STIX]{x1D6FC}=1$ denotes pure water),
 $\unicode[STIX]{x1D70C}(x,z,t)=\unicode[STIX]{x1D6FC}(x,z,t)\,\unicode[STIX]{x1D70C}_{w}+(1-\unicode[STIX]{x1D6FC}(x,z,t))\,\unicode[STIX]{x1D70C}_{a}$ is the fluid density,
 $\unicode[STIX]{x1D707}(x,z,t)=\unicode[STIX]{x1D6FC}(x,z,t)\,\unicode[STIX]{x1D707}_{w}+(1-\unicode[STIX]{x1D6FC}(x,z,t))\,\unicode[STIX]{x1D707}_{a}$ is the fluid viscosity,
 $p^{\ast }(x,z,t)=p(x,z,t)-\unicode[STIX]{x1D70C}(x,z,t)\,g\,z$ is the pseudo-dynamic pressure where
 $p(x,z,t)$ is the pressure,
 $g=9.81~\text{m}~\text{s}^{-2}$ is the constant of gravitational acceleration,
 $\unicode[STIX]{x1D70E}=0.07~\text{Pa}~\text{m}$ is the surface tension coefficient, and
 $$\begin{eqnarray}\unicode[STIX]{x1D705}=\unicode[STIX]{x1D735}\boldsymbol{\cdot }{\displaystyle \frac{\unicode[STIX]{x1D735}\unicode[STIX]{x1D6FC}}{|\unicode[STIX]{x1D735}\unicode[STIX]{x1D6FC}|}}\quad \text{is the interface curvature.}\end{eqnarray}$$
Physically, equation (2.1a) represents conservation of mass, equation (2.1b) conservation of momentum, and (2.1c) phase advection.
The motion of the plate is coupled to the surrounding fluid motion via the no-slip condition
 $$\begin{eqnarray}\boldsymbol{u}(\unicode[STIX]{x1D71E}_{p},t)=\frac{\text{d}\unicode[STIX]{x1D71E}_{p}}{\text{d}t},\end{eqnarray}$$
where  $\unicode[STIX]{x1D71E}_{p}(t)$ denotes the moving plate boundary. The plate and surrounding fluid are also coupled via the dynamic conditions (equations of motion)
 $$\begin{eqnarray}\displaystyle M\,{\displaystyle \frac{\text{d}^{2}Z^{c}}{\text{d}t^{2}}}=-g\,z+\oint _{\unicode[STIX]{x1D71E}_{p}}\left(p\,n_{z}-\unicode[STIX]{x1D707}\left[2\,{\displaystyle \frac{\unicode[STIX]{x2202}w}{\unicode[STIX]{x2202}z}}\,n_{z}+\left(\frac{\unicode[STIX]{x2202}u}{\unicode[STIX]{x2202}z}+{\displaystyle \frac{\unicode[STIX]{x2202}w}{\unicode[STIX]{x2202}x}}\right)\,n_{x}\right]\right)\,\text{d}s, & & \displaystyle\end{eqnarray}$$
 $$\begin{eqnarray}\displaystyle \text{and}\quad I\,{\displaystyle \frac{\text{d}^{2}\unicode[STIX]{x1D703}}{\text{d}t^{2}}} & = & \displaystyle \oint _{\unicode[STIX]{x1D71E}_{p}}(x-X^{c})\left(p\,n_{z}-\unicode[STIX]{x1D707}\,\left[2\,{\displaystyle \frac{\unicode[STIX]{x2202}w}{\unicode[STIX]{x2202}z}}\,n_{z}+\left(\frac{\unicode[STIX]{x2202}u}{\unicode[STIX]{x2202}z}+{\displaystyle \frac{\unicode[STIX]{x2202}w}{\unicode[STIX]{x2202}x}}\right)\,n_{x}\right]\right)\,\text{d}s\nonumber\\ \displaystyle & & \displaystyle -\oint _{\unicode[STIX]{x1D71E}_{p}}(z-Z^{c})\left(p\,n_{x}-\unicode[STIX]{x1D707}\,\left[2\,{\displaystyle \frac{\unicode[STIX]{x2202}u}{\unicode[STIX]{x2202}x}}\,n_{x}+\left(\frac{\unicode[STIX]{x2202}u}{\unicode[STIX]{x2202}z}+{\displaystyle \frac{\unicode[STIX]{x2202}w}{\unicode[STIX]{x2202}x}}\right)\,n_{z}\right]\right)\,\text{d}s.\quad\end{eqnarray}$$
 $$\begin{eqnarray}X^{c}=\text{constant},\end{eqnarray}$$
where  $(x,z)=(X^{c},Z^{c}(t))$ is the location of the plate’s centre of gravity,
 $\unicode[STIX]{x1D703}(t)$ is the pitch angle,
 $\boldsymbol{n}=(n_{x},n_{z})^{T}$ is a unit normal to the plate boundary (pointing into the plate),
 $M=\unicode[STIX]{x1D70C}_{p}\,l\,h$ is the plate mass and
 $I=M\,(h^{2}+l^{2})\,/\,12$ is its moment of inertia.
The open source software IHFOAM (http://ihfoam.ihcantabria.com) is used to solve (2.1a)–(2.1c) plus the boundary conditions (2.5)–(2.7). The software IHFOAM is based on the software OpenFOAM (Higuera et al. Reference Higuera, Lara and Losada2013), and employs a volume of fluid solution method (as in OpenFOAM) on a grid of square cells with side lengths  $\unicode[STIX]{x0394}x=\unicode[STIX]{x0394}z$, and a floating rigid-body motion solver (Urquhart Reference Urquhart2016), with a dynamically coupled deforming mesh solver, involving a toroidal area around the plate in which cells squeeze and stretch into parallelograms in order to accommodate the plate motions (movie S2).
Schematic (not to scale) indicating the free surface elevation  $\unicode[STIX]{x1D702}(x,t)$ and overwash depth
 $h_{ow}(x_{p},t)$ around the moving plate (grey box).

Model outputs for the fluid motion are the velocity field,  $\boldsymbol{u}(\boldsymbol{x},t)$, the pressure field,
 $p(\boldsymbol{x},t)$, and the phase fraction
 $\unicode[STIX]{x1D6FC}(\boldsymbol{x},t)$. In
 $x$-intervals away from the plate, the free surface elevation,
 $z=\unicode[STIX]{x1D702}(x,t)$ (figure 2), is calculated following Deshpande, Anumolu & Trujillo (Reference Deshpande, Anumolu and Trujillo2012) as
 $$\begin{eqnarray}\unicode[STIX]{x1D702}(x,t)=\int _{-H_{w}}^{H_{a}}\unicode[STIX]{x1D6FC}(\boldsymbol{x},t)\,\text{d}z-H_{w}.\end{eqnarray}$$
A transmitted amplitude  $a_{tra}$ is calculated from the elevation
 $\unicode[STIX]{x1D702}$ at
 $x=3~\text{m}$, using a standard zero-crossing method (Emery & Thomson Reference Emery and Thomson2001), i.e. consistent with Nelli et al. (Reference Nelli, Bennetts, Skene, Monty, Lee, Meylan and Toffoli2017). In the plate covered interval, the expression for the free surface is adapted to calculate the overwash depth,
 $h_{ow}(x_{p},t)$, measured normal to the plate surface (figure 2), which is consistent with the experimental measurements discussed in § 1, where
 $x_{p}$ denotes distance along the plate surface (see figure 2), i.e. it is the horizontal coordinate in the frame of reference of the moving plate.
For the plate, the model outputs the vertical motion of the centre of gravity,  $Z^{c}(t)$, and the pitch angle,
 $\unicode[STIX]{x1D703}(t)$, from which the plate boundary
 $\unicode[STIX]{x1D71E}_{p}(t)$ is obtained. They are converted into the RAOs
 $$\begin{eqnarray}\displaystyle & \displaystyle A_{hv}={\displaystyle \frac{|\hat{a}_{h}|}{|\hat{a}|}}\quad \text{for heave,} & \displaystyle\end{eqnarray}$$
 $$\begin{eqnarray}\displaystyle & \displaystyle \text{and}\quad A_{pt}=\frac{\tan (|\hat{a}_{p}|)}{k\,|\hat{a}|}\quad \text{for pitch,} & \displaystyle\end{eqnarray}$$
 $k$ is the (linear) wavenumber, and
 $\hat{a}_{h}$,
 $\hat{a}_{p}$ and
 $\hat{a}$ are complex-valued amplitudes given by the discrete Fourier transforms of
 $Z^{c}$,
 $\unicode[STIX]{x1D703}$ and
 $[\unicode[STIX]{x1D702}_{inc}]_{x=0.5~\text{m}}$, respectively, and evaluated at the incident frequency
 $f=f_{inc}\equiv 1/T_{inc}$, where the surface elevation
 $\unicode[STIX]{x1D702}_{inc}$ is from a simulation without a plate.
The computational cost of IHFOAM is prohibitive, with a single simulation for  $0\leqslant t\leqslant 25~\text{s}$, using cell lengths
 $\unicode[STIX]{x0394}x=1~\text{m},$ and (varying) time steps that ensure the Courant number <1, taking >700 h on 80 parallelised processors. Therefore, as shown in figure 1, IHFOAM is applied only on the subdomain
 $\unicode[STIX]{x1D6FA}_{IHFOAM}=\{\boldsymbol{x}\in \unicode[STIX]{x1D6FA}:x>-3~\text{m}\}\subset \unicode[STIX]{x1D6FA}$, containing the plate. Wave forcing is generated at
 $x=3~\text{m}$, which approximates the incident wave from the wave maker in the flume, i.e. at
 $x=-29~\text{m}$. The approximation is based on nonlinear potential-flow theory, i.e. assuming the water is incompressible, inviscid and undergoing irrotational motions, and a constant atmospheric pressure, and the evolution of the approximate incident wave is calculated numerically using the higher-order spectral (HOS) method, via the HOS numerical wave tank software package (HOS–NWT; Ducrozet et al. Reference Ducrozet, Bonnefoy, Le Touze and Ferrant2012) in a 100 m-long, plate-free flume.
Note that HOS–NWT is run independently from IHFOAM. A discrete Fourier transform is applied to the HOS–NWT surface elevation time series after the incident waves have propagated 26 m (i.e. at  $x=-3~\text{m}$) to obtain the wave spectrum there. It is calculated over 10 wave periods in the steady regime. The spectrum is used as an input for IHFOAM at
 $x=-3~\text{m}$, which includes a numerical wave-maker tool that generates the initial conditions from a list of spectral components. A beach is added for
 $x<-3~\text{m}$, so that reflected waves do not contaminate results. Simulations are run on a high-performance computer, using one processor for HOS–NWT and up to 80 processors for IHFOAM on
 $\unicode[STIX]{x1D6FA}_{IHFOAM}$. The computational time for each simulation is reduced to ≈168 h. The results produced by the modified model were checked against results from the full IHFOAM simulation for the incident wave with period
 $T_{inc}=1~\text{s}$ and steepness
 $k\,a_{inc}=0.10$.
To compare with the laboratory experimental results presented by Nelli et al. (Reference Nelli, Bennetts, Skene, Monty, Lee, Meylan and Toffoli2017), 15 simulations are run, for the three incident wave periods  $T_{inc}=0.8~\text{s}$, 0.9 s and 1 s (with corresponding wavelengths
 $\unicode[STIX]{x1D706}\equiv 2\,\unicode[STIX]{x03C0}/k=1.00~\text{m}$, 1.26 m and 1.56 m, respectively), and incident amplitudes giving steepness values
 $k\,a_{inc}=0.06$, 0.08, 0.10, 0.12 and 0.15. Similarly to the PVC plastic plate used in the laboratory experiments, the plate thickness is set as
 $h=0.01~\text{m}$, and its density as
 $\unicode[STIX]{x1D70C}_{p}=570~\text{kg}~\text{m}^{-3}$, giving a draft of 0.0057 m. For comparison to the experimental tests on the plate with an edge barrier, numerical simulations are also conducted for a plate thick enough that overwash does not occur; the thickness
 $h=0.1~\text{m}$ is used, and its density is set as
 $\unicode[STIX]{x1D70C}_{p}=57~\text{kg}~\text{m}^{-3}$, such that the thin and thick plates have consistent mass and draft.
Horizontal velocity field  $u(x,z,t)$ around (a,c,e) thick plate and (b,d,f) thin plate, created by incident waves with period
 $T_{inc}=0.9~\text{s}$ and steepness (a,b)
 $k\,a_{inc}=0.06$, (c,d) 0.1, and (e,f) 0.15. Results produced by OpenFOAM post-processing tool ParaView. Movies S3–S4 show corresponding simulations.

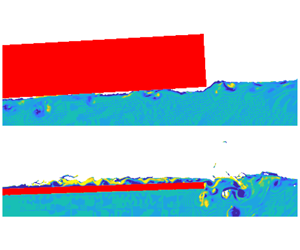
Figure 3 shows typical snapshots of the horizontal velocity around the thick plate (a,c,e) and thin plate (b,d,f) for incident period  $T_{inc}=0.9~\text{s}$ and steepness
 $k\,a_{inc}=0.06$ (a,b), 0.10 (c,d) and 0.15 (e,f). For the thick plate, as the incident steepness increases, large velocity regions begin to form beneath the lower surface of the plate and extend away from the rear plate end, and a small air pocket develops beneath the front plate end. For the thin plate, similar features develop as the incident steepness increases, but with slightly lower velocities beneath the plate, the high-velocity region extending farther away from the rear plate end, and the front-end air pocket slightly larger. Most notably, water is forced onto the upper surface of the plate (overwash). The overwash is forced alternatively at the front and rear plate ends as the plate pitches, as noted previously in laboratory experiments. For the snapshots shown, the pitch is in its phase of positive slope, and the overwash generated at the rear plate end during the negative slope phase is travelling slowly towards the leading end (i.e. in the negative
 $x$-direction). Generally, overwash generated at the leading end is fast moving and shallow, and collides with slower and deeper overwash generated at the trailing end.
Model outputs for different cell lengths  $\unicode[STIX]{x0394}x$, for incident waves with
 $T_{inc}=1~\text{s}$ and
 $k\,a_{inc}=0.15$, and a thin plate. (a) Transmitted free surface elevation time series at
 $x=3~\text{m}$. (b,c) Non-dimensional transmitted amplitude versus cell length, where bullets are mean values and error bars are extrema, with (b) for
 $T_{inc}=1~\text{s}$ and
 $k\,a_{inc}=0.15$ and (c) for
 $T_{inc}=0.9~\text{s}$ and
 $k\,a_{inc}=0.06$. (d) Overwash depth time series at
 $x_{p}=0.1~\text{m}$.

Figure 4 shows model outputs for the thin plate using different cell sizes. Panel (a) shows time series of the transmitted wave elevation at  $x=3~\text{m}$ for the longest and steepest incident wave,
 $T_{inc}=1~\text{s}$ and
 $k\,a_{inc}=0.15$, calculated using
 $\unicode[STIX]{x0394}x=1.5~\text{mm}$ and
 $\unicode[STIX]{x0394}x=1~\text{mm}$. The elevations are virtually indistinguishable, with a maximum absolute difference of <2.2 mm. Panels (b,c) show the non-dimensional transmitted amplitude (steepness),
 $k\,a_{tra}$, for five different cell lengths
 $\unicode[STIX]{x0394}x\in [1~\text{mm},10~\text{mm}]$, and (due to the maximum Courant number) different characteristic time steps (smaller time steps for smaller cell lengths). The incident wave parameters are
 $T_{inc}=1~\text{s}$ and
 $k\,a_{inc}=0.15$ (b) and
 $T_{inc}=0.9~\text{s}$ and
 $k\,a_{inc}=0.06$ (c). The bullets denote the mean values and the error bars denote extrema. The results indicate the cell length
 $\unicode[STIX]{x0394}x=1.5~\text{mm}$ gives four significant figure accuracy for
 $k\,a_{tra}$. Panel (d) shows time series of the overwash depth 0.1 m along the plate surface (
 $x_{p}=0.1~\text{m}$). Differences between the two cell lengths are more evident, with the maximum absolute difference >3.4 mm, and noting that the maximum surface elevation in (a) is more than three times greater than the maximum overwash depth in (b). This is expected because the overwash depth is relatively small, and hence more sensitive to small errors. Nevertheless, the series are similar in terms of period, shape, mean depth and variability of depths.
3 Comparisons with experimental measurements
3.1 Transmitted field
Numerical (blue curves) and experimental (red dotted) transmitted surface elevation time series, for (a) thick plate and (b) thin plate, with incident period  $T_{inc}=0.9~\text{s}$ and steepness
 $k\,a_{inc}=0.12$. Linear model predictions are included for reference (black with circles).

Validations of the numerical model against experimental data are presented for wave period  $T_{inc}=0.9~\text{s}$; the agreement shown is consistent with the other periods tested. Due to background noise in the experimental measurements, following Nelli et al. (Reference Nelli, Bennetts, Skene, Monty, Lee, Meylan and Toffoli2017) the experimental data are filtered to retain only frequencies
 $f\in (0.5\,f_{inc},3.5\,f_{inc})$, and the same filter is applied to the numerical data for consistency. Unfiltered numerical data are analysed in all other sections. Figure 5 shows example transmitted wave surface elevation time series at
 $x=3~\text{m}$ from numerical simulations and measured during the corresponding experiments, for (a) the thick plate and (b) the thin plate, with incident steepness
 $k\,a_{inc}=0.12$. The numerical and experimental time series are aligned with respect to the maximum elevations. The mean differences between the corresponding series are 0.83 mm for the thick plate and 0.81 mm for the thin plate. Predictions given by the linear model of Bennetts, Biggs & Porter (Reference Bennetts, Biggs and Porter2007) are superimposed. They are virtually indistinguishable from the numerical and experimental data for the thick plate, but have higher peaks and lower troughs than the numerical and experimental data for the thin plate.
Non-dimensional transmitted amplitudes versus incident steepness, for (a) thick plate and (b) thin plate, with incident period  $T_{inc}=0.9~\text{s}$, from numerical data (blue) and experimental data (red). Mean values (symbols) and twice the standard deviations (error bars) are shown. Horizontal offsets ±0.002 are included for clarity. Linear model predictions are overlaid (black dashed curves).

Figure 6 shows the mean non-dimensional transmitted amplitudes, as a function of incident steepness. Predictions given by the linear model are superimposed for reference. As shown by Nelli et al. (Reference Nelli, Bennetts, Skene, Monty, Lee, Meylan and Toffoli2017), the linear theory accurately predicts the transmitted amplitudes measured during the experiments for the thick plate, but increasingly overpredicts the transmitted amplitudes as the incident steepness increases for the thin plate. For both the thick and thin plates, the transmitted amplitudes given by the numerical model closely match the amplitudes from the experimental measurements, with mean differences of 0.003 and 0.002, respectively, and with trends for the numerical model amplitudes to be slightly smaller than the experimental measurements for the thick plate, and slightly larger for the thin plate. The error bars indicate twice the standard deviation in the set of 10 amplitudes recorded per test. They are <0.003, indicating only very weak temporal variability in the transmitted amplitudes.
3.2 Overwash
Numerical (blue curves) and experimental (red with dots) overwash depth time series at (a) front end and (b) rear end of the thin plate, with  $T_{inc}=0.9~\text{s}$ and
 $k\,a_{inc}=0.12$.

Figure 7 shows example overwash depth time series close to the front ( $x_{p}=0.1~\text{m}$) and rear (
 $x_{p}=0.9~\text{m}$) ends of the thin plate, for the incident steepness
 $k\,a_{inc}=0.12$. The amplitude and period given by the numerical model closely match the experimental measurements. Notwithstanding the small discrepancies in the series, particularly at the plate rear, the numerical–experimental agreement is pleasing; it is unsurprising that the agreement for the overwash depth is not as good as the corresponding transmitted surface elevation (figure 5b), as the overwash is not a perturbation from the incident wave, and relative measurement errors are greater for the overwash in both the model and experiments.
Overwash depth versus incident steepness at (a) front end and (b) rear end of thin plate, with  $T_{inc}=0.9~\text{s}$, including predictions from theoretical model of Skene et al. (Reference Skene, Bennetts, Meylan and Toffoli2015). Mean values (symbols) and twice the standard deviations (error bars) are shown. Horizontal offsets ±0.002 are included for clarity.

Figure 8 shows the mean overwash depth,  $\langle h_{ow}\rangle$, as a function of incident steepness, where the mean is with respect to time (over a wave period), and averaged over 10 periods. At the front end of the plate, the depths given by the numerical model closely match the experimental measurements (differences <0.57 mm), replicating the increase of overwash depth with increasing incident steepness up to
 $k\,a_{inc}=0.1$, and insensitivity of the depth to incident steepness for
 $k\,a_{inc}\geqslant 0.1$. At the rear end, the numerical–experimental agreement is also good (differences <0.51 mm), except for
 $k\,a_{inc}=0.1$, where the depth measured during the experiments is inconsistent with the otherwise increasing trend of the overwash depth with increasing incident steepness. The anomaly is likely due to sampling error during the experimental test, which is evident in the time series (not shown), and also for
 $k\,a_{inc}=0.08$, resulting in the large standard deviation (error bars). The error bars are <0.25 mm (except for the two anomalous experimental data points), indicating only a small amount of temporal variability in the overwash depth. Predictions from the theoretical model of Skene et al. (Reference Skene, Bennetts, Meylan and Toffoli2015) are superimposed. The theory is only accurate (to within 0.5 mm) for
 $k\,a_{inc}\leqslant 0.08$ at the plate front and for
 $k\,a_{inc}=0.06$ at the plate rear. At the plate front, the theoretical predictions increasingly overpredict mean depths as the incident steepness increases, and at the plate rear the predictions are ≈2–4 mm greater than the numerical and experimental mean values for
 $k\,a_{inc}\geqslant 0.08$. The findings are broadly similar to those made by Skene et al. (Reference Skene, Bennetts, Meylan and Toffoli2015) from theoretical–experimental comparisons.
4 Analysis of numerical simulations
4.1 Plate hydrodynamics
Response amplitude operators versus incident steepness, where  $T_{inc}=0.9~\text{s}$, for (a) heave and (b) pitch, comparing thin plate (green diamonds) and thick plate (purple squares).

Figure 9 shows RAOs (2.9) for (a) heave  $A_{hv}$ and (b) pitch
 $A_{pt}$, as functions of incident steepness, for tests with incident period
 $T_{inc}=0.9~\text{s}$, and both thin and thick plates. The heave RAO tends to decrease with increasing incident steepness for both plates. The decrease is far more pronounced for the thin plate; for example, the decrease from
 $k\,a_{inc}=0.06$ to 0.15 is almost 2.5 times greater for the thin plate than the thick plate. The pitch RAO also tends to decrease with increasing steepness, and the decrease from the smallest to largest steepness is 2.7 times greater for heave than for pitch. However, the decrease for pitch is far milder than for heave.
(a) Mean pitch angle versus incident steepness, comparing thin plate (green diamonds and stems) and thick plate (purple squares and stems), where symbols denote mean values and stems denote twice the standard deviation. (b) Mean overwash depth versus incident steepness for the thin plate. Results are for incident wave period  $T_{inc}=0.9~\text{s}$.

Figure 10(a) shows the time-averaged (over 10 wave periods) mean pitch angle  $\langle \unicode[STIX]{x1D703}\rangle$ as a function of incident steepness, again for tests with incident period
 $T_{inc}=0.9~\text{s}$, and both thin and thick plates. Similar to earlier results, error bars showing twice the standard deviation are included. For the thick plate, the pitch angle is approximately zero,
 $\langle \unicode[STIX]{x1D703}\rangle <0.002~\text{rad}\approx 0.1^{\circ }$, for all incident steepness values tested. In contrast, for the thin plate the pitch angle is only <0.002 rad for the smallest steepness,
 $k\,a_{inc}=0.06$. It jumps to
 $\langle \unicode[STIX]{x1D703}\rangle =0.012~\text{rad}$ for the next largest steepness,
 $k\,a_{inc}=0.08$, and then weakly increases with increasing steepness, reaching
 $\langle \unicode[STIX]{x1D703}\rangle =0.018~\text{rad}~\approx 1^{\circ }$ at the largest steepness,
 $k\,a_{inc}=0.15$. These are significant proportions of the pitch motion, as the maximum pitch angle is 3. 38° for
 $k\,a_{inc}=0.08$, and 5. 72° for
 $k\,a_{inc}=0.15$.
Figure 10(b) shows the corresponding mean overwash depth,  $\langle \langle h_{ow}\rangle \rangle$, as a function of incident steepness for thin plate, where the mean is with respect to both time and space (over the plate surface,
 $0<x_{p}<1$). The behaviour of the overwash depth as a function of steepness closely matches the mean angle for the thin plate shown in figure 10(a): it jumps from
 $h_{ow}\approx 0$ for the smallest steepness to
 $h_{ow}=3.33~\text{mm}$ for the next smallest steepness, and then tends to increase weakly with increasing incident steepness, reaching 5.14 mm at the largest steepness. This indicates the presence of overwash on the thin plate is responsible for the non-zero pitch angle, with deeper overwash at the plate rear (figure 8) resulting in the positive value of the mean angle.
4.2 Energy dissipation
Figure 11 shows snapshots of the vorticity field
 $$\begin{eqnarray}\unicode[STIX]{x1D71B}(x,z,t)=\frac{\unicode[STIX]{x2202}w}{\unicode[STIX]{x2202}x}-\frac{\unicode[STIX]{x2202}u}{\unicode[STIX]{x2202}z},\end{eqnarray}$$
around the thick plate and thin plate, for incident wave period  $T_{inc}=0.9~\text{s}$, and steepness
 $k\,a_{inc}=0.06$ (a,b) and 0.15 (c,d). For the smallest incident steepness, the vorticity is generally weak,
 $|\unicode[STIX]{x1D71B}|<5~\text{Hz}$, with only a few small, isolated vortices shedding from the submerged plate ends (
 $|\unicode[STIX]{x1D71B}|\approx 20~\text{Hz}$), which are most prominent at the rear ends and for the thin plate, where small pockets of air entrainment occur (movie S5). For the larger incident steepness, a large-vorticity layer exists beneath the submerged portion of the thick plate; the vorticity beneath the plate is generated by the front plate end (and to a lesser extent the rear end) moving in and out of the water, and the vorticity propagating along the underside of the plate, together with air pockets (movie S5). The vorticity regions generated at the plate ends also propagate away from the plate to create a thin layer of high vorticity along the free surface, which is stronger in the transmitted region (
 $|\unicode[STIX]{x1D71B}|\approx 20~\text{Hz}$ extending for
 ${\approx}0.25~\text{m}$ in the snapshot shown, but farther in general). The vorticity layer on the left-hand side of the plate is associated with high-order reflected waves generated by the front plate end. For the thin plate, large vorticity values occur throughout the overwash. The overwash exacerbates the complex plate-end phenomenon, particularly at the rear end, resulting in large vortices that are shed away from the plate along the free surface and relatively deep into the water.
Snapshots of vorticity field,  $\unicode[STIX]{x1D71B}(x,z,t)$, around (a,c) thick plate, and (b,d) thin plate, for incident steepness (a,b)
 $k\,a_{inc}=0.06$ and (c,d) 0.15. Results produced by ParaView. Movie S5 shows corresponding simulations.

Schematic (not to scale) indicating the domain decomposition used for energy loss calculations.

Large vorticity regions indicate significant wave-energy dissipation. Functions  $D_{ow}(x_{p})$ and
 $D_{wt}(x)$ are introduced to investigate the vertical branches where energy is dissipated in the overwash region and surrounding water, respectively (see figure 12). They are calculated by (i) vertically integrating the dissipation rate
 $$\begin{eqnarray}\unicode[STIX]{x1D6F7}(x,z,t)=2\,\unicode[STIX]{x1D707}\,e_{xz}^{2},\quad \text{where }e_{xz}(x,z,t)=\frac{1}{2}\,\left(\frac{\unicode[STIX]{x2202}u}{\unicode[STIX]{x2202}z}+\frac{\unicode[STIX]{x2202}w}{\unicode[STIX]{x2202}x}\right)\end{eqnarray}$$
is the off-diagonal component of the deviatoric strain tensor (Batchelor (Reference Batchelor2000), equation (3.4.5)) (ii) temporally integrating over a wave period, (iii) averaging over 10 wave periods, and (iv) normalising with respect to the incident-wave energy,  $E_{inc}$, calculated from simulations without a plate (see below). Mathematically, they are defined via
 $$\begin{eqnarray}D_{\bullet }(x)=\frac{1}{10\,E_{inc}}\int _{0}^{10\,T_{inc}}\int _{z_{a}(\bullet )}^{z_{b}(\bullet )}\unicode[STIX]{x1D6F7}(x,z,t)\,\text{d}z\,\text{d}t,\end{eqnarray}$$
where  $z_{a}$ and
 $z_{b}$ are the upper and lower bounds of the vertical integration. For
 $D_{ow}$, the vertical integration extends from the upper plate surface to the free surface,
 $\unicode[STIX]{x1D702}$ (purple interval in figure 12). For
 $D_{wt}$, the vertical integration extends from the floor,
 $z=-H_{w}$, to either the free surface or, if present, the plate surface (navy and brown intervals in figure 12, respectively). The quantities
 $D_{\bullet }$ have dimension of inverse length, as they do not include horizontal integration, which would introduce unnecessary complexities due to the deforming mesh sizes around the plate. Ad hoc post-processing is used to calculate the energy-dissipation branches,
 $D_{\bullet }$, in which the gradients involved in the strain tensor (4.2) are approximated using finite differences, as
 $$\begin{eqnarray}\frac{\unicode[STIX]{x2202}u}{\unicode[STIX]{x2202}z}\approx \frac{u(x,z+\unicode[STIX]{x0394}z)-u(x,z)}{\unicode[STIX]{x0394}z}\quad \text{and}\quad \frac{\unicode[STIX]{x2202}w}{\unicode[STIX]{x2202}x}\approx \frac{w(x+\unicode[STIX]{x0394}x,z)-w(x,z)}{\unicode[STIX]{x0394}x}.\end{eqnarray}$$
The vertical averaging process misses a small portion of the surrounding water region, as shown in figure 12, although tests (not shown) indicate the missed region only contains a small proportion of the overall energy dissipation.
Vertically integrated dissipation rate in surrounding water for the (a) thick plate and (b) thin plate, and (c) in the overwash for the thin plate for incident period  $T_{inc}=0.9~\text{s}$ and steepness
 $k\,a_{inc}=0.15$, corresponding to figure 11(c,d).

Figure 13 shows  $D_{wt}(x)$ for the thick and thin plates, and
 $D_{ow}(x_{p})$ for the thin plate only. Results are presented for the tests shown in figure 11(c,d), where
 $T_{inc}=0.9~\text{s}$ and
 $k\,a_{inc}=0.15$, i.e. the tests with the greatest energy dissipation. In the surrounding water, energy dissipation spikes at the ends of the plates,
 $x=0$ and
 $l$, with the peak dissipation occurring at the rear plate ends. The dissipation is generally larger for the thin plate than the thick plate, particularly at the rear end, where the thin-plate peak is 2.3 times larger than the thick-plate peak, and large dissipation that extends beyond the plate end, e.g.
 $D_{wt}>0.1~\text{m}^{-1}$ up to 0.1 m beyond the thin plate rear end. In the overwash, dissipation generally increases with distance along the plate, and the values are comparable to those beneath the plate. The pronounced peak in the overwash dissipation just after halfway along the plate is caused by bore collisions at that location, but the peak dissipation in the overwash is less than one-fifth of the peak dissipation in the surrounding water.
Assuming the water far from the plate is irrotational (motivated by its wave-like behaviour there), the unsteady Bernoulli principle applies, and the total energy per unit volume,  $E(\boldsymbol{x},t)$, is given by
 $$\begin{eqnarray}E=\frac{\unicode[STIX]{x1D70C}\,w^{2}}{2}+\unicode[STIX]{x1D70C}\,g\,(z-\unicode[STIX]{x1D702})+P.\end{eqnarray}$$
Thus, the proportions of incident energy reflected and transmitted are, respectively,
 $$\begin{eqnarray}E_{R}=\left[\frac{E-E_{inc}}{E_{inc}}\right]_{x\ll 0}\quad \text{and}\quad E_{T}=\left[\frac{E}{E_{inc}}\right]_{x\gg l},\end{eqnarray}$$
where the incident energy,  $E_{inc}$, is evaluated using data from simulations without a plate. A reflection coefficient,
 ${\mathcal{R}}$, is obtained by integrating
 $E_{R}$ over the domain
 $\{\boldsymbol{x}:0<x+2\,m<\unicode[STIX]{x1D706};-H_{w}<z<\unicode[STIX]{x1D702}\}$, and over a wave period, and averaging over 10 wave periods. A transmission coefficient,
 ${\mathcal{T}}$, is obtained from
 $E_{T}$, and using the domain
 $\{\boldsymbol{x}:0<x-3\,m<\unicode[STIX]{x1D706};-H_{w}<z<\unicode[STIX]{x1D702}\}$.
Energy coefficient  ${\mathcal{E}}$ in the reflected and transmitted fields (
 ${\mathcal{R}}+{\mathcal{T}}$; navy pentagrams), plus the energy dissipated in the overwash (
 ${\mathcal{R}}+{\mathcal{T}}+{\mathcal{D}}_{ow}$; cyan crosses; panel b only), plus the energy in the surrounding water (
 ${\mathcal{R}}+{\mathcal{T}}+{\mathcal{D}}$; orange hexagrams), versus incident steepness for
 $T_{inc}=0.9~\text{s}$, and (a) thick plate and (b) thin plate.

Figure 14 shows the energy coefficient  ${\mathcal{E}}={\mathcal{R}}+{\mathcal{T}}$ as a function of incident steepness for
 $T_{inc}=0.9~\text{s}$, and the (a) thick plate and (b) thin plate. The maximum value of the energy coefficient is unity, i.e.
 ${\mathcal{E}}={\mathcal{R}}+{\mathcal{T}}\leqslant 1$, where equality indicates that all of the incident energy is redistributed into reflected or transmitted fields, and values less than unity indicate that incident energy is dissipated. For both plates, an increasing proportion of energy is dissipated as the incident steepness increases. For the thick plate, only small proportions of energy are dissipated – the minimum energy coefficient is
 ${\mathcal{R}}+{\mathcal{T}}=0.956$ at
 $k\,a_{inc}=0.15$, i.e. <5 % incident energy dissipated only. In contrast, for the thin plate, relatively large proportions of energy are dissipated:
 ${\mathcal{R}}+{\mathcal{T}}=0.912$ at
 $k\,a_{inc}=0.08$, and
 ${\mathcal{R}}+{\mathcal{T}}=0.790$ at
 $k\,a_{inc}=0.15$, i.e. >20 % incident energy dissipated. The behaviours are consistent with the laboratory experimental findings of Toffoli et al. (Reference Toffoli, Bennetts, Meylan, Cavaliere, Alberello, Elsnab and Monty2015) and Nelli et al. (Reference Nelli, Bennetts, Skene, Monty, Lee, Meylan and Toffoli2017), who used alternative methods to evaluate the reflected and transmitted energies.
Figure 14 also shows energy coefficients  ${\mathcal{E}}={\mathcal{R}}+{\mathcal{T}}+{\mathcal{D}}$, where
 ${\mathcal{D}}$ is the proportion of dissipated energy, calculated as
 $$\begin{eqnarray}\displaystyle & \displaystyle {\mathcal{D}}=\int _{x_{wm}}^{x_{bh}}D_{wt}\,\text{d}x\quad \text{for the thick plate,} & \displaystyle\end{eqnarray}$$
 $$\begin{eqnarray}\displaystyle & \displaystyle \text{and}\quad {\mathcal{D}}=\int _{x_{wm}}^{x_{bh}}D_{wt}\,\text{d}x+{\mathcal{D}}_{ow}\quad \text{for the thin plate,} & \displaystyle\end{eqnarray}$$
 $$\begin{eqnarray}{\mathcal{D}}_{ow}=\int _{0}^{l}D_{ow}\,\text{d}x_{p}\end{eqnarray}$$
is the proportion of incident energy dissipated in the overwash. For both plates, adding the proportion of dissipated energy to the energy coefficient brings it close to unity: for the thick plate,  $1-({\mathcal{R}}+{\mathcal{T}}+{\mathcal{D}})<0.01$ for
 $k\,a_{inc}\leqslant 0.12$ and
 $1-({\mathcal{R}}+{\mathcal{T}}+{\mathcal{D}})<0.02$ for
 $k\,a_{inc}=0.15$; for the thin plate,
 $1-({\mathcal{R}}+{\mathcal{T}}+{\mathcal{D}})<0.034$ for
 $k\,a_{inc}\leqslant 0.12$, and
 $1-({\mathcal{R}}+{\mathcal{T}}+{\mathcal{D}})<0.044$ for
 $k\,a_{inc}=0.15$. Therefore, the results indicate the energy-dissipation calculation, based on dissipation rate (4.2), accounts for the majority of the incident energy not in the reflected and transmitted fields. It is likely that the approximation of the derivatives in the post-processing, which was necessary to evaluate the dissipation rate, is responsible for at least part of the remaining missing energy, and that surface tension effects and vortices in the air account for other missing energy. The thin-plate results (figure 14b) also include the energy coefficient with only the proportion of energy dissipated in the overwash added,
 ${\mathcal{E}}={\mathcal{R}}+{\mathcal{T}}+{\mathcal{D}}_{ow}$. Dissipation in the overwash contributes 30 %–35 % of the total dissipation,
 ${\mathcal{D}}$, i.e.
 ${\mathcal{D}}_{ow}/{\mathcal{D}}=0.30{-}0.35$, indicating that dissipation in the surrounding water is the dominant contributor to total dissipation.
As in figure 14(b), but for (a)  $T_{inc}=0.8~\text{s}$ and (b)
 $T_{inc}=1~\text{s}$.

Figure 15 shows energy coefficients as functions of incident steepness for the thin plate, as in figure 14(b), but for incident wave period (a)  $T_{inc}=0.8~\text{s}$ and (b)
 $T_{inc}=1~\text{s}$. For the shorter incident period, dissipation is greater than for
 $T_{inc}=0.9~\text{s}$, e.g.
 ${\mathcal{R}}+{\mathcal{T}}=0.775$ at
 $k\,a_{inc}=0.15$, meaning >30 % incident energy dissipated, compared to 21 % for
 $T_{inc}=0.9~\text{s}$ at
 $k\,a_{inc}=0.15$. Moreover, dissipation in the overwash is the dominant contributor to the total dissipation, with
 ${\mathcal{D}}_{ow}/{\mathcal{D}}=0.57{-}0.95$ for
 $k\,a_{inc}\geqslant 0.08$ (dissipation is negligible for
 $k\,a_{inc}=0.06$). For the longer period, dissipation is marginally weaker than for
 $T_{inc}=0.9~\text{s}$, with <16 % incident energy dissipated at
 $k\,a_{inc}=0.15$, and the contribution of overwash dissipation to total dissipation is comparable to
 $T_{inc}=0.9~\text{s}$, although less consistent.
5 Summary and discussion
A numerical model of regular incident waves interacting with a thin floating plate, based on the two-phase, incompressible Navier–Stokes equations, was used to study the influence of overwash on wave transmission, particularly due to wave-energy dissipation. The governing equations were solved using software that implements the volume of fluid method, along with a dynamically coupled deforming mesh solver for the plate motion. Run times were accelerated by using a nonlinear potential-flow model to simulate evolution of the incident field up to approximately two to three wavelengths from the plate. A series of simulations were performed for a set of three incident periods, with corresponding wavelengths comparable to the plate length, and five incident steepness values, ranging from mild to storm-like. Model outputs were compared to laboratory experimental measurements on a floating plastic plate, and simulations were also run for a thick plate with identical mass to compare with experimental tests where an edge barrier was used to prevent overwash. The numerical model was shown to give excellent agreement with the experimental measurements in terms of the transmitted wave field, for both the thick and thin plates, including the increasing deviation of the amplitude transmitted by the thin plate from linear theory with increasing incident steepness. Good numerical–experimental agreement was found for overwash depths on the thin plate.
Numerical data were analysed to gain insights into the effects of overwash that were not measured during the experiments. Heave and pitch RAOs were found to decrease with increasing incident steepness, with the decrease far stronger for the thin plate than the thick plate, and the mean pitch angle was shown to be non-zero in the presence of overwash. Wave-energy dissipation around the plates was approximated numerically, motivated by large vorticity regions around the thin plate and in the overwash for large incident steepness. It was found that dissipation in the overwash increases with distance along the thin plate, with a pronounced peak near the plate centre, due to bore collisions. In the surrounding water, for both plates, dissipation was found to spike at the plate ends, particularly at the rear end, and with greater dissipation for the thin plate. The total dissipation was shown to compensate for most of the incident energy not in the reflected and transmitted fields. For the thin plate, dissipation in the overwash was found to be the dominant contributor to total dissipation for the shortest incident wave tested, whereas dissipation in the surrounding water dominates for the two longer incident waves.
The findings have potential implications for predicting propagation of ocean surface-gravity waves through the sea-ice-covered ocean, in operational forecasting (Boutin et al. Reference Boutin, Lique, Ardhuin, Rousset, Talandier, Accensi and Girard-Ardhuin2019) and climate-related studies (Bennetts, O’Farrell & Uotila Reference Bennetts, O’Farrell and Uotila2017; Roach et al. Reference Roach, Horvat, Dean and Bitz2018). Contemporary wave-in-ice models (Williams et al. Reference Williams, Bennetts, Squire, Dumont and Bertino2013a,Reference Williams, Bennetts, Squire, Dumont and Bertinob) use thin floating plates to model ice floes, and assume linearity. Three-dimensional models have been developed (Montiel, Squire & Bennetts Reference Montiel, Squire and Bennetts2016; Meylan & Bennetts Reference Meylan and Bennetts2018), but two-dimensional models are still used as standard, where propagation through multiple plates can be determined from the transmission coefficient for a solitary plate (Bennetts & Squire Reference Bennetts and Squire2012). Using a Froude scaling, the simulations in this investigation can be applied at geometric scale factors  $O(10){-}O(100)$, so that wavelengths and floe lengths are tens to hundreds of metres, and floe thicknesses are decimetres to metres. The laboratory–field scale disparity in the Reynolds number may alter the findings, particularly in relation to dominant sources of energy dissipation found in the shallow-water flow on the upper plate surface and at the plate ends, and larger-scale tests are required to investigate the effects.
Acknowledgements
The authors thank the anonymous reviewers for their constructive feedback. L.G.B. acknowledges helpful discussions with J. Denier and J. Sader at the Australia and New Zealand Industrial and Applied Mathematics (ANZIAM) conference 2018. Simulations were run on the OzStar supercomputer of the Centre for Astrophysics and Supercomputing, Swinburne University of Technology.
Supplementary movies
Supplementary movies are available at https://doi.org/10.1017/jfm.2020.75.



