1. Introduction
Speech perception is taken for granted as an easy and automatic task allowing for recovery of word meaning from salient speech sound categories (phonemes). Fast and accurate speech perception characterizes performance for a first-learned dominant language (L1). Attempts, however, to learn a second language (L2) highlight that the phonetic cues signaling language-specific phonemes are embedded in a highly complex acoustic signal. It is often difficult to identify the phonemes in L2 speech in a rapid and accurate fashion in the case where there is a mismatch between the L1 and L2 phonologies (Strange & Shafer, Reference Strange, Shafer, Hansen Edwards and Zampini2008; Strange, Reference Strange2011).
Considerable research has demonstrated that late learners of an L2 have difficulty distinguishing L2 phonemes that do not contrast meaning in the L1. For example, Japanese-speaking learners of English have difficulty discriminating and categorizing English /l/ and /r/ because these phonemes are non-contrastive in Japanese, as well as being acoustically similar (Strange & Dittmann, Reference Strange and Dittmann1984). With experience, L2 listeners may show improved perception of difficult L2 categories, but under difficult listening conditions (e.g., background noise), this improved performance often deteriorates. A better understanding of why performance deteriorates under certain conditions can lead to the development of new training methods to improve speech perception in a later-learned language.
1.1. Automatic Selective Perception Model
The Automatic Selective Perception Model (ASP) was proposed to account for variation in L2 speech perception under conditions that vary in task and stimulus difficulty and aims to address the disparity in speech perception performance in the L1 and late-learned L2 (Strange, Reference Strange2011). The ASP model postulates that listeners acquire automatic and efficient selective perception routines (SPRs) in the L1. Automaticity is a consequence of over-learning information. Behavioral and neurobiological evidence demonstrate that highly salient information requires fewer attentional resources for perception (e.g., Hisagi, Shafer, Strange & Sussman, Reference Hisagi, Shafer, Strange and Sussman2010). Learning can increase the salience of sensory information, thereby reducing attentional requirements (Crick & Koch, Reference Crick and Koch1990; Hisagi et al., Reference Hisagi, Shafer, Strange and Sussman2010). Evidence that L1 SPRs are automatic and efficient comes from research showing that L1 speech perception accuracy and speed are less affected by increased cognitive load when compared to L2 speech perception (Strange, Reference Strange2011). L2 learners may show considerable variability in performance on speech perception tasks related to a range of factors, including task difficulty, memory load, and stimulus factors (e.g., noise level); under one task condition, a listener may perform quite well on an L2 contrast whereas, under a more difficult condition, the same listener may perform more poorly (Strange, Hisagi, Akahane-Yamada & Kubo, Reference Strange, Hisagi, Akahane-Yamada and Kubo2011).
Neurophysiological evidence for automaticity of L1 speech perception comes from studies using an Event-Related Potential (ERP) measure called the Mismatch Negativity (MMN) (Näätänen, Paavilainen, Rinne, & Alho, Reference Näätänen, Paavilainen, Rinne and Alho2007). The MMN is a neural index of auditory change detection and can be obtained when attention is directed away from the auditory modality. The neural sources underlying MMN are in primary and secondary auditory cortex, with additional sources in a frontal network (Näätänen et al., Reference Näätänen, Paavilainen, Rinne and Alho2007).
The MMN is obtained using an oddball paradigm in which a series of repeating auditory stimuli (or events) are punctuated with infrequent stimuli/events. In the case that the individual's brain can discriminate the stimulus differences, the neural waveform shifts more negative at fronto-central scalp sites, between 100 and 300 ms following the onset of the detected stimulus change. ERPs are averaged for each stimulus category (standard vs. deviant) to increase the signal-to-noise ratio. The frequent (standard) stimulus is then subtracted from the infrequent (deviant) stimulus to more clearly reveal the MMN. In some designs, the stimuli assigned as the standard and the deviant are switched in a second condition, so that the response to the deviant stimulus can be compared to the response to the physically-identical stimulus when it occurs as a standard. This method minimizes differences in the ERP related to the low-level physical differences between the deviant and standard stimuli (Kirmse, Ylinen, Tervaniemi, Vainio, Schröger & Jacobsen, Reference Kirmse, Ylinen, Tervaniemi, Vainio, Schröger and Jacobsen2008).
The mechanism underlying MMN elicitation is thought to involve a comparison of incoming auditory stimuli to short-term memory representations. Regularity in the sound environment leads to a central sound representation (CSR), a short-term memory representation that persists for up to 10 seconds, and which is influenced by factors such as the probability and rate of presentation of the information (Näätänen et al., Reference Näätänen, Paavilainen, Rinne and Alho2007). A break in the regularly occurring pattern (i.e., the deviant) is detected via a comparison process of incoming auditory stimuli to the CSR. The MMN is not simply an index of difference in afferent (incoming) neural firing to the acoustic information of the different stimuli, but rather, is generated when deviance is detected between the incoming information and the CSR. Some recent studies have characterized this process as prediction and error detection under which encountering a change/error leads to revision of the CSR (Symonds, Lee, Kohn, Schwartz, Witkowski & Sussman, Reference Symonds, Lee, Kohn, Schwartz, Witkowski and Sussman2017).
The MMN is often smaller, later, or absent for non-native listeners compared to native listeners to speech contrasts that are not phonemic in the native language of the non-native group (Näätänen et al., Reference Näätänen, Paavilainen, Rinne and Alho2007; Shafer, Schwartz & Kurtzberg, Reference Shafer, Schwartz and Kurtzberg2004). These studies indicate that the CSR reflects phonological status and not simply acoustic-phonetic difference. Neurophysiological evidence also indicates that this phonological comparison process is fairly automatic for L1 categories. For example, Hisagi and colleagues (Reference Hisagi, Shafer, Strange and Sussman2010) found that Japanese L1 listeners showed little or no effect of attention on MMN amplitude and latency to a L1 vowel duration difference (1.6 long to short ratio); in contrast, non-native, American English listeners showed smaller MMN amplitudes to this vowel duration difference than the Japanese listeners when attention was directed away from the auditory modality; with attention to the vowel contrast, the American-English and Japanese listeners showed equally-robust MMN (Hisagi et al., Reference Hisagi, Shafer, Strange and Sussman2010). Even so, discrimination of some speech contrasts may be somewhat less automatic, such as consonant duration differences (Hisagi, Shafer, Strange, & Sussman, Reference Hisagi, Shafer, Strange and Sussman2015).
The detection of change appears to be modulated by which of two speech categories serves as the standard and which serves as the deviant (Maiste et al., Reference Maiste, Wiens, Hunt, Scherg and Picton1995; Eulitz & Lahiri, Reference Eulitz and Lahiri2004; Shafer et al., Reference Shafer, Schwartz and Kurtzberg2004; Hisagi et al., Reference Hisagi, Shafer, Strange and Sussman2010). Various explanations have been offered for these asymmetries, ranging from greater difficulty in neural discrimination due to acoustic factors (Hisagi et al., Reference Hisagi, Shafer, Strange and Sussman2010) to differences in neural discrimination due to phonological factors (Eulitz & Lahiri, Reference Eulitz and Lahiri2004).
1.2. Cross-linguistic studies of speech
With experience, L2 learners can show improved L2 perception; but under difficult task conditions or without attention, perception may deteriorate and resemble the starting point of L2 acquisition, as predicted by the ASP model. Studies of crosslinguistic speech perception suggest that the most difficult non-native phonemes for a naïve listener to discriminate are those that are equally good exemplars (phonetic variants) of the same L1 phoneme. Non-native discrimination is better for a pair of phonemes if one of the pair is not as good an exemplar (poor phonetic match) as the other to an L1 phoneme, or if one falls outside of the phoneme category and the other is within the category (Best & Tyler, Reference Best, Tyler, Bohn and Munro2007). For example, Spanish novice L2 learners of English showed better perception of the English vowel /æ/ in contrast to /ɛ/ than German, Korean, or Mandarin novice learners because Spanish listeners assimilate /ɛ/ to their L1 /e/ category, whereas /æ/ is assimilated to Spanish /a/ (Flege, Bohn, & Jang, Reference Flege, Bohn and Jang1997); for the other three languages, perceptual identification of /æ/ and /ɛ/ (at endpoints of a synthetic continuum) did not show a clear category distinction, and /æ/ targets were often produced with an /ɛ/ quality. This pattern was related to the listeners’ L1; in Korean, both [æ] and [ɛ] are allophonic variants of a single phoneme category. Inexperienced Korean and Mandarin listeners were found to rely more heavily on duration than the other groups in making judgments regarding the /æ/ vs. /ɛ/ continuum, and an /i/ versus /ɪ/ continuum (Flege et al., Reference Flege, Bohn and Jang1997). The authors suggested that reliance on duration cues may reflect the inability to use the spectral cues.
Speakers of Spanish, Japanese and Russian, which only have one low vowel, /a/, typically select AE /ɑ/ as being similar to their L1 low vowel, but these speakers are less consistent in how they perceive AE /æ/ and /ʌ/. Spanish late learners of English frequently chose to label AE /ɑ/ and /æ/ as the Spanish /a/ category (over 75% of judgments), whereas AE /ʌ/ was less consistently labeled to be similar to Spanish /a/ (53%) (Baigorri, Campanelli, & Levy, Reference Baigorri, Campanelli and Levy2018). Japanese listeners were found to assimilate these three AE vowels most frequently into the Japanese /a/ category, with AE /ɑ/ receiving the highest percentage (99%), /æ/ at 61%, and /ʌ/ at 68% (Strange, Akahane-Yamada, Kubo, Trent, Nishi & Jenkins, Reference Strange, Akahane-Yamada, Kubo, Trent, Nishi and Jenkins1998). Similarly, Russian listeners judged AE /ɑ/ to be most similar to Russian /a/ more frequently (94%) than AE /æ/ at 62% or AE /ʌ/ at 69% (Gilichinskaya & Strange, Reference Gilichinskaya and Strange2010).
These cross-linguistic studies of naïve listeners allow for predictions regarding how listeners will process L2 speech information under difficult conditions or when attention is directed away from the speech sounds.
1.3. Factors affecting L2 speech perception
Early experience with an L2 can result in native-like perception (Hisagi, Garrido-Nag, Datta, & Shafer, Reference Hisagi, Garrido-Nag, Datta and Shafer2015a; Gonzales & Lotto, Reference Gonzales and Lotto2013), and late L2 learners can improve perception with increased experience (Best & Strange, Reference Best and Strange1992; Bohn & Flege, Reference Bohn and Flege1992; Flege et al., Reference Flege, Bohn and Jang1997; Munro, Reference Munro1993; Yamada & Tohkura, Reference Yamada and Tohkura1992). However, some contrasts continue to be challenging even with years of experience. For example, Spanish L2 learners of English find /ɑ/, /æ/ and /ʌ/ difficult to categorize, even for those who have learned English before puberty (Baigorri et al., Reference Baigorri, Campanelli and Levy2018).
Auditory salience can also affect speech perception (Burnham, Reference Burnham1986). Greater acoustic difference between a pair of phonemes allows for better discrimination by naïve listeners. The vowel phonemes /i/, /ɑ/, and /u/ are maximally different in terms of the first formant (F1) and second formant (F2) frequencies, which allows for easier discrimination than a pair of phonemes that are less acoustically different. Auditory salience may also be related to universal patterns found in phonological inventories across languages (Eckman, Reference Eckman, Hansen Edwards and Zampini2008). Most vowel inventories include the peripheral vowels /i/, /a/, and /u/ (peripheral in terms of F1 and F2) and these may have special status compared to more central vowels (Polka & Bohn, Reference Polka and Bohn2011). Durational cues may be even more salient than spectral cues. Within the temporal dimension, some speech contrast types (e.g., consonant duration contrasts) are more difficult than others (e.g., vowel duration contrasts) (Hisagi et al., Reference Hisagi, Shafer, Strange and Sussman2010; Reference Hisagi, Shafer, Strange and Sussman2015b).
Auditory salience interacts with language experience. For example, highly proficient Russian–Finnish bilinguals when compared to native Finnish listeners exhibited a smaller MMN to a duration decrement of Finnish long to short /ɑ/ but showed a comparable MMN to the native group for Finnish long to short /æ/ (Nenonen et al., Reference Nenonen, Shestakova, Huotilainen and Näätänen2003; Reference Nenonen, Shestakova, Huotilainen and Näätänen2005). The authors suggested that presence of /ɑ/ in the Russian L1 inhibited processing of the duration difference for L2 Finnish long and short /ɑ/ but not for /æ/ because Russian has no vowel phoneme similar to /æ/ (see also Kirmse, Ylinen, Tervaniemi, Vainio, Schröger & Jacobsen, Reference Kirmse, Ylinen, Tervaniemi, Vainio, Schröger and Jacobsen2008).
Additional experience may lead to improvement in L2 speech perception in late learners of an L2. However, the ASP model predicts that such improvement will only manifest itself at the attention-dependent level and not at the level indexed by the MMN in a task where attention is focused away from the stimuli (Hisagi et al., Reference Hisagi, Shafer, Strange and Sussman2015b).
1.4. The present study
The current study examined L2 perception of English vowels by English L2 learners whose L1 has a smaller vowel inventory than that of American English (AE). The primary cue for distinguishing AE vowels in the American English variety of the New York City region is spectral (see Fridland, Kendall & Farrington, Reference Fridland, Kendall and Farrington2014, for a discussion of regional/dialect variations). Duration, however, serves as a secondary cue. Specifically, the vowels /ɪ/, /ɛ/, /ʊ/ and /ʌ/ are shorter in duration than the other vowels (/i/, /e/, /ɑ/, /æ/, /o/ and /u/). English speakers also reduce vowels in unstressed positions to /ə/, which is short in duration. Japanese, Russian and Spanish make fewer vowel distinctions. Spanish distinguishes only five vowels /i/, /e/, /a/, /o/ and /u/. Japanese makes use of five spectrally different vowels, but also distinguishes short and long versions of these vowels (short /i/, /e/, /a/, /o/ and /ɯ/Footnote 1 vs. long /i:/, /e:/, /a:/, /o:/ and /ɯ:/). Russian has the five vowels /i/, /e/, /ɑ/, /o/ and /u/, and the unrounded high central vowel /ɨ/. Russian also has vowel reduction in unstressed syllables, similar to English.
The focus of this study is on three, low and spectrally-similar AE vowels, /ɑ/ in “hot”, /æ/ in “hat”, and /ʌ/ in “hut”. Two of these are relatively long in duration ([æ:], [ɑ:]) and one is relatively short [ʌ]. L2 learners with Spanish, Japanese, or Russian as the L1 may show poor perception of these AE vowels on the basis of the spectral information and assimilate these vowels into one phoneme category. As noted above, all three language groups show high rates of assimilating AE /ɑ/ into the L1 low vowel /a/ category for each respective language; Japanese and Russian listeners found AE /ʌ/ and /æ/ to be less good exemplars of their native /a/; Spanish listeners show a different pattern, in that they judge AE /æ/ to be a good match with Spanish /a/, but similar to the JP and RU listeners, /ʌ/ is a less good match to the native Spanish /a/. The duration difference between /ʌ/ and the other two vowels may allow Japanese listeners to perceive this vowel as different from /æ/ and /ɑ/ (Strange, Hisagi, Akahane-Yamada, & Kubo, Reference Strange, Hisagi, Akahane-Yamada and Kubo2011). The presence of vowel reduction in Russian may allow Russian listeners to make use of duration as a cue in L2 speech perception. Alternatively, all three groups may be able to take advantage of the duration differences, particularly for a duration increment, because it may be sufficiently salient.
The first aim of the present study addressed whether neural measures of vowel discrimination at a pre-attentive level reveal language group differences that reflect the nature of the L1 vowel system. The electroencephalogram (EEG) was recorded while participants ignored the vowel sounds and performed a visual oddball task to engage their attention away from the auditory modality. The MMN was used to measure pre-attentive neural discrimination. The visual oddball distractor task was used rather than a commonly used passive task because we wanted evidence that the participants were focusing attention away from the auditory modality (Hisagi et al., Reference Hisagi, Shafer, Strange and Sussman2010).
A second aim of the study was to examine whether behavioral discrimination of the vowels (using an oddball task) correlated with the MMN. Measures of L2 background, including self-rated proficiency, age of arrival in the U.S., length of residence in the U.S. and amount of L1 versus L2 use were also obtained (descriptive details of these measures are included in supplementary information).
We tested the following hypotheses:
1) MMN neural discriminative will more closely reflect predicted L1-L2 assimilation patterns than behavioral discrimination because the MMN indexes an automatic level of change detection, reflecting L1 SPRs; AE listeners will show a significantly larger and earlier MMN than the L2 groups; Japanese listeners will show a larger MMN to the vowel duration difference than the Russian and Spanish listeners, and the Russian and Japanese listeners will show a larger MMN to /æ/ versus /a/ than the Spanish listeners.
2) The behavioral discrimination patterns will reveal poorer performance for L2 learners compared to the AE listeners; L2 behavioral performance, however, may be only moderately correlated with the MMN amplitude because MMN is elicited in a task where attention is directed away from the speech.
3) All listeners will be able to take advantage of acoustically more salient differences; listeners will show better behavioral and neural discrimination (greater MMN amplitude, earlier latency) for a larger spectral difference between vowels and for a duration increment compared to a duration decrement.
2. Methods
2.1. Participants
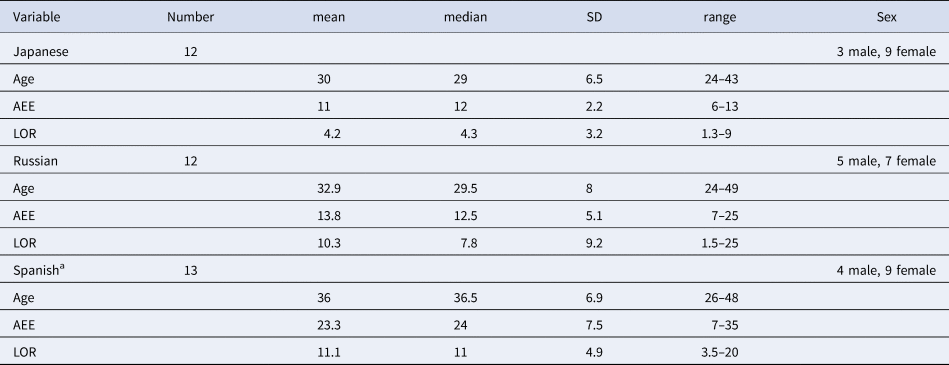
A total of 59 adults were tested on the ERP and/or behavioral speech perception tasks. Of these, six participants were excluded from the final sample for the following reasons: five did not complete the ERP and behavioral sessions (1 AE, 2 JP, 2 SP), and one had too few trials (<50%) after ERP data cleaning (1 JP). Two Spanish listeners had too few trials after ERP data cleaning, but we retained them for comparisons of behavioral perception. Of those remaining, 12 L2 adults were L1 speakers of Japanese (JP), 12 were L1 speakers of Russian (RU) and 11 were L1 speakers of Spanish (see Table 1). Two of these 11 SP participants failed to complete one of the two behavioral perception conditions. In the comparisons of behavioral perception only, data from the two SP participants (with poor ERP data) were included. All L2 participants were at least 14 years of age before coming to the US.
Descriptive statistics for each group for Age, Age of First Exposure to English (AEE), and Length of Residence (LOR) (in years), including number, mean, median, standard deviation (SD), range and number of male and females per group

a Two of the Spanish participants had no ERP data.
Sixteen adults (8 female, mean age 25.4 years, range 18–36) were L1 speakers of AE, and served as controls. The AE speakers had little experience with a second language beyond exposure in classroom settings in grade school or college. Twelve of these AE participants had ERP data, but four of them were not tested in the behavioral speech perception study. Four additional AE participants were tested only on the behavioral perception tasks to allow for 12 participants per group in the behavioral comparisons. All participants passed a hearing screening at 500 Hz, 1000 Hz, 2000 Hz and 4000 Hz (pure tone threshold, 25 dB HL).
L2 participants also completed a language background questionnaire (LBQ) which collected information on age of first exposure to English (AEE), length of residence (LOR) in the United States, age of arrival in the US (AOA-US) and Amount of Input (AOI). Table 1 provides descriptive statistics for each L2 group. Most of the Japanese and Russian participants reported first exposure to English in grade school, whereas many of the Spanish participants (11/13) were not exposed to English until arriving in the US. The Spanish listeners were from the following countries: Colombia (5), Mexico (2) Dominican Republic (DR) (3) Ecuador (1), Venezuela (1), and Argentina (1). There was no significant difference in age (two-tailed t-test, p = .3) or age of first exposure to English (AEE) (two-tailed t-test, p > .1). The groups differed significantly in LOR with the Japanese group showing a shorter LOR than the other two groups (p < .05).
Information on amount of use of English versus the L1 in various situations (e.g., work, school, shopping, neighborhood, movies) and with various discourse partners (parents, grandparents, siblings, spouse, friends, colleagues), as well as self-proficiency ratings are presented in the Appendices (Tables S1, S2, S3 and S4). These measures are beyond the scope of the current paper, except to note that the Russian participants rated their overall proficiency higher and showed less variability on these ratings (median 6, range 5–7 on a 7-point scale) compared to the Japanese (median 4.5, range 2–5) or Spanish (median 4.5, range 1–6) participants.
2.2. Auditory stimuli and design
The auditory stimuli consisted of three tokens of each of the following three natural speech syllables: /æpə/ (vowel pronounced as in “hat”), /ɑpə/ (as in “hot”) and /ʌpə/ (as in “hut”). The use of multiple tokens of one speaker increased the likelihood of participants categorizing the speech on the basis of phonological rather than acoustic-phonetic factors (Hisagi et al., Reference Hisagi, Shafer, Strange and Sussman2010). The stimuli were recorded at a sampling rate of 22050 Hz by a male speaker. Mean stimulus durations were 427 ms for /æpə/, 392 ms for /ɑpə/, and 375 ms for /ʌpə/. Mean vowel durations were the following: /æ/ = 187 ms (range 184–191 ms), /ɑ/ = 184 ms (range 161–209 ms) and /ʌ/ =134 ms (range 114–147 ms) with a long-to-short vowel ratio of 1.4. Mean fundamental frequency (F0) of the vowels was 132 Hz, ranging from 126 to 137 Hz for /ɑ/, 126–131 Hz for /æ/ and 130–136 for /ʌ/. Mean spectral distance between vowel pairs was 1.7 Barks for /æ, ʌ/, 1.5 Barks for /æ, ɑ/ and 0.8 Barks for /ɑ, ʌ/ (for /ɑ, æ, ʌ/ mean F1 = 935 Hz, 963 Hz, 877 Hz respectively; mean F2 = 1209 Hz, 1474 Hz, 1110 Hz, respectively, mean F3 = 2918 Hz, 2774 Hz, 2810 Hz, respectively). Adults have difficulty perceiving differences less than 1 Bark (1 Bark = [ (26.81*f) / (1960+f)] - 0.53), f = frequency). Thus, native AE listeners also may rely on the duration difference to categorize and discriminate the most difficult pair, /ɑ/ and /ʌ/. The speech stimuli were matched for intensity by root mean square and stimuli were presented at 76 dB SPL (mean intensity of target vowels).
Participants received two conditions. In one condition, /ɑpə/ served as the standard with /æpə/ and /ʌpə/ as the two deviants. In the second condition /ʌpə/ served as the standard with /ɑpə/ and /æpə/ as the two deviants. The /æpə/ stimulus did not serve as a standard because the study would be too long. The standard tokens occurred on 80% of the trials with at least three standards between deviants. Each deviant type occurred on 10% of the trials. Stimuli were presented at a rate of approximately 1300 ms (range 1250–1350 ms; interstimulus interval (ISI) mean = 901 ms, range 818–987 ms). The order of the two conditions was counterbalanced.
A total of 1400 speech stimuli and 140 deviants for each type were delivered in 12 blocks during for each ERP condition (2.5 minutes per block). Participants received 293 speech tokens (30 deviants for each of the two speech targets and 233 standard) divided into 5 blocks for each behavioral condition.
2.3. Visual stimuli and design
The visual stimuli in the visual oddball distractor task consisted of eight shapes used in four conditions: 1) square and rectangle; 2) circle and oval; 3) pentagon and hexagon; 4) five-pointed star and six-pointed star. One shape of each pair was the target. The shapes were green and varied slightly in size (between approximately 8 and 10 in) and were presented on a 13-inch laptop screen on a black background. The ISI between visual stimuli was 780 ms (a faster rate of presentation than that for the speech stimuli). The number of visual targets in a block ranged from 16 to 21 (median 18). Two orders (12 blocks for each) were counterbalanced across participants.
2.4. EEG and behavioral instrumentation
The EEG was collected at a sampling rather of 250 Hz and bandpass of 0.1–30 Hz using a 64-channel Geodesic amplifier and NetStation 4.0 software on a Mac computer. The reference was the Vertex (Cz). E-prime (version 1.2) on a desktop PC was used to control auditory presentation and to deliver event markers to the EEG acquisition computer for time-locking of the EEG to the speech sound onsets. The auditory oddball behavioral task was controlled by the same system, with responses recorded using a response box connected to this desktop PC. Auditory stimuli were delivered in sound field via two speakers 110 cm from the participant's head located to the left and right at a 50-degree angle.
The distractor visual oddball paradigm was presented on a PC laptop using E-Prime (version 1.2). The laptop was placed on a tray attached to the lab chair with the top of the laptop screen at a distance of approximately 50 cm with a 15-degree decline from the participant's eyes.
2.5. General procedures
Participants were screened via telephone to confirm language background; those meeting the study criteria were scheduled for a lab session. The procedures were explained and then participants provided informed consent, filled out the LBQ and completed the language proficiency rating.
A Geodesic net of 65 electrodes was placed on the participant's scalp. Electrode impedances were below 50 K Ohms. The participant was tested in an electrically-shielded booth. The participant was instructed to ignore the auditory stimuli and to silently count the visual deviants displayed on the laptop. Counting rather than a button press minimized motor movement. Visual blocks began with written instructions displayed on the laptop screen (e.g., “In the next set of shapes, count only the number of rectangles you see”). The participant recorded the number of deviant shapes after each block on a worksheet displaying the target picture for that block (e.g., a rectangle). The participant completed 12 visual blocks for each of the two auditory conditions.
Finally, participants were asked to complete the auditory behavioral conditions. Instructions were given verbally and were displayed in text on a computer monitor at the onset of the practice block. The participant was asked to press a response box button to a sound that differed from the frequently repeated one. The participant was familiarized with five repetitions of each target sound. Then, the participants completed 10 practice trials for each deviant type without feedback at the onset of each of the two behavioral conditions. After the practice task, the 293 experimental stimuli were delivered.
The total experimental time was approximately four hours (including breaks). Participants were paid $10 per hour at the end of the study.
2.6. EEG data analysis
The continuous EEG was processed off-line, using a lowpass filter of 20 Hz, into epochs of -200 ms to 800 ms post-stimulus, time-locked to stimulus onset. Eye blinks were corrected using Independent Component Analysis (ICA) (Bell & Sejnowski, Reference Bell and Sejnowski1995) in EEGLAB (MATLAB toolbox: Delorme & Makeig, Reference Delorme and Makeig2004). Epochs were baseline corrected and examined for artifacts, using NetStation software. Epochs were rejected if the fast average amplitude exceeded 200 μV, if the differential amplitude exceeded 100 μV, or if there was zero variance. Bad electrode channels on more than 20% of the total epochs were replaced by spline interpolation. An epoch was rejected if more than 10 channels for that epoch were marked as bad, following interpolation. The epochs were averaged for each stimulus and condition. The data were re-referenced to an average and baseline-corrected from −100 to 0 ms prior to the stimulus onset.
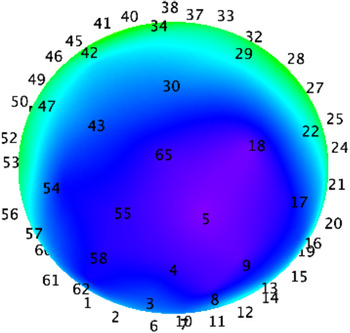
The ERP to the standard was subtracted from the ERP to the matched deviant (e.g., /ɑpə/ deviant minus /ɑpə/ standard; /ʌpə/deviant minus /ʌpə/ standard). The stimulus /æpə/ never occurred as a standard; thus, the deviant /æpə/ was compared to the standard in the same condition (/æpə/ minus standard /ɑpə/ or /æpə/ minus standard /ʌpə/). Spatial principal components analysis (PCA) was used to determine which electrode sites co-varied in the 100–300 ms time interval (IGOR Pro8, Wavemetrics, Inc., n.d.); co-varying sites were averaged together for an analysis of MMN peak latency. The first five PCAs (accounting for) 95%-99% of the variance) were retained. The electrodes site weightings (after normalization) from the retained components were then submitted to a K-means cluster analysis in which the 65 sites were sorted into 10, 15 and 20 clusters and examined to determine which sites were grouped in the same cluster (indicating high correlation). Thirteen frontocentral sites were clustered together (sites 3, 4, 5, 8, 9, 13, 16, 17, 54, 55, 57, 58 and 62, as shown in Figure 1). This strategy reduced the number of tests (13 sites to 1) and reduced noise (by averaging across channels), and thus, improved the precision of selecting peak latencies.
Geodesic electrode locations from the top view mapped on to a sphere illustrating the MMN (peak amplitude near frontal site 5, grand mean AE listeners /ʌpə/ deviant). Site 65 is the vertex (Cz), sites 3 and 8 are anterior and site 30 is posterior. Sites 3, 4, 5, 8, 9, 13, 16, 17, 54, 55, 57, 58 and 62 were averaged and used to compute MMN peak latencies.

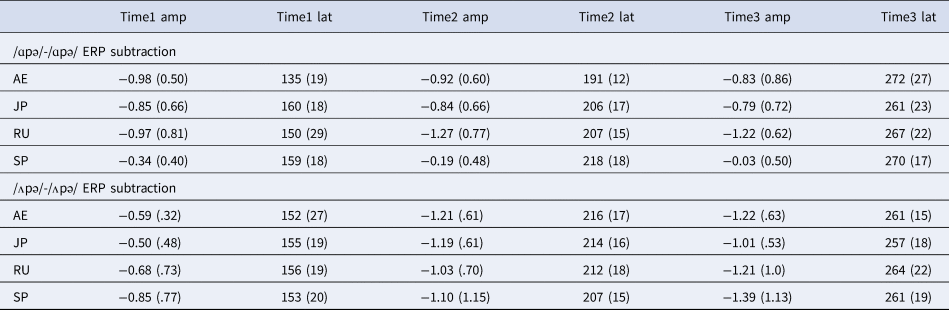
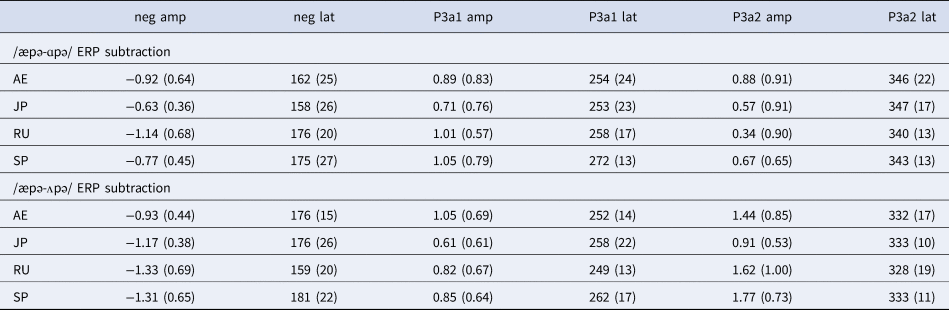
Three negative peaks were observed in the subtraction wave (deviant minus standard) between 100 and 300 ms. The most negative peaks in each of three narrower intervals (100–150 ms, 150–200 ms and 200–300 ms) was selected for the deviant /ɑpə/ minus standard /ɑpə/ and deviant /ʌpə/ minus standard /ʌpə/. Three peaks, rather than the most negative peak, were selected in the broader interval because the MMN to these complex stimuli was likely to reflect both spectral and temporal differences, which are computed in different time frames; specifically, detection of the duration difference will start later in relation to stimulus onset than detection of the spectral difference. For the deviant /æpə-ɑpə/ and /æpə-ʌpə/ subtraction waves, only one negative peak was observed, between 100 and 200 ms. This negative peak was followed by two positive peaks between 200 and 400 ms, which we named P3a1 and P3a2; the latency and amplitude of these positive peaks were selected for each participant (but these peaks are likely to reflect acoustic-phonetic difference between /æpə and /ɑpə/ and /æpə and /ʌpə/.)
To test the MMN amplitude, the data were downsampled by a factor of 10 using IGOR Pro8, with each point representing a 40-ms time period. Analyses were carried out on site 4 (near Fz), where MMN was generally of greatest amplitude across conditions and groups (see, Näätänen, et al., Reference Näätänen, Paavilainen, Rinne and Alho2007). To verify the presence of MMN, t-tests were employed to determine which time points (120, 160, 200 and 240 ms) were significantly different from zero. A one-way Analysis of Variance (ANOVA) was used to test whether groups differed significantly in MMN amplitude for time points where MMN was significant for at least one group. Significant differences (p < .05) were followed up with Dunnett's post-hoc tests.
2.7. Behavioral data analysis
Hits and false alarms were calculated for the auditory behavioral conditions. A’ (similar to d’ but more robust to small trial numbers) was calculated (Snodgrass, Levy-Berger & Haydon, 1985). Because the presentation of the stimuli occurred at the designated ISI regardless of the participant's response, button presses later than approximately 1100 ms were erroneously recorded by E-prime software as responses to the following stimuli. Examination of the data indicated that correct responses times were rarely earlier than 400 ms following stimulus onset. An automatic algorithm in IGOR Pro8 was used to reassign responses less than 400 ms to the prior trial (including those to apparently correct trials). This correction factor increased accuracy between 0 and 5% (i.e., no participant had more than 5% late responses). The Kruskal-Wallis test was used to compare group behavioral accuracy performance. Effect Size is reported using Cohen's d (for non-parametric tests η2 is calculated and transformed to d using the formula provided by Lenhard & Lenhard, Reference Lenhard and Lenhard2016). Spearman Rho (rs) is used to calculate the correlation between the behavioral accuracy (using A’ values) and MMN. Effect sizes are interpreted as the following: large effect d > .8, medium effect .8 > d > .5, smaller effect, d < .5, no effect, d < .2. Statistical tests were carried out using IGOR Pro8.
3. Results
3.1. Visual distractor performance
All but one participant was within a range of 20% (e.g., under- or over-counting by less than 4 for 20 or 21 targets; or less than 3, for 16 to 19 targets) for at least 80% of the blocks (19/24 blocks) and most performed within 10% of the correct count. The one participant (in the SP group) who performed the worst (poor on 25% of the blocks) had difficulty for a particular shape type (overcounting deviants for the pentagon/hexagon blocks), but performed comparably to the other participants on the other shape types.
3.2. ERPs
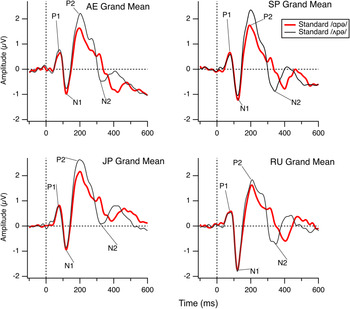
Figure 2 displays the ERP responses to the standard /ʌpə/ and /ɑpə/ at Fz for the four groups. The ERP response to these standards showed similar latencies for the Auditory Evoked Potentials (AEP), P1, N1 and P2. The difference in response to these stimuli is seen as less positivity of the P2 and a second positive peak around 300 ms followed by a later N2 latency to the /ɑpə/ standard. The analyses were carried out using /ʌpə/ deviant minus /ʌpə/ standard ERPs (/ʌpə/ subtraction) and /ɑpə/ deviant minus /ɑpə/ ERPs (/ɑpə/ subtraction) because these amplitude differences in the ERP peaks to the standards confound interpretation of the MMN. For /æpə/ as a deviant, the subtraction was /æpə/ minus /ʌpə/ and /æpə/ minus /ɑpə/, because /æpə/ never served as a standard. Thus, this subtraction wave will reflect differences in both the MMN and the AEP peak latencies and amplitudes.
Grand means at site 4 (near Fz) for each group to the standards for the two conditions. P1, N1, P2 and N2 peaks are labeled. American English = AE, Spanish = SP, Japanese = JP and Russian = RU.

3.3. Peak latency
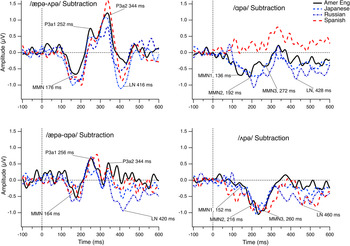
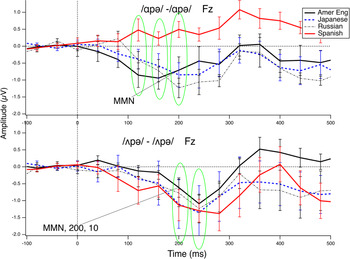
Figure 3 displays the subtraction wave amplitudes for the average of the frontocentral sites and Table 2 provides mean latencies and standard deviations of three prominent peaks for the /ɑpə/ subtraction (deviant increment) and the /ʌpə/ subtraction (deviant decrement). To first test whether the MMN latency differed between the two condition, the most negative peak of the MMN from 120–250 ms was selected for each participant (from the three peaks). The /ɑpə/ subtraction (mean = 189 ms, SD = 36) was significantly earlier compared to the /ʌpə/ subtraction (mean = 208 ms, SD = 32 ms) (F(1,46) = 2.01, p = .005, d = .56). Statistical analyses were performed separately for these two conditions. For the /ɑpə/ subtraction, the first peak (Time1) and second peak (Time2) latencies revealed significant main effects of group (F(3,43) = 3.57, p = .022; F = 5.79, p = .002); Dunnett's post hoc tests revealed that the AE participants showed a significantly earlier first peak compared to the JP and SP groups (Cohen's d = 1.35 and 1.30, respectively) and a significantly earlier second peak compared to the RU and SP groups (Cohen's d = 1.18 and 1.77, respectively). No difference in latency was observed for the third peak (p = .64). For the /ʌpə/ subtraction, there were no group differences in peak latency for the first, second or third MMN peaks (p > .61).
Subtraction waves (deviant minus standard) for the four language groups at Fz (site 4). The top right graph shows the /ɑpə/ subtraction. The bottom right graph shows the /ʌpə/ subtraction. The left graphs illustrate the conditions with /æpə/; in these, the MMN peak is followed by positive peaks P3a1 and P3a2. A late negativity (LN) is also labeled in the four graphs, but this late interval was not tested.

Mean amplitude (amp) and latencies (lat) and standard deviations (in parentheses) of the first (Time 1), second (Time 2) and third (Time 3) negative peaks for the four groups (American English = AE, Japanese = JP, Russian = RU, Spanish = SP) and for the two ERP subtractions

For /æpə/ deviant minus /ʌpə/ standard and for /æpə/ deviant minus /ɑpə/ standard, only one clear negative peak was observed. No significant latency differences were observed for this negative peak across the groups (p > .2 for /æpə/ vs. /ɑpə/ and p > .07 for /æpə/ vs. /ʌpə/). The latency of the following positive peaks (P3a1 and P3a2 in Figure 3, left graphs) did not significantly differ across groups (p > .14) (see Table 3).
Mean amplitude (amp) and latencies (lat) and standard deviations (in parentheses) of the negative (neg) peak and the P3a peaks for the four groups (American English = AE, Japanese = JP, Russian = RU, Spanish = SP) for the /æpə-ɑpə/ ERP subtraction and for the /æpə-ʌpə/ ERP subtraction

3.4. MMN amplitude
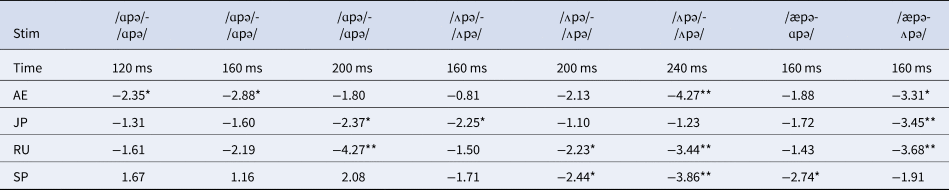
Figure 4 displays the group mean amplitudes and standard errors for the 40-ms samples to the /ɑpə/ subtraction and /ʌpə/ subtraction waves. The AE group showed a significant negativity of the /ɑpə/ subtraction wave for the 120 and 160 ms time points and the JP and RU groups showed significant negativity for the 200-ms time point. The SP group did not show a significant negativity in the /ɑpə/ subtraction. Table 4 provides the t-statistic for these comparisons.
Mean amplitude and standard error bars for the four groups for /ɑpə/ subtraction (top graph) and /ʌpə/ subtraction (bottom graph). The 40-ms intervals where significant negativity is observed for most participants are highlighted with green ovals.

t-statistic for amplitude of subtraction wave (e.g., deviant /ɑpə/ minus standard /ɑpə/) in pairwise comparison to 0 μV, calculated for each group (American English = AE, Japanese = JP, Russian = RU, Spanish = SP), stimulus and interval, separately

*p < .05, **p < .01.
ANOVAs comparing the amplitude for the relevant time points (120 ms, 160 ms and 200 ms for the /ɑpə/ subtraction) across groups revealed a significant group difference at 120 ms and 200 ms (F(3,46) = 2.82, p = .036; F(3,46) = 4.96, p = .005, respectively); the group difference approached significance at 160 ms (F(3,46) = 2.53, p = .07). The Dunnett post-hoc test shows that the SP group was different from the AE group at 120 and 200 ms (Cohen's d = 1.14 and 1.08, respectively), and different from the JP and RU groups at these times. The SP group exhibited relative positivity at fronto-central sites.
For the /ʌpə/ subtraction, the JP group showed significant negativity at 160 ms, the RU and SP groups showed significant negativity at 200 ms and the AE, RU and SP groups showed significant negativity at 240 ms (see Table 4 for t-statistic). The ANOVAs comparing the groups at 160 ms, 200 ms or 240 ms revealed no significant difference in amplitude (p = .071, p = .078 and p = .21, respectively).
To compare the duration increment (ɑpə deviant) to the duration decrement (ʌpə deviant), we calculated the mean amplitude from 120 to 200 ms. A group difference approached significance (F(3,43) = 2.78, p = 0.052); the post-hoc test revealed that the Spanish group differed from the other three groups (p < 0.05), but the AE, JP and RU groups did not differ from each other. The Spanish listeners showed a larger MMN to the duration decrement (ʌpə deviant) compared to the duration increment (d = 1.17). In contrast, no difference was observed in MMN amplitude between the deviant increment and deviant decrement for the AE, JP and RU listeners (F(1,35) = 1.31, p = 0.26, d = .26).
For /æpə-ɑpə/, only the SP group showed a significant negativity in the 160 ms interval. For the /æpə-ʌpə/ 160 ms interval, the AE, JP and RU groups showed significant negativity, but not the SP group (see Table 4 for t-statistic). However, ANOVAs indicated no significant difference in amplitude across groups for either of the /æpə/ contrast comparisons in this time interval (p > .5).
To compare /æpə-ʌpə/ to /æpə-ɑpə/ we examined the 160 ms interval; no group difference was observed (F(3,43) = .63, p = .60), but a main effect of stimulus was found (F(1,46) = 2.66, p = 0.01, d = .50), with the MMN amplitude larger for /æpə-ʌpə/ than /æpə-ɑpə/ (mean – 0.88 μV versus -0.43 μV, respectively).
3.5. Behavioral discrimination
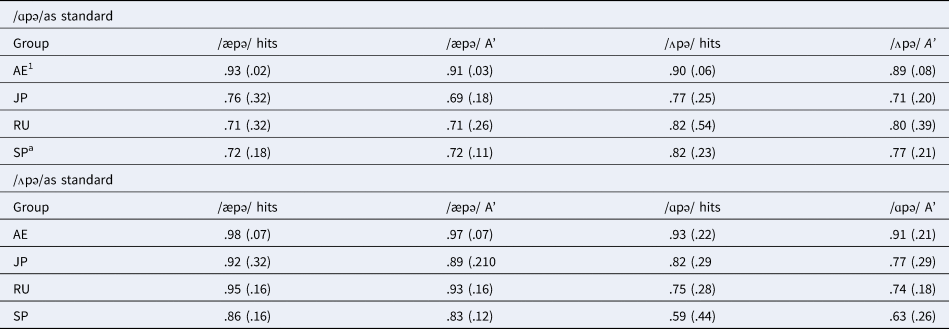
Table 5 displays the median, and interquartile range for hits and A’ calculations for the behavioral discrimination. False alarm rates were less than 2% for the AE group and less than 6% for most L2 listeners. For /ʌpə/ as the standard, there was only one JP and one SP participant with high false alarm rates (>20%); these two also showed low hit rates for both vowel targets. For /ɑpə/ as a standard, one Russian listener, as well as the same SP participant had high false alarms (>20%); both of these participants also showed low hit rates. A’ incorporates these false alarm rates. However, the hit rate, rather than A’ was compared across groups in the following analysis because there was no way to determine how the individual was misperceiving a non-target (false alarm) (e.g., a participant could misperceive non-target /ɑpə/ either as target /æpə/ or target /ʌpə/).
Median proportion of detected targets and false alarms to the standard for behavioral discrimination for each group (American English = AE, Japanese = JP, Russian = RU, Spanish = SP) (Interquartile range is in parentheses)

Note. N = 12 for each group.
a The mean accuracy values for 8 AE participants and 10 SP participants after removing participants without EEG data were identical.
Comparisons of performance across all four target stimuli showed that discriminating /æpə/ from /ʌpə/ was significantly easier than discriminating /æpə/ from /ɑpə/ or than discriminating /ʌpə/ and /ɑpə/ from each other (Kruskal-Wallis H (4,192) = 21.71, p < .05, d = .67). For the /æpə/ target when /ɑpə/ was the standard, a significant difference was found across the language groups (Kruskal-Wallis H (4,48) = 14.28, p < .05, d = 1.17). Pairwise comparisons reveal that the JP, RU and SP groups showed poorer discrimination than the AE group but do not differ from each other. For /ʌpə/ target when /ɑpə/ was the standard, the groups did not significantly differ (Kruskal-Wallis H (4,48) = 4.87, p = .19, d = .42). For /ʌpə/ as a standard, the participants performed relatively well when discriminating /æpə/. The AE group showed somewhat better performance, but it did not quite reach significance (Kruskal-Wallis H (4,48) = 7.72, p = .056, d = .69). A significant group difference was observed for discriminating /ɑpə/ as the deviant from /ʌpə/ as the standard (Kruskal-Wallis H (4,48) = 9.30, p =.024, d =.82). Pairwise comparisons revealed that the SP group showed poorer performance than the AE participants, but there were no differences among the other pairwise comparisons.
3.6. Relationship of MMN to behavioral discrimination
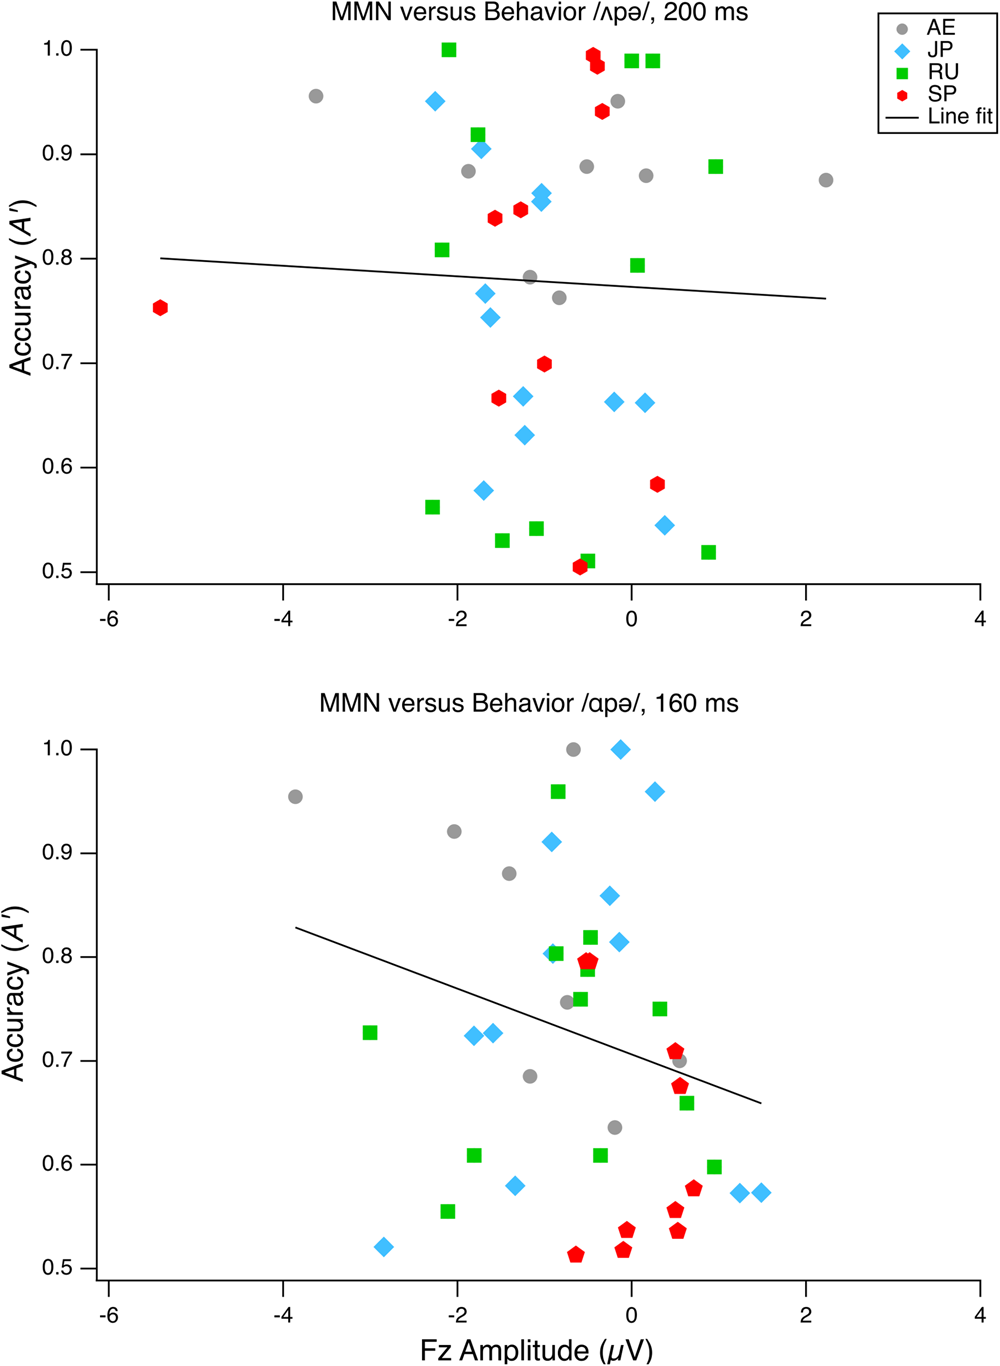
A’ accuracy values were examined in relation to the MMN amplitude in the following analyses because, in this case, miscategorization of a “standard” vowel as one of the deviant vowel categories would affect the ERP to that stimulus and affect the perceived probability of standards and deviants. No significant correlations were observed between A’ for /ʌpə/ discrimination from /ɑpə/ versus the MMN amplitude for the /ʌpə/ subtraction at 200 ms or 240 ms (Spearman rs = −.05, r = −.02, respectively, p > .1); there were also no significant correlations for /æpə/ discrimination from /ʌpə/ or from /ɑpə/ for comparing accuracy (A’) to the corresponding MMN amplitude at 160 ms (Spearman rs = −.17, rs = .16, p > .1). The correlation of /ɑpə/ behavioral discrimination when /ʌpə/ was the standard compared to the MMN amplitude for the /ɑpə/ subtraction was larger for the 160 ms interval than other intervals, but was not significant (rs = .29, p < .1, critical value for df = 42 is rs = .31) (for the 200 ms interval (rs = −.24, p > .1). There also was no correlation between behavioral discrimination of /ɑpə/ from /ʌpə/ and the peak MMN latency for the earliest peak in the /ɑpə/ subtraction, where we had observed a group difference (rs = −.21, p > .1). Figure 5. displays the relationship between /ʌpə/ and /ɑpə/ behavioral discrimination relative to MMN amplitude.
Correlations between vowel discrimination (A′) and MMN amplitude for /ʌpə/ as deviant and /ɑpə/ as deviant. Only participants with both EEG data and behavioral responses are displayed.

4. Discussion
This study found evidence of poorer discrimination at the behavioral and neural level of the AE vowels /ɑ/, /ʌ/, and /æ/ for some L2 learners of English, but primarily for the Spanish listeners. As predicted, both neural and behavioral discrimination of L2 vowel categories were affected by L1 group membership. We had predicted that the Spanish group would perform poorly on the /ɑ/ versus /ʌ/ contrast relative to the American English and Japanese groups because they would be unable to use the duration cue; this prediction was partially supported. Specifically, the Spanish group showed much poorer performance with discrimination of /ɑ/ from /ʌ/ than the AE group. But when reversing the standard and deviant, the Spanish group showed improved neural and behavioral discrimination. We had predicted that the duration decrement would be more difficult to discriminate than duration increment on the basis of acoustic factors. We did observe an earlier MMN to the duration increment than the duration decrement; but for amplitude, only the Spanish listeners showed a difference in MMN for these conditions, and this difference was in the opposite direction to what was predicted, with a larger MMN to the deviant decrement (that is, /ʌ/ deviant) compared to the deviant increment (/ɑ/ deviant).
We had predicted better discrimination for all L2 learners when duration was available as a cue. We found no support for this hypothesis, in that the long vowels /æ/ and /ɑ/ did not clearly reveal easier discrimination from /ʌ/ than from each other. We also hypothesized no more than a moderate correlation between MMN and behavior because the tasks are measuring different aspects of processing. We observed a weak relationship between discrimination accuracy of /ɑ/ from /ʌ/ as a standard and the MMN amplitude for /ɑ/, which accounted for only 8% of the variance. The finding that, at most, there was only a weak relationship suggests that additional factors beyond the level indexed by MMN contribute to behavioral discrimination of these vowels. We also used multiple exemplars of natural speech tokens to increase the ecological validity of the findings. The absence of an MMN for the Spanish group to the /ɑ/ stimulus when /ʌ/ was the standard but the presence of an MMN to /æ/ in this condition suggests that the /ɑ/ and /ʌ/ tokens were grouped as one category with only /æ/ tokens grouped as different/deviant. Below, we discuss these findings in greater detail.
4.1. L1 phonetic cues
We had predicted that L2 learners would rely on L1 SPRs, indexed by the MMN, because this level of processing is relatively automatic (Strange, Reference Strange2011; Hisagi et al., Reference Hisagi, Shafer, Strange and Sussman2010). L2 learners of AE were expected to perform more poorly for a stimulus contrast where both L2 phonemes are assimilated into the same L1 category (Best & Tyler, Reference Best, Tyler, Bohn and Munro2007). /ɑ/ and /ʌ/ were expected to assimilate into one category for Spanish listeners and into two categories for Japanese listeners. It was less clear which pattern would be found for Russian listeners. Thus, Japanese listeners were expected to show a larger MMN to /ɑ/ versus /ʌ/ than Spanish listeners because the Japanese L1 SPRs automatically extract duration cues. This hypothesis was confirmed with Spanish listeners showing no MMN to /ɑ/ when /ʌ/ served as the standard stimulus, whereas Japanese listeners showed a significant MMN that did not differ in amplitude from that of the American English group. In addition, the robust MMN found to this contrast for the Russian group suggests that the presence of duration as a cue for stress in Russian allowed for use of duration in processing AE vowels. Our findings, however, did not fully confirm the hypothesis, in that all groups showed a significant MMN to this contrast when the standard and deviant were reversed. That is, neural discrimination was easier when /ɑ/ served as the standard. An explanation for the asymmetry will be addressed below.
Behavioral discrimination of /ʌ/ versus /ɑ/ showed a similar pattern to neural discrimination at the group level; this was the only condition that showed even a weak correlation between behavioral accuracy and MMN amplitude (although, not significant), likely due to the particularly poor behavioral discrimination of the Spanish listeners; they showed particularly poor discrimination when /ɑ/ was the target among /ʌ/ standards. This pattern matches well with the MMN data, where the Spanish group did not show MMN.
The listeners also showed better discrimination of /æ/ than of /ɑ/ when /ʌ/ was the standard. L2 listeners were able to use the spectral and duration difference to perform relatively well. In addition, /æ/ may be a poorer exemplar of the /ɑ/ category on the spectral dimension, and as a result the /æ/-/ɑ/ discrimination may be easier than the /ʌ/-/ɑ/ discrimination (Best & Tyler, Reference Best, Tyler, Bohn and Munro2007). Surprisingly, Baigorri et al. (Reference Baigorri, Campanelli and Levy2018) found that late Spanish–English bilinguals reported /æ/ to be most like Spanish /a/ on over 82% of trials, whereas /ʌ/ was reported as similar to Spanish /a/ on 53% of trials. The perceptual assimilation task in their study asked participants to select one of the five symbols “i, e, a, o, u”; it is possible that the listeners were influenced by English orthography, in which /æ/ in English is typically spelled using the “a” symbol, and /ʌ/ using the “u”.
L2 listeners also performed somewhat better for /æ/ versus /ʌ/ than /æ/ versus /ɑ/ and MMN was twice as large for discriminating /æ/ from /ʌ/ as for discriminating /æ/ from /ɑ/. The spectral difference was slightly greater for /æ/ and /ʌ/ than for /æ/ and /ɑ/. It is possible that some of the improvement in accuracy and the larger MMN was due to greater spectral difference in addition to or instead of use of the duration cue. The Spanish listeners showed higher accuracy for /æ/ versus /ʌ/ than for /æ/ versus /ɑ/ (12% difference). The results of the /ʌ/ versus /ɑ/ discrimination, however, suggest that if Spanish listeners had access to the duration cue, it was only available when the deviant stimulus was the shorter one. Thus, it is possible that discrimination of deviant /æ/ from standard /ʌ/ by the Spanish listeners was accomplished using only spectral cues.
4.2. Asymmetry of discrimination
Difficulty in discrimination when /ʌ/ was the standard may be due to the nature of the L1 phonemic representation. The phonetic realization of Russian, Japanese, and Spanish /a/ may be closer to that of the AE /ɑ/ phonemic category than to /ʌ/. The English vowel /ʌ/ is often described as being closest, among all English vowels, to English /ɑ/ (Henton, Reference Henton1990). The MMN is viewed as a process of central sound representation (CSR) in short-term memory that draws on long-term memory representations.
Long-term phonological representations of a listener modulate the neural sound representation indexed by MMN (Näätänen et al., Reference Näätänen, Paavilainen, Rinne and Alho2007; Yu, Shafer, & Sussman, Reference Yu, Shafer and Sussman2017, Reference Yu, Shafer and Sussman2018). Our findings indicate that this CSR takes on the phonetic features of the L1 category. In the case that /ʌ/ is the standard, the CSR formulated for this stimulus will have the phonetic features of Spanish /a/ for Spanish listeners; in contrast, the CSR of /ʌ/ for Japanese listeners will be a short vowel because vowel duration is a primary phonetic feature in Japanese. The incoming deviant is then compared to this L1 representation. For Spanish listeners, the deviant /ɑ/ is not identified as different from the CSR (formulated from the standard), whereas Japanese listeners distinguish the long-vowel deviant /ɑ/ as different from the short vowel CSR. Russian listeners patterned similarly to the Japanese group suggesting that the length difference for stress is encoded by Russian listeners in their phonological representations, allowing neural discrimination.
For the Spanish group, it is possible that the two-syllable stimuli encouraged representation of prosodic-level information. When /ʌ/ was presented as the infrequent, deviant stimulus, discrimination improved for the Spanish group because sufficient phonetic detail of the deviant stimulus was maintained in the short-term memory trace to allow detection of the difference from the CSR. Specifically, the Spanish CSR would be a relatively long /a/ because Spanish does not reduce vowel length in unstressed syllables. Thus, /ʌ/ as a deviant can be detected as different from the standard representation both in spectral and temporal aspects. With a longer ISI, we predict the Spanish listeners would not show an MMN for /ʌ/ as a deviant when /ɑ/ is the standard because the short-term memory will decay over time and discrimination will then depend on “filling in” the representation from long-term memory (Yu et al., Reference Yu, Shafer and Sussman2017).
Previous studies found asymmetries in MMN amplitude and behavior, with duration increments (standard short stimulus and deviant long stimulus) resulting in a larger-amplitude MMN and earlier, faster response times than duration decrements (Hisagi et al., Reference Hisagi, Shafer, Strange and Sussman2010; also see Kirmse et al., Reference Kirmse, Ylinen, Tervaniemi, Vainio, Schröger and Jacobsen2008), suggesting that duration increment is acoustically more salient. The current findings showed the reverse pattern for the Spanish listeners, in that a larger MMN was found to the duration decrement (i.e., /ʌ/ deviant). We found no difference in MMN amplitude between the duration increment and decrement for the other three groups. Our results strongly support our previous claim that over-learning language-specific patterns can increase the salience of relevant cues, which then allows for automatic discrimination (Hisagi et al., Reference Hisagi, Shafer, Strange and Sussman2010). This claim was originally proposed to explain neural correlates of over-learning in visual perception (Crick & Koch, Reference Crick and Koch1990).
Asymmetry of phonological processing, perception and representation have been characterized in terms of markedness (Shafer, et al., Reference Shafer, Schwartz and Kurtzberg2004), underspecification (Eulitz & Lahiri, Reference Eulitz and Lahiri2004; Hestvik & Durvasula, Reference Hestvik and Durvasula2016), prototypicality (Aaltonen, Eerola, Hellström, Uusipaikka, & Lang, Reference Aaltonen, Eerola, Hellström, Uusipaikka and Lang1997), or articulatory factors (Polka & Bohn, Reference Polka and Bohn2011). For example, Shafer et al. (Reference Shafer, Schwartz and Kurtzberg2004) suggested that the retroflex presented as the standard and bilabial as a deviant led to a smaller MMN than the reverse because retroflex is more marked in the world's languages. Eulitz and Lahiri (Reference Eulitz and Lahiri2004) suggested that an asymmetry in the MMN amplitude found when discriminating a front rounded versus back rounded mid-vowel in German was due to underspecification of the [coronal] feature; they observed a smaller MMN when a front-rounded vowel (phonetically coronal) served as the deviant and a dorsal vowel as the standard than for the reverse, arguing that this supported underspecified representations (see Steriade, Reference Steriade and Goldsmith1995). It is currently unclear how vowel duration or the spectral distinctions among these low vowels should be treated in English with regards to underspecification.
Aaltonen et al. (Reference Aaltonen, Eerola, Hellström, Uusipaikka and Lang1997) observed that good categorizers (in terms of sharper boundaries and a prototype effect) of a Finnish vowel continuum for /i/ to /y/ showed a larger MMN when the standard was judged to be less prototypical. The Spanish group in our study showed a larger MMN when the standard stimulus was /ɑ/ than when it was /ʌ/. We did not ask participants to judge each AE vowel in relation to Spanish vowels or to make goodness judgments, but previous research suggests that AE /ɑ/ is closer than /ʌ/ to the Spanish /a/ in both spectral and temporal features (Baigorri et al., Reference Baigorri, Campanelli and Levy2018). Thus, our findings are not consistent with the suggestion that the less prototypical stimulus as the standard improves discrimination.
Polka and Bohn's (Reference Polka and Bohn2011) Natural Referent Vowel framework predicts better discrimination when the central vowel /ʌ/ (as the standard) changes to the peripheral vowel /ɑ/ (as the deviant). Our study, however, cannot fully address this prediction because the duration difference between vowels obscures whether the MMN and behavioral asymmetries are due to spectral or temporal cues. For example, the slightly better behavioral discrimination for the “less peripheral” /ʌ/ as the deviant (the opposite of what Polka & Bohn predict) may have been due to the duration difference. A future study is needed that examines spectral features independently of temporal features to address which model better accounts for these vowel asymmetries. Developmental studies will also be important.
These findings support a model of MMN in which the representation of the frequent sound is heavily influenced by early experience. However, the physical details of a stimulus change (deviant) are veridical, and thus allow discrimination, at least over the short term (Eulitz & Lahiri, Reference Eulitz and Lahiri2004). With longer time-delays (longer ISIs), the short-term memory trace decays, and in this case, long-term representations are needed to fill in the phonetic details (Yu et al., Reference Yu, Shafer and Sussman2018).
4.3. Limitations
A limitation of the study was that we only had 12 participants for each language group (and some missing data). Also, the Russian participants rated themselves as more proficient than the Japanese and Spanish listeners. A future study should include more participants with a wider range of proficiency in the L2 to fully address whether the robust MMN found for Russian speakers to the /ɑ/ deviant versus the /ʌ/ standard was due to higher L2 proficiency or the presence of reduced vowels in Russian phonology. We also did not include a condition with /æ/ as the standard and will need the condition to address whether the positive peaks (P3a1, P3a2) observed following the MMN to /æ/ deviants are an acoustic rather than a phonological effect.
5. Conclusions
This study revealed that L1 phonological information, stored in long-term memory representations, influenced processing of L2 phonemes in auditory cortex within 200 ms of onset of the information, and at an automatic level. These findings provide additional evidence that overriding early phonological patterns of processing is difficult and requires attention. They also suggest that an oddball training design in which the target stimulus is phonetically furthest from the L1 prototype could be an effective way to highlight stimulus difference for L2 contrasts that are highly challenging to learn. Even so, further testing of the various explanations for asymmetries in speech perception is necessary to determine which model will best explain L2 perception and guide the design of training studies.
Supplementary Material
For supplementary material accompanying this paper, visit http://dx.doi.org/10.1017/S1366728921000201
Acknowledgments
We would like to thank Jason Rosas and Yana Gilichinskaya for help in collecting data. This material is based upon work supported by the National Science Foundation under Grant number BCS-0718340.
Competing interests
The authors declare none.