In the experimental characterization of energy-resolving scintillator performance, the ratio of total light emission to the initial energy of the electron being stopped, often called “electron response”, can be measured by several experimental methods including Compton coincidence and K-dip spectroscopy. The Compton coincidence method, now implemented in the high-throughput version of the SLYNCI experiment,[ Reference Hull, Choong, Moses, Bizarri, Valentine, Payne, Cherepy and Reutter 1 ] correlates light yield Y e(E i) with total stopping of a Compton electron of initial energy E i. K-dip spectroscopy[ Reference Khodyuk, Rodnyi and Dorenbos 2 ] yields data to lower electron energy by correlating Y e(E i) with the kinetic energy of K-shell photoelectrons excited by tunable synchrotron radiation. The scintillator is said to exhibit nonproportionality of response if Y e(E i) varies with E i. If so, its energy resolution is degraded by fluctuations in the energy deposition process interacting through the nonproportionality of response.[ Reference Bizarri, Moses, Singh, Vasil'ev and Williams 3 ]
The physical origin of nonproportional response is generally regarded to start with nonlinear quenching proportional to second or third power of the excitation density n. Recent experiments using an above-gap z-scan technique have shown that nonlinear quenching in NaI, CsI, and SrI2 is third order,[ Reference Grim, Ucer, Williams, Burger, Bhattacharya, Tupitsyn, Bizarri and Moses 4 , Reference Grim 5 ] implying free-carrier Auger recombination consistent with slow thermalization of electrons expected for the low optical phonon frequencies in iodides.[ Reference Grim 5 – Reference Li, Grim, Ucer, Burger, Bizarri, Moses and Williams 7 ] In terms of second-order radiative rate R 2 , first-order quenching (or deep trapping) rate K 1, and third-order quenching rate K 3, the decay of spatially uniform free carrier density n (volume −1) is given by
 $$\displaystyle{{\rm d}n \over {\rm d}t}=- K_1 n - R_2 n^2 - K_3 n^3 .$$
Z-scan quenching experiments on oxides such as bismuth germinate exhibit dominant second-order quenching[ Reference Grim, Ucer, Williams, Burger, Bhattacharya, Tupitsyn, Bizarri and Moses 4 , Reference Grim 5 , Reference Li, Grim, Ucer, Burger, Bizarri, Moses and Williams 7 ] consistent with a rate equation where n now represents the exciton density and different kinetic orders are appropriate:
 $$\displaystyle{{\rm d}n \over {\rm d}t}=- K_1 n - R_1 n - K_2 n^2 .$$
This communication focuses on iodide scintillators described by Eq. (1).
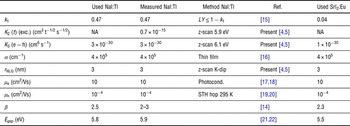
The linear spatial rate of energy deposition dE/dx must always be converted to n by multiplying with a factor of dimension energy−1length−2 if the nonlinear quenching rate constants K 2 and K 3 are to be relevant. This dimensional conversion is commonly regarded as dividing dE/dx by a factor β times the band gap and the square of a track radius (r NLQ in Table I). The radial gradient is very high, so radius, thus n, and thus the nonlinear quenching rates −K 2 n 2, −K 3 n 3 are all functions of time and diffusion coefficients D e, D h, and D eff discussed below.
Tabulated parameters for NaI:Tl and SrI2:Eu.

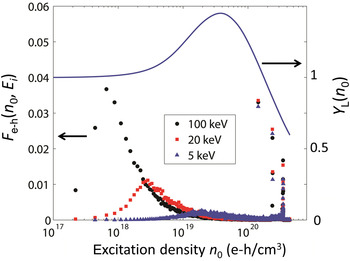
References Reference Li, Grim, Williams, Bizarri and Moses8 and Reference Williams, Grim, Li, Ucer and Moses9 explored the dependence of numerically simulated local light yield Y L(n 0) upon the local on-axis excitation density n 0 of a track with assumed Gaussian radial profile. Two major dependences were found: (i) ambipolar carrier diffusion with effective coefficient D eff, and (ii) the inequality of electron and hole diffusion coefficients expressed by the ratio D e/D h (=mobility ratio μ e/μ h in thermal equilibrium).[ Reference Li, Grim, Williams, Bizarri and Moses 8 ] Ambipolar diffusion depending on D eff is universal in all materials and expresses simply how much dilution of n 0 occurs by radial diffusion before nonlinear quenching in the track core takes its toll. This governs the roll-off at high n 0 as seen at the right-hand end of the blue solid curve in Fig. 1.
Plotted points (left axis) are distributions F e−h(n 0, E i) of on-axis e–h density n 0 for 100, 20, and 5 keV electron tracks in NaI. Solid blue curve (right axis) is local light yield Y L(n 0) for NaI with k 1 = 0.47, third-order kinetics with K 3 = 3 × 10⁻³⁰ cm6/s, and other parameters in Table I.

In parallel with the D eff dependence, inequality of D e and D h produces radial charge separation. This becomes an especially strong effect in halide compounds where self-trapping of holes reduces D h to the order of 10−6 cm2/s. Charge separation protects the separated carriers from prompt nonlinear quenching. They can still recombine with light emission during subsequent hopping diffusion under Coulomb attraction. However, diffusion of independent charge carriers in the presence of deep nonradiative traps introduces the hazard of deep trapping, which we characterize by the linear quenched free-carrier fraction k 1, where
 $$k_1=\displaystyle{{\vint {K_1 n\lpar t\rpar {\rm d}t} } \over {\vint {K_1 n\lpar t\rpar +R_2 n\lpar t\rpar ^2+K_3 n\lpar t\rpar ^3 {\rm d}t} }}.$$
Reference Reference Li, Grim, Williams, Bizarri and Moses8 showed that the n 0-dependence of an Independent carrier Fraction, IF(n 0, D e, D h), leads to a rising slope of Y L vs. n 0, where the slope is proportional to k 1 and approximately to D e/D h. Combined with the falling slope depending on D eff, this produces the hump seen in the blue curve of Y L(n 0) calculated for NaI:Tl in Fig. 1. This hump qualitatively resembles and is responsible for the “halide hump” seen characteristically in the experimental electron energy response, Y e(E i),[ Reference Payne, Cherepy, Hull, Valentine, Moses and Choong 10 , Reference Payne, Moses, Sheets, Ahle, Cherepy, Sturm and Dazeley 11 ] of halide materials (those with self-trapped holes). The responsible trends are similar to the “Birks” and “Onsager” trends discussed by Payne et al.[ Reference Payne, Cherepy, Hull, Valentine, Moses and Choong 10 , Reference Payne, Moses, Sheets, Ahle, Cherepy, Sturm and Dazeley 11 ], but the treatment used here admits expression directly in terms of nonlinear quenching rate constants and diffusion coefficients since it depends on volume energy deposition density n rather than linear energy deposition dE/dx as in Ref. Reference Payne, Cherepy, Hull, Valentine, Moses and Choong10.
Unfortunately, there are no direct experiments of local light yield Y L(n 0) over the whole electron track. One must convert Y L(n 0) to Y e(E i) in order to quantitatively compare the local light yield model to experiment. That is the subject of this communication. The lower curves (plotted points) in Fig. 1 are the results of Monte Carlo simulations of the electron energy deposition using Geant4 (version 9.4)[ Reference Allison, Amako, Apostolakis, Araujo, Dubois, Asai, Barrand, Capra, Chauvie, Chytracek, Cirrone, Cooperman, Cosmo, Cuttone, Daquino, Donszelmann, Dressel, Folger, Foppiano, Generowicz, Grichine, Guatelli, Gumplinger, Heikkinen, Hrivnacova, Howard, Incerti, Ivanchenko, Johnson, Jones, Koi, Kokoulin, Kossov, Kurashige, Lara, Larsson, Lei, Link, Longo, Maire, Mantero, Mascialino, McLaren, Lorenzo, Minamimoto, Murakami, Nieminen, Pandola, Parlati, Peralta, Perl, Pfeiffer, Pia, Rodrigues, Russo, Sadilov, Santin, Sasaki, Smith, Starkov, Tanaka, Tcherniaev, Tome, Trindade, Truscott, Urban, Verderi, Walkden, Wellisch, Williams, Wright and Yoshida 12 , Reference Agostinelli, Allison, Amako, Apostolakis, Araujo, Arce, Asai, Axen, Banerjee, Barrand, Behner, Bellagamba, Boudreau, Broglia, Brunengo, Burkhardt, Chauvie, Chuma, Chytracek, Cooperman, Cosmo, Degtyarenko, Dell'Acqua, Depaola, Dietrich, Enami, Feliciello, Ferguson, Fesefeldt, Folger, Foppiano, Forti, Garelli, Giani, Giannitrapani, Gibin, Gómez Cadenas, González, Gracia Abril, Greeniaus, Greiner, Grichine, Grossheim, Guatelli, Gumplinger, Hamatsu, Hashimoto, Hasui, Heikkinen, Howard, Ivanchenko, Johnson, Jones, Kallenbach, Kanaya, Kawabata, Kawabata, Kawaguti, Kelner, Kent, Kimura, Kodama, Kokoulin, Kossov, Kurashige, Lamanna, Lampén, Lara, Lefebure, Lei, Liendl, Lockman, Longo, Magni, Maire, Medernach, Minamimoto, Mora de Freitas, Morita, Murakami, Nagamatu, Nartallo, Nieminen, Nishimura, Ohtsubo, Okamura, O'Neale, Oohata, Paech, Perl, Pfeiffer, Pia, Ranjard, Rybin, Sadilov, Di Salvo, Santin, Sasaki, Savvas, Sawada, Scherer, Sei, Sirotenko, Smith, Starkov, Stoecker, Sulkimo, Takahata, Tanaka, Tcherniaev, Safai Tehrani, Tropeano, Truscott, Uno, Urban, Urban, Verderi, Walkden, Wander, Weber, Wellisch, Wenaus, Williams, Wright, Yamada, Yoshida and Zschiesche 13 ] at each n 0 in NaI:Tl at three different E i of 100, 20, and 5 keV. The low-energy Penelope electromagnetic models were used with a 100 eV threshold. See Supplementary material for validation of Geant4 dE/dx results. The quantity plotted is F e−h (n 0 ,E i), the fraction of all excitations occurring in a bin around n 0 from an electron of initial energy E i, averaging 2000 simulations at the lowest E i and 200 at the highest E i. Note that both Y L(n 0) and F e−h (n 0 ,E i) are functions of n 0. Then the integral
 $$Y_{\rm e} \lpar E_{\rm i} \rpar =\vint_0^{n_0 \max } {F_{{\rm e} - {\rm h}} \lpar n_0\comma \; E_{\rm i} \rpar \, Y_{\rm L} \lpar n_0 \rpar {\rm d}n_0 } $$
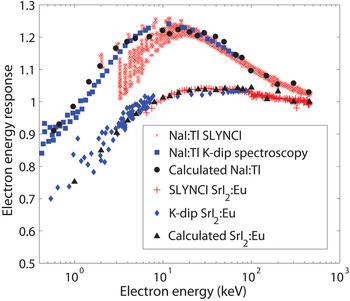
yields the predicted electron energy response for direct comparison to Compton coincidence or K-dip experimental Y e(E i). The relative standard error for calculated Y e(E i) in Fig. 2 is 0.21% at 1 keV and 0.14% at 100 keV for NaI:Tl and 0.23% at 1 keV and 0.07% at 100 keV for SrI2:Eu.
Calculated electron energy response, Y e(E i), for NaI:Tl and SrI2:Eu (black circles and triangles) compared with data from SLYNCI (red asterisks and crosses) and K-dip (blue squares and diamonds). Calculated and experimental data are normalized at 70 keV, and NaI:Tl was displaced for visibility.

In this communication, we present calculated Y e(E i) and comparison to experiment for NaI:Tl because it is widely used, and because the necessary input parameters have either been measured or can be scaled from closely similar CsI:Tl as listed and referenced in Table I. We also present calculated Y e(E i) for SrI2:Eu because it has exceptional light yield and proportionality.[ Reference Dorenbos 14 ] Its exceptional performance is in interesting contrast to NaI:Tl considering that both materials have similar values for most of the parameters relevant in the model of local light yield due to thermalized diffusion.
There are two ways of getting the linear quenched fraction k 1 from measurements: (i) calculate it from a model based on concentration of deep traps and their cross section, as well as the range of diffusion through a given set of traps, which depends on thermalization time and velocity of hot electrons, depending in turn on the host band structure.[ Reference Li, Grim, Ucer, Burger, Bizarri, Moses and Williams 7 ] (ii) Alternatively, one may empirically measure an upper limit for k 1 directly from total light yield without a microscopic model. This is the method used to obtain k 1 in the present calculations. The total light yield as a fraction of excitations cannot exceed 1 − k 1, i.e. Y T/Y max ≤ 1 − k 1, where Y T is the experimental total light yield and Y max is the theoretical limit determined by βE gap. In NaI:Tl, Y T = 38,000 photons/MeV[ 15 ] gives k 1 ≤ 0.47, taken here as k 1 ≈ 0.47. The calculations assumed 0.1% Tl doping in NaI. For comparison, CsI:Tl has k 1 ≈ 0.2 from published Y T = 54,000 ph/MeV,[ 15 ] K 3 = 2 × 10⁻³⁰ cm6 s−1 from z-scan,[ Reference Grim, Ucer, Williams, Burger, Bhattacharya, Tupitsyn, Bizarri and Moses 4 , Reference Grim 5 ] and α = 2.7 × 10⁵/cm,[ Reference Williams, Grim, Li, Ucer and Moses 9 ] μe = 8 cm2/Vs,[ Reference Aduev, Aluker, Belokurov and Shvayko 18 ] μh = 10−4 cm2/Vs,[ Reference Dietrich and Murray 19 , Reference Kerisit, Rosso and Cannon 20 ] and β = 2.5.[ Reference Dorenbos 14 ]
Solving Eq. (4) with the full set of F e−h distributions and the parameters in Table I gives the calculated electron energy response Y e(E i) for NaI:Tl shown with black circular points in Fig. 2. Experimental SLYNCI Compton coincidence[ Reference Hull, Choong, Moses, Bizarri, Valentine, Payne, Cherepy and Reutter 1 ] and K-dip[ Reference Khodyuk, Rodnyi and Dorenbos 2 ] Y e(E i) for NaI:Tl are also plotted in Fig. 2. The Compton coincidence curves are measured on many different NaI:Tl samples, giving the spread in energy response experimental curves.
Similarly, we compare the calculated Y e(E i) for SrI2:Eu (black triangles) with both SLYNCI[ Reference Hull, Choong, Moses, Bizarri, Valentine, Payne, Cherepy and Reutter 1 ] (red crosses) and K-dip[ Reference Alekhin, Khodyuk, de Haas and Dorenbos 23 ] (blue diamonds) experiments. Due primarily to the hygroscopicity of SrI2:Eu, some of its physical parameters used in the diffusion and quenching model have not yet been measured. At least the important K 3 and k 1 parameters have been measured in SrI2:Eu, and the other parameters have been assigned NaI values. The comparison of SrI2:Eu calculations to experiment thus amounts to a test of the importance of K 3 and k 1 in determining its electron response relative to NaI. STHs have been predicted in SrI2:Eu,[ Reference Sadigh and Åberg 24 ] so the assumption of immobile holes is made. SrI2:Eu has an exceptionally high total light yield of 80,000 ph/MeV, approximately 96% of the theoretical limit.[ Reference Dorenbos 14 ] This is consistent with a very small k 1 = 0.04, and that has two effects. First, small k 1 decreases the magnitude of the “hump” in electron response, which improves proportionality. Second, it indicates that most carriers will recombine to give light, thus resulting in high light yield. This is in contrast to NaI:Tl which has a large k 1, therefore a large hump in electron response and lower light yield.
The first and essential conclusion is that taking NaI:Tl input parameters from experiment in a model of competitive diffusion and quenching predicts Y e(E i) in good agreement with experimental data. This seems convincing confirmation of the roles of diffusion and quenching in nonproportionality. In a longer publication we will show the systematic effects of varying each material parameter and calculate Y e(E i) for more materials as parameters are measured.
Third-order quenching together with the measured K 3 contributes to the good match with experiment. This deserves mention, since it will be noted that the K 2 rate constant in Table I was not used for calculating electron response. This is experimentally based, since our recent z-scan experiments measured second-order kinetics and a rate constant K 2 only for a laser photon energy of 5.9 eV.[ Reference Grim 5 ] But using 6.1 eV photons that create free carriers, the quenching kinetics switched to pure third order with rate constant K 3. This should be the applicable kinetics for high-energy electron excitation.
Kozorezov et al.[ Reference Kozorezov, Wigmore and Owens 25 ] based part of their study of hot carrier diffusion effects on our thermalized local light yield model,[ Reference Li, Grim, Williams, Bizarri and Moses 8 , Reference Williams, Grim, Li, Ucer and Moses 9 ] but instead of using the thermalized band-edge mobilities and diffusion coefficients as here, they point out that electrons are not fully thermalized on the timescale of diffusion that competes with nonlinear quenching in at least the heavier halides. They calculated time-dependent diffusion coefficients of the thermalizing hot carriers and applied them in the physical context of Ref. Reference Li, Grim, Williams, Bizarri and Moses8 to calculate predictions of a hot electron diffusion and quenching model. Kirkin and Vasil'ev[ Reference Kirkin, Mikhailin and Vasil'ev 26 ] have also recently discussed the importance of nonthermalized electrons in scintillator response, including the effect of multiple LO phonon modes in complex crystals on speeding up thermalization. Additionally, Wang et al.[ Reference Wang, Xie, Cannon, Campbell, Gao and Kerisit 6 ] have calculated distributions and thermalization effects of hot electrons in the electron track cascade. We agree generally with the reasoning and conclusions of all three groups, and have recently published an extension of our diffusion and quenching model to include hot electron transport, specifically the calculated hot-electron group velocity from band structure in NaI:Tl, SrI2:Eu, and LaBr3:Ce.[ Reference Li, Grim, Ucer, Burger, Bizarri, Moses and Williams 7 ] Granting the likely role of hot carriers, the results presented here show how well the thermal diffusion parameters and measured third-order quenching rates can already match experiments in NaI:Tl and SrI2:Eu. From this base, hot-electron modifications of the diffusion parameters and resulting local light yield can be calculated in the form of Y e(E i) as described here, to look for improved fit with Compton coincidence and K-dip experiments.
Acknowledgments
Supported by the National Nuclear Security Administration, Office of Nonproliferation Research and Development (NA-22) of the US Department of Energy, Contracts DE-NA0001012 and DE-AC02-05CH11231. Computations were performed on the Wake Forest University DEAC Cluster with support in part by the University.
Supplementary materials
For supplementary material for this article, please visit http://dx.doi.org/10.1557/mrc.2012.27