Gender stereotypes play a fundamental role in the existence and persistence of sexism. Whether because they are, in part, rationalizations of our prejudices (Jost & Major, Reference Jost and Major2001), or because their presence increases the probability that discriminatory behavior will be produced (Fazio & Petty, Reference Fazio and Petty2008), the study and control of gender stereotypes seems to be indispensable to eradicating inequalities between women and men.
Some studies have focused on altering their content; but that is hard to change (Bargh, Reference Bargh, Chalken and Trope1999; Devine, Reference Devine1989). To produce even a minimal change, it is necessary to use strategies like exposing the individual to counterstereotypic exemplars that compel him or her to make a cognitive adjustment (Dasgupta & Asgari, Reference Dasgupta and Asgari2004; Smith & Zárate, Reference Smith and Zárate1992). However, the empirical evidence has shown that tactic to only affect the subtype targeted by the exemplar; the overall concept stays the same (Hugenberg, Blusiewicz, & Sacco, Reference Hugenberg, Blusiewicz and Sacco2010). Other strategies deployed to change the content of our stereotypes have proven effective to varying extents (e.g., recontextualizing, recategorizing, or subtypes), but in most cases, results have been associated with temporary, highly specific effects (e.g., Casper, Rothermund, & Wentura, Reference Casper, Rothermund and Wentura2010; Degner, Meiser, & Rothermund, Reference Degner, Meiser, Rothermund, Beelmann and Jonas2009).
In keeping with Social Role Theory (Eagly, Reference Eagly1987) and the Rationalization Hypothesis (Hoffman & Hurst, Reference Hoffman and Hurst1990), another set of studies posits that gender stereotypes form as a result of people rationalizing the roles they observe in real life. From that point of view, lasting, effective change will only take place when structural changes are made in the different spheres of a person’s development. Nevertheless, as studies of dynamic stereotypes have shown (Diekman & Eagly, Reference Diekman and Eagly2000; Rudman & Mescher, Reference Rudman and Mescher2013), and as theories of Ambivalent Sexism (Glick & Fiske, Reference Glick and Fiske1996) and Neosexism (Tougas, Brown, Beaton, & Joly, Reference Tougas, Brown, Beaton and Joly1995) maintain, traditional knowledge structures persist in more or less subtle ways. That is, despite a decline in more hostile, explicit expressions of sexism (largely due to structural changes in society), patterns of sexist thinking remain, camouflaged in an apparently egalitarian system.
To date, efforts to alter stereotypes have found certain limitations, mostly related to their specificity, slowness, and resistence to change. What other channel, then, might be used to eliminate their effect on intergroup attitudes? It seems the key, which various authors have explored and the present study is based on, is to use self-regulatory processes to prevent or control the application of stereotypes. Specifically, this study’s objective is to examine how to control the cognitive component of gender attitudes, blending the role of self-regulatory processes and more recent research conclusions about egalitarian goal activation (e.g., Moskowitz, Li, Ignarri, & Stone, Reference Moskowitz, Li, Ignarri and Stone2011). To do so, we evaluated the capacity of a task – exposing participants to a text about gender inequality – to activate temporary egalitarian goals that block stereotyped response to a task in which respondents distribute personnel into a hierarchical organizational chart. This was done with two specific objectives in mind. The first was to control the effect of within-subjects variables, like level of prejudice and egalitarian commitment, such that stereotype blocking could be associated with goal activation rather than influence from those individual variables. The second objective was to study participant responses as a function of their gender.
Previous studies by Devine (Reference Devine1989, 2002), Bargh (Reference Bargh, Chalken and Trope1999, 2009, 2010), and Moskowitz (1999, Reference Moskowitz2002, 2011) found evidence that self-regulatory processes can impact the final expression of an attitude. Those authors deemphasized changing the stereotype to instead focus on the processes that start once the stereotype is activated. Generally speaking, this line of research is built on the assumption that through self-regulatory processes, including the motivation to be egalitarian, people can control their behavior; that is, they will stop applying stereotypes about social groups if they believe they violate the principle of equality. Depending on individual characteristics (like level of prejudice), these processes may be more or less automatic, and the practice of self-regulated egalitarian behavior more or less continuous. While authors in this field have pursued some of the same aspects, the specific theoretical framework and results have differed from one to the next.
For instance, the core of Devine’s research is the distinction between knowledge and application of stereotyping; although activating the cognitive component of a stereotype may be inevitable, the individual’s level of inherent prejudice determines how it is applied (Devine, Reference Devine1989). People with internal motivations tending toward equality have the ability to control acquired beliefs about social groups, but they can only do so when time and cognitive resources are available (Devine, Plant, Amodio, Harmon-Jones, & Vance, Reference Devine, Plant, Amodio, Harmon-Jones and Vance2002). Bargh goes a step further; he is highly concise about the concept of goals. He defines them as mental representations of the final stage of a desire, together with the means to attain it (Bargh, 1990). Bargh’s studies have shown that goals can get activated unconsciously by pertinent environmental stimuli, which he termed selfmotives (Bargh & Morsella, Reference Bargh, Morsella, Agnew, Carlston, Graziano and Kelly2009; Bargh, Gollwitzer, & Oettingen, Reference Bargh, Gollwitzer, Oettingen, Fiske, Gilbert and Lindzey2010). Nonetheless, for the goal to become automatic, it must be associated with personal interests, values, and motivations. Like Devine before him (1999), he connects goal success to the consistency and internalization of goal-associated mental processes, and according to the author, the person may not even be aware of said processes.
Thanks to earlier research, it has been demonstrated that the motivation system can produce variations in attitude. Yet what happens when people do not have sufficient motivation to set off the processes involved in attitude change? Moskowitz’s arguments are consistent with the research on prejudice avoidance, and differ from what some of the other authors mentioned propose (e.g., Moskowitz, Reference Moskowitz2001, Reference Moskowitz2002; Moskowitz, Gollwitzer, Wasel, & Schaal, Reference Moskowitz, Gollwitzer, Wasel and Schaal1999). His main contribution is the notion that goals can proactively avoid stereotype activation and as a result, reduce prejudice. A 1999 study by Moskowitz et al. generated novel information about the motivation system’s effect on automatic stereotype inhibition. Specifically, the authors employed the term “chronic egalitarians,” referring to people whose beliefs are low in prejudice and show strong commitment, compared to individuals whose beliefs are low in prejudice, but who lack commitment to those beliefs. For “chronics,” egalitarian goals turn into habits, preventing the stereotype in the first place rather than correcting it. The process that takes place for chronic egalitarians is related to competition among interconnected aspects. Goal activation in the actual or symbolic presence of a member of the stereotyped group would conflict with the stereotype; they are incompatible constructs. In that case, the goal would block activation of the stereotyped content. This happens repeatedly over time, reinforcing the connection between the goal and the member of the category, and weakening the connection between that category and the stereotype. In a series of subsequent studies, Moskowitz proposed that similar states could be induced in participants evaluated and classified as “nonchronic egalitarians” (Moskowitz, Reference Moskowitz2002; Moskowitz et al., Reference Moskowitz, Li, Ignarri and Stone2011). That assertion sets him apart from Bargh (1990). Although both researchers believe nonconscious goal generation can impact behavior, Moskowitz believes the range of people receptive to counterstereotypic response by inducing temporary states is wider, even when they are unaware they are exercising that sort of control. Another aspect that differentiates Devine from Bargh is the role they assign to prejudice. According to Moskowitz’s results, chronic and nonchronic egalitarians did not differ in their levels of prejudice, but in their level of compromise (Moskowitz, Reference Moskowitz2002; Moskowitz et al., Reference Moskowitz, Li, Ignarri and Stone2011); whereas other authors believed goal strength was closely related to level of prejudice.
Although each of the aforementioned authors has posited the egalitarian goal construct in subtly different ways, their definitions have some features in common. This allows us to synthesize and work from a single, unified concept of egalitarian goals, defined as follows: mental schemas or representations that, even when activated temporarily, compete hierarchically with other processes, which get blocked if they are incompatible with the goal. That understanding of goals determines what strategies should be used to generate them temporarily. One is to induce alternative constructs that can control the automatic activation of beliefs and evaluations (Moskowitz, Reference Moskowitz2001; Moskowitz et al., Reference Moskowitz, Gollwitzer, Wasel and Schaal1999; Moskowitz, Salomon, & Taylor, Reference Moskowitz, Salomon and Taylor2000). Another condition under which goals might be activated is when someone tries to accomplish something, and their pursuit is blocked or thwarted, especially when the goal is important to the individual (e.g., after someone with altruistic goals behaves in a way perceived as not in solidarity with a stigmatized person). The cognitive and emotional state generated in such a case can be explained in terms of self-completion and discrepancy theories Footnote 1 (Higgins, Reference Higgins1987; Wicklund & Gollwitzer, Reference Wicklund and Gollwitzer1982).
Building on the conclusions of studies reviewed above regarding self-regulatory and egalitarian goal processes, and applying them to the area of gender discrimination, the present study’s primary objective was: to determine if it is possible to influence the application of gender-associated beliefs through exposure to information that describes inequality between women and men (egalitarian goal activation). In addition, two more specific objectives were pursued: 1) to control the effect of the within-subjects variables prejudice and egalitarian commitment on the dependent variable (so we can assert that goal activation yields differences in participant responses not due to their individual characteristics); and 2) to study differences in task responses as a function of participants’ gender.
To achieve those research objectives, egalitarian goals were temporarily activated using a text about the inequality women experience globally. In keeping with self-discrepancy and self-completion theory, the content of the text describes the disadvantaged position of a particular social group, so a schism is formed between the equality-based ideal – whether internally or externally motivated – and the reality, which is one group’s clear advantage over the other (Higgins, Reference Higgins1987; Wicklund & Gollwitzer, Reference Wicklund and Gollwitzer1982). The effect of temporary goal activation was evaluated by means of a task in which male and female candidates are allocated into a company’s hierarchical organizational chart (adapted from a 2005 study of racial discrimination by Michinov, Dambrun, Guimond, & Méot’s). Three versions of the task were employed. They shared basic content (the organizational chart, the male and female candidates to be distributed, and the instructions for response), but differed in the type of information they provided about the company. One refers to a hospital. Another describes a technical and expert services company. The third and final task modality does not provide the company’s name or type. For all three versions, the candidates’ vertical and horizontal distribution within the chart gets recorded. The function of posing different types of company (from this point on “hospital,” “expert services,” and “neutral”) was to provide different contexts for response, ensuring activation of the category and its stereotypes. Studies of social categorization have found that when people lack information about a person or group, they adopt criteria toward the attitude object based on categorical aspects that seem salient (Macrae, Milne, & Bodenhausen, Reference Macrae, Milne and Bodenhausen1994), in this case gender. Furthermore, faces function like visual stimuli, activating associated knowledge structures, which include stereotypes.
The hypothesis pertaining to the overall objective is that condition (control vs. experimental, in which the egalitarian goal is activated through pre-exposure to an activating text) will impact responses on the hierarchy task. We predict that scores on the task (dependent variable) will show more female candidates assigned to higher positions along the vertical axis of the organizational chart in the experimental condition, and a balanced number of male and female candidates placed on the three versions of the task. That would entail blocking the application of stereotypes about women’s and men’s performance in the employment sphere, where associating agent characteristics with men vs. communal properties with women results in horizontal as well as vertical segregation. We expect this will be the case for all three company types included in the study, but it may be the most apparent in the hospital organizational chart since it is easily identifiable as a feminized sector. Regarding the study’s first specific objective, we anticipate the effect of manipulation will occur independently of participants’ scores on ideological variables (prejudice and egalitarian commitment). Finally, in terms of participants’ sex, a main effect on the dependent variable is expected to occur as a result of ingroup favoritism. An interaction effect of sex and condition is expected as well: egalitarian goal activation in the experimental condition will eliminate differences between women and men in task execution because the goal involves a cognitive process that should interfere with that of ingroup favoritism, which will be obstructed if not eliminated entirely.
Method
Participants
The sample was comprised of students at the Universidad de Jaén in Spain. A convenience sampling procedure was employed, and keep in mind there was homogeneous distribution of participants into conditions according to sex, and that students in various degree programs were represented in the sample. The study was carried out as a group. Following the ethical stardards for this type of procedure, participants were informed that completing the test was voluntary as well as anonymous. The sample included 474 people, 153 men (32.3%) and 321 women (67.7%). Their average age was 20.04 years, ranging from 18 to 58 years old (SD = 4.43). They were enrolled in the following degree programs, from highest to lowest percentage of participants: Psychology (39.2%), Business Administration and Management (34%), Law (15.2%), Biology (8.4%), and varied technical majors (3.2%). Participants were assigned to conditions in a partially randomized fashion, making sure there was a similar number in each level of the two factors (condition and company) and that women and men were evently distributed into groups. In the control condition, 239 individuals were divided into three groups, each referring to a company type: (a) expert services, 80 participants (22 men, 58 women); (b) hospital, 78 participants (24 men, 54 women); (c) neutral company, 81 participants (28 men, 53 women). The experimental condition included 235 participants; of those, 80 filled out an organizational chart for an expert services company (29 men, 51 women), 77 for a hospital (26 men, 51 women), and 78 for a neutral company (24 men, 54 women). While men were underrepresented in the sample compared to women, their distribution across groups was balanced (in every level of the two between-groups conditions, there were approximately twice as many women as men).
Procedure
A 2 (condition: control, experimental) x 2 (gender: woman, man) x 3 (type of company: hospital, expert services, neutral) factorial design was employed. Distribution into factors was between-groups.
Participants responded first to the Scale of Prejudice and Egalitarian Goals (Aranda & Montes-Berges, Reference Aranda and Montes-Berges2013). Then they read a text with information that was either neutral or related to gender inequality, depending on whether the participant was assigned to the control or experimental condition. They were told to pay attention to the text, because at the end of the study, they would complete an information recall task. That instruction had two functions: on the one hand, to make it more likely that the content of the text would stay active long enough to influence the hierarchical structure task, and on the other, to mask the true research objective. Next, participants filled out one of the three organizational charts, along with a sociodemographic questionnaire. Finally, a recall test was administered, which asked participants to write a one-sentence summary of the text they read in Part 1 without going back to look at it.
Instruments
Activating and neutral texts
Two types of text were employed, approximately 300 words each. The information in one was irrelevant to the task (administered in the control condition), and the other had content that could potentially activate egalitarian goals (used in the experimental condition). The first was titled “El pensamiento: la forma que adorna las ciudades [The pansy: How it adorns cities].” An excerpt of its content appears below:
Existe una flor que, por su colorido y gran resistencia, se ubica a la entrada de muchas ciudades y pueblos (especialmente en glorietas y pequeñas raquetas). Muchas veces no podemos evitar mirar hacia estos lugares urbanos que, adornados con una alfombra de varias de estas flores, rebosan colorido y alegría (…). La gran variedad de esta planta produce muchos tipos de pensamiento, siendo muy diversos los colores y tamaños que podemos encontrar en viveros. Estos tipos de flor deben sembrarse en el verano en el exterior y trasplantar al lugar definitivo en otoño, cuando se produce su floración (…). Lo mejor entonces es cortarlas por la parte del tallo más baja y podremos volver a disfrutar de la alegría de sus tonalidades el invierno siguiente.
[There is a flower that, because of its color and strong resilience, is planted at the entrance to numerous cities and towns (especially in traffic circles and small highway turnarounds). Often we cannot help but look at these urban spaces that, adorned with a bed of many of these flowers, overflow with color and joy(…). The great variety of this plant produces many types of pansies, which vary tremendously in color and size from garden to garden. This flower should be planted outside in the summer and be transplanted to its permanent home in the fall when it blooms (…). It is best, then, to cut them at the very bottom of the stem so we can enjoy their happy hues again the following winter.]
The “activating” text was titled “La situación de desigualdad en el mundo [Global Inequality].” Here is a sample of its content:
(…) La feminización de la pobreza es un fenómeno creciente. La mayor vulnerabilidad de las mujeres a los procesos de empobrecimiento viene determinada por las condiciones precarias en que ellas acceden al mercado de trabajo, su extensa dedicación a tareas no remuneradas, sus déficits de alimentación, educación y atención sanitaria, así como su menor acceso y disfrute de bienes y derechos económicos, sociales y culturales en comparación con los hombres (…). El siglo pasado fue el más violento de la historia y la mayor parte de esa violencia se ejerció contra las mujeres, tanto en tiempo de guerra como de paz. Se utiliza para controlar a las mujeres, y toma muchas formas, desde la violación y el asesinato hasta la mutilación genital femenina.
[The feminization of poverty is a growing phenomenon. Women are more vulnerable to entering into poverty because of their precarious access to the labor market, extensive commitments to unpaid work, deficits in nutrition, education, and healthcare, and reduced access to goods and financial, social, and cultural rights compared to men (…). The past century was the most violent in history, and most of that violence was perpetrated against women, in times of war as well as peace. Violence is used to control women, and it takes many forms, from rape and murder to female genital mutilation.]
Before selecting the final text to use in the experimental condition, a pilot study was conducted with 47 participants; they did not take part in the present research. The pilot study presented five texts that reflect gender relations in different ways, either written from the perspective of inequality, or highlighting the positive aspects of equality. All participants were asked to read each passage slowly, then answer these two questions: a) ¿En qué grado el texto te hace desear que la igualdad de oportunidades entre las mujeres y los hombres se consiga? [To what extent does the text make you want women and men to have equal opportunities?]; b) ¿En qué grado el texto te incita a actuar para que la igualdad de oportunidades entre las mujeres y los hombres se consiga? [To what extent does the text incite you to take action so that women and men will have equal opportunites?]. By distinguishing between wishing and acting, we aimed not only to capture the attitude’s cognitive component, but its behavioral aspect as well. A Likert-type response scale was employed, with the anchors 1 nada [not at all] and 5 totalmente [totally]. According to the results, the text with the highest mean scores on both items and the lowest standard deviation was the one describing women’s inequality around the world, M = 4.78, SD = 0.75, and M = 4.74, SD = 0.61 on each question, respectively. In addition, the highest percentage of participants reported that was the text that made them want equality (89.1%) and think of taking action (80.4%) the most (totally). The other texts got lower scores than the passage described above. Those scores were as follows: (a) text 1, M want = 4.50, SD = .658, M act = 4.02, SD = .906; (b) text 2, M want = 4.62, SD = .598, M act = 4.52, SD = .658; (c) text 3, M want = 4.22, SD = .964, M act = 3.96, SD = 1.07; (d) text 4, M want = 4.63, SD = .687, M act = 4.60, SD = .785.
Hierarchical structure task
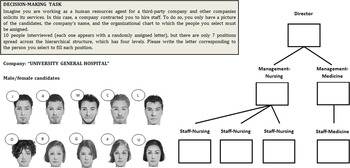
This task is based on the one Michinov et al. (Reference Michinov, Dambrun, Guimond and Méot2005) employed to assess the influence of social dominance orientation – a form of prejudicial attitude – on behavior. After adapting it slightly to fit the present study’s objective, the final task (Figure 1) presented 10 candidates (5 men and 5 women Footnote 2 ) to be sorted into a three-tiered organizational chart with seven available positions. Three versions of the task were tested: (a) a hospital where jobs in nursing and medicine appeared, (b) an expert and technical services company listing positions for technical staff and insurance brokers, and (c) an unnamed company listing positions without titles. Their basic content was the same: the organizational chart, male and female candidates to be placed, and instructions for response.
Hierarchy Task, adapted from Michinov et al. (Reference Michinov, Dambrun, Guimond and Méot2005).

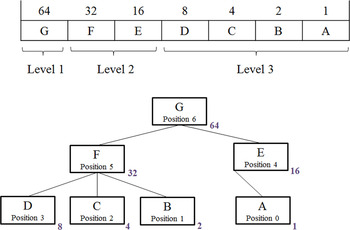
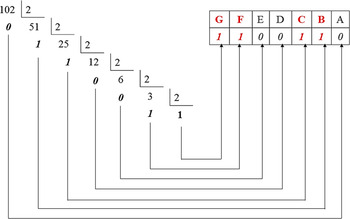
Each task response generates a numerical value between 3 (minimum score) and 115 (maximum score). High scores reflect a greater tendency to select women and place them in positions with more responsibility. A binary vector is used to calculate scores, representing all possible combinations of positions and number of candidates (Figure 2). A value is calculated by raising the number 2 to the coefficient of the position in the box where a female candidate was placed. The final score is the sum of all such values. Whether a value is higher or lower depends on the position (within each level, and of subordinates). This method of coding responses in the hierarchy ensures that no other combination could yield the same value. Take these two cases for example: (a) a participant places four female candidates at B, C, F, and G; applying the formula 21 + 22 + 25 + 26 gives a score of 102; (b) just by knowing the final score, 102 in this case, one can determine the number of candidates and where they were placed by converting the number into a binary – that is, the final value is divided in half, the resulting quotient is again divided in two, and the operation is repeated until the quotient is zero or one. If the result of those divisions, and the last quotient, have a value of 1, then there is a female candidate in that position. The first quotient of the first division corresponds to position A, and so on until the binary vector is complete (see Figure 3).
Diagram of How to Calculate the Dependent Variable Using a Binary Vector.

Example of How to Calculate a Score of 102 in Binary.

Scale of Prejudice and Egalitarian Goals (Aranda & Montes-Berges, Reference Aranda and Montes-Berges2013)
This scale consists of 30 items with a 7-point Likert-type response scale, grouped into three subscales: (1) Level of Prejudice, (2) Egalitarian Commitment, and (3) Awareness of Inequality. The present study employed only the first two. Level of Prejudice includes 13 items (1i, 3, 8i, 12i, 14, 17, 18i, 19i, 20, 21, 22, 29i, 30) that tap acceptance or rejection of prejudice (for instance, “considero que las diferencias de oportunidades entre mujeres y hombres están justificadas [I believe the differences in opportunities for women and men are justified]”). After inverting the indirect items (i), higher scores indicated lower prejudice. A reliability index of Crombach’s alpha of .810 was found. Next, the Egalitarian Commitment subscale includes 13 items (2, 4, 5, 6, 9, 10, 15, 13, 23, 24i, 26, 27, and 28), which relate to egalitarian ideological orientation with some level of commitment, and having taken action to promote equality in different areas of one’s life or development (such as family/kinship). After the indirect item was inverted, the higher the score, the greater the person’s egalitarian commitment. Here is a sample item: “intento persuadir a las personas para que luchen contra las diferencias entre los grupos sociales [I try to persuade people to fight against the differences between social groups].” Cronbach’s alpha was .825.
Results
To test for main effects of condition, type of company, and gender, as for interaction effects among factors, a factorial analysis of variance was carried out, following the general linear model. We defined the variables condition (two values: experimental and control), type of company (three values: hospital, expert services, and neutral), and gender (two values: men and women) as fixed factors. Hierarchy task scores, which we called “assignment of female candidates,” constituted the dependent variable. As for the company type factor, to compare scores post hoc, Tukey’s procedure was applied assuming equal variances, then the Games Howell test was applied assuming unequal variances.
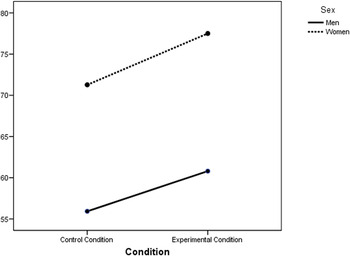
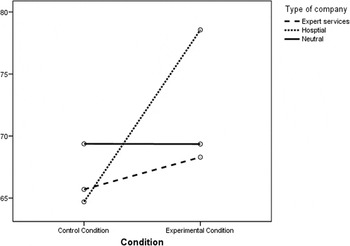
The main effect of the “condition” factor was statistically significant, F(1) = 4.15, p = .042, η2 = .081. Specifically, participants assigned to the control condition obtained lower scores on the DV than participants in the experimental condition (M control condition = Footnote 3 66.77, M experimental condition = 71.98). Meanwhile, the IV “type of company” did not turn out to be significant, F(2) = 1.78, p = .170, η2 = .008 (M feminized company = 71.02, M masculinized company = 67.09, M neutral company = 69.85). Gender showed a main effect on the DV, F(1) = 40.46, p < .001, η2 = .081, with women obtaining higher scores – that is, they were more egalitarian (M women = 47.71, M men = 57.71) (Figure 4). The condition and type of company interaction proved significant, F(2) = 3.97, p = .019, η2 = .017. Post hoc tests suggested the means were significantly different for the feminized company (hospital), in which case participant scores in the experimental condition were more egalitarian than those in the control condition (M experimental = 77.11, M control = 61.71) (Figure 5).
Estimated Marginal Means Graph, Gender’s Main Effect on the DV.

Estimated Marginal Means Graph of the Condition and Type-of-Company Interaction.

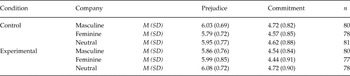
The variables prejudice and egalitarian commitment were controlled by applying analysis of covariance (ANCOVA). Beforehand, to test the distribution of scores on the covariables (prejudice and commitment) and the two factors (condition and type of company), means comparison was performed. Results showed that mean scores on prejudice and egalitarian commitment did not differ across participants as a function of condition, F(1, 473) = .392, p = .536; F(1, 473) = 0.77, p = .382, respectively. Nor were such differences found in the case of company type, F(2, 473) = 1.06, p = .347; F(2, 473) = 1.44, p = .236, respectively. Table 1 presents the means and standard deviations of the covariables for each level of the factors.
Descriptive Statistics for the Covariables in Two Conditions

Having ruled out unequal distribution of participants in terms of their level of prejudice and egalitarian commitment, we moved on to ANCOVA. The resulting model shows that in general, introducing covariables did not produce much difference in significance levels, save for the main effect of condition, which went from a critical level of .042 to a value of .038. Nevertheless, neither of the covariables displayed a significant effect on the DV: a) prejudice, F(1) = 0.82, p = .363; b) egalitarian commitment, F(1) = 0.47, p = .147. With respect to the corrected model, a significant critical level was observed associated with the various effects altogether (the factors, interaction, and constant), with a value of R 2 of .099.
Discussion
Our study’s main objective was to evaluate the ability of a task – in this case based on exposure to a text about gender inequality – to activate temporary egalitarian goals that block stereotyped response on a subsequent task in which participants sort male and female candidates into three hierarchical organizational charts. The results showed a main effect of condition (control no goal activation vs. experimental goal activation) on the dependent variable (assignment of female candidates to the organizational chart). In other words, the present study found that presenting information about a stereotyped group’s status of inequality has an effect on the application of gender stereotypes, successfully generalizing some results from studies of self-regulatory processes in racial discrimination to the area of gender discrimination (e.g., Moskowitz, Reference Moskowitz2002; Moskowitz et al., Reference Moskowitz, Li, Ignarri and Stone2011). Furthermore, the interaction between “condition” and “type of company” turned out to be significant, such that participants responding to the feminized company (hospital) were the ones who differed most significantly in their answers as a function of the condition they were assigned. In this case, participants in the experimental condition were less stereotypical in placing female candidates into the organizational structure. To be specific, participants in the control condition chose three female candidates on average, placing two of them at the bottom of the hierarchy (in the position of nurse), and a third woman in the position of hospital director. Participants in the experimental condition likewise selected three female candidates, but their arrangement in the hierarchy was different. One of them was situated in the lowest position of the structure, and another in the middle (manager of medical personnel). The last was placed in the director position. But why does the egalitarian goal only exert an effect in the case of the feminized company? We see two possible explanations. First, it could be related to the goal’s specificity, and to rigidity (rather than permeability) in the distribution of roles (Diekman & Eagly, Reference Diekman and Eagly2000; Rudman & Mescher, Reference Rudman and Mescher2013). That is, it is assumed – and has been found – that women have newly entered into roles historically reserved for men (that is, assigning female candidates to positions higher in the hierarchy, and to a position of responsibility in medicine besides nursing), but without leaving the areas in which those roles usually unfold (reflected in the finding that stereotyped responses were only blocked in the case of the hospital). That phenomenon, which has been described in dynamic stereotype research (Diekman & Eagly, Reference Diekman and Eagly2000; Rudman & Mescher, Reference Rudman and Mescher2013), could be the reason for the specificity of goal activation because it guides the application of compensatory response. Second, it is also possible that the state of discrepancy generated, although it creates a schism between the desired state and reality, might not be due to a failure to meet the individual’s own egalitarian beliefs. In that case, they would not feel incomplete or guilty, or if they did, not enough to prompt a strong compensatory response.
The first specific objective was to control the effect of within-subjects variables – prejudice and egalitarian commitment – on the dependent variable. One of the study’s central aims was to ensure that the effects observed in terms of stereotype blocking were the result of egalitarian goal activation, and not to other participant characteristics. The results confirmed that the more egalitarian responses in people exposed to the activating text beforehand, could be attributed to that experimental manipulation. That result confirms and supports Moskowitz’s findings, who effectively produced a transitory motivational state that affected responses on a racial categorization task in individuals with different levels of prejudice and egalitarian commitment (Moskowitz et al., Reference Moskowitz, Li, Ignarri and Stone2011). The second specific objective was to study the main effect, and interaction effects, of gender on the dependent variable. A main effect of gender was found in effect, with women responding in a more egalitarian manner. This sort of situation, for lack of other information, makes gender salient – key to identification – which would presumably activate ingroup favoritism responses (e.g. Billig & Tajfel, Reference Billig and Tajfel1973; Smith, Reference Smith2006; Tajfel, Flament, Billig, & Bundy, Reference Tajfel, Flament, Billig and Bundy1971). The consequence of that is reflected in the finding that men and women in the sample selected more candidates of their own gender, and placed them in higher positions in the hierarchy. Although no condition and gender interaction effect was found, we infer from the results of means comparison that women as well as men in the experimental condition gave more egalitarian responses than their homologues in the control condition (where overcompensation was in effect, too, with more women than men favoring female candidates).
This study was not without its limitations, and questions that remain to be answered. First of all, egalitarian goals were activated using a text about inequality, the objective being to produce a state of discrepancy. Yet despite having found relevant effects, they did not have an influence overall on responses to the hierarchical structure task. As Monteith’s model of prejudice self-regulation proposes, attitudinal change may occur because someone gains an awareness of the discrepancy, which generates feelings of guilt and self-reproach (Monteith, Mark, & Ashburn-Nardo, Reference Monteith, Mark and Ashburn-Nardo2010). Also, considering that the text refers to inequality produced “by the system,” it is possible that the averse feelings induced were not strong enough to trigger a strong compensatory response in all participants. Thus, we propose a study be conducted to examine the present findings in greater depth, and in doing so, to use a discrepancy task based on the individual’s “fault” in their desire to be seen as egalitarian (see Moskowitz et al., Reference Moskowitz, Gollwitzer, Wasel and Schaal1999). Second, having conducted this study in university students clearly limits the generizeability of its results and may be determining their strength and direction, especially considering the characteristic features of a university sample, like level of education and age.
In conclusion, the present study’s results provide valuable, positive information in the area of discrimination and prejudice: it is possible to generate egalitarian-leaning motivational states in people who are not particularly predisposed to egalitarian behaviors. This study contributes new data to the recent onslaught of research findings in this area (largely specialized in race studies), here in the context of gender discrimination.
This research was carried out with institutional support from the Universidad de Jaén, and the grant program Formación de Personal Docente e Investigador (FPDI), provided by the Consejería de Economía, Innovación, Ciencia y Empleo de la Junta de Andalucía.