Introduction
Reading is one of the most complex cognitive processes in which adults engage. Remarkably, many individuals around the world can read fluently in more than one language, and often their two languages use entirely different scripts. For example, readers of Asian languages such as Japanese, Chinese, and Korean who learn English not only have to manage two sets of lexical items and syntactic rules, but also a whole new set of printed and handwritten symbols. A challenge for researchers who study reading in bilinguals is to understand how bilinguals represent and process words in each of their languages so as to permit rapid access to meanings in either writing system.
In their Bilingual Interactive Activation (BIA+) model of word recognition, Dijkstra and Van Heuven (Reference Dijkstra and Van Heuven2002) proposed that a bilingual's two languages are integrated into a single language system. More specifically, in the BIA+ model there are pools of nodes representing sublexical orthographic information and sublexical phonological information, as well as pools of lexical orthographic nodes and lexical phonological nodes (see Figure 1). Both languages of a bilingual have representations in each of these pools of nodes. The language status of a lexical item is represented by means of a connection to one of two language nodes. This model was developed to account for the results of a large number of studies of word recognition in bilinguals (see Dijkstra, Reference Dijkstra, Kroll and de Groot2005, for a review). However, in the vast majority of these studies, the languages of the bilinguals used the same alphabet. To assess whether this model is an accurate account of all bilinguals, we also need to consider data from studies of bilinguals whose languages use different scripts because it is less clear whether such bilinguals will have integrated representations for their two languages.
The word identification system of the BIA+ model. Arrows represent the flow of information between pools of nodes. Connections within each lexical store are inhibitory. Black circles depict L1 (e.g., Japanese) representations, light gray circles depict L2 (e.g., English) representations, and medium grey circles represent phonemes shared by the two languages. L1 and L2 are assumed to have different scripts, and hence different sublexical orthographic representations. The task schema system of the BIA+ model is not included. Adapted from Dijkstra and Van Heuven (Reference Dijkstra and Van Heuven2002).

The current study focused on phonological representations. Studies of monolingual speakers have shown that phonological representations are activated within a very short time after a word is presented (e.g., Ferrand & Grainger, Reference Ferrand and Grainger1993, Reference Ferrand and Grainger1994; Perfetti, Bell & Delaney, Reference Perfetti, Bell and Delaney1988). We investigated whether the phonological representations that are activated by words in one script can facilitate the reading of similar sounding words that are written in a different script. Research on this issue typically uses a masked priming paradigm (Forster & Davis, Reference Forster and Davis1984). An advantage of this paradigm is that it allows one to investigate cross-language activation without bilingual participants’ awareness of the bilingual nature of the task. Prime words in one language are presented very briefly and are masked so that they are not consciously seen, and participants respond to a subsequent target word in the other language. If responses to target words differ when they are preceded by a phonologically related prime compared to an unrelated prime, it indicates that phonological representations from one language can activate phonological representations from the other language. Such a finding would suggest that bilinguals’ phonological representations for their two languages are integrated, as in the BIA+ model, or at least that phonological representations are interconnected across languages (Kroll, Van Hell, Tokowicz & Green, Reference Kroll, Van Hell, Tokowicz and Green2010).
The current study tested Japanese–English bilinguals in a masked phonological priming study with Japanese primes and English targets. Event related potential (ERP) data were collected in addition to lexical decision responses. One aim was to investigate whether a cross- script phonological priming effect could be observed in ERP data, and to explore the time course of such an effect. A second goal was to see if we could provide evidence as to whether cross-script phonological priming effects arise at lexical or sublexical phonological levels. Before presenting our study, we first review the few existing studies that have used a cross-language masked phonological priming paradigm with bilinguals whose languages use different writing systems. All of these studies collected behavioral data only.
Cross-script phonological priming studies
In several studies, the two languages of the bilinguals were both alphabetic, but the alphabets differed. Gollan, Forster and Frost (Reference Gollan, Forster and Frost1997) found that Hebrew–English bilinguals made faster lexical decisions on English words preceded by phonologically similar translation primes (cognates) compared to dissimilar Hebrew translation primes, and the same was observed for English–Hebrew bilinguals who saw English primes and Hebrew targets. Likewise, Voga and Grainger (Reference Voga and Grainger2007) demonstrated that Greek–French bilinguals had faster lexical decision latencies to French words when they were preceded by primes that were similar in meaning and pronunciation than primes that were similar in meaning only. These findings provide evidence that when primes and targets share meaning, phonological similarity enhances activation of the target. Gollan et al. (Reference Gollan, Forster and Frost2007) hypothesized that access to the cognate prime generated a phonological code that was similar to that of the target, which produced more rapid recovery of the phonological structure of the target than when the prime was not related phonologically. That is, they suggested that what was primed was the procedure of phonological computation for the target. They noted, however, that this hypothesis needed further investigation. One question is whether this priming mechanism would be effective when primes and targets are not related semantically.
Dimitropoulou, Duñabeitia and Carreiras (Reference Dimitropoulou, Duñabeitia and Carreiras2011) provided evidence of cross-script phonological priming even when primes and targets did not share meaning. In their study, Greek–Spanish bilinguals performed a Spanish lexical decision task. Dimitropoulou et al. were also able to include a manipulation of orthographic similarity because Greek and Spanish alphabets share a few letters. They examined cross-language priming for phonologically related primes and targets (P+). The orthography (O) of the primes and targets either did share some letters (O+P+) or did not share letters (O–P+). The comparison condition used unrelated primes (O–P–). They found no facilitation for targets that had some orthographic overlap with their primes (e.g., óριο–ocio /orio–oθio/ “limit–leisure”), although they did find facilitation when there was phonological overlap only (e.g., μωρó–mora /moro–mora/ “baby–dwells”). The authors suggested that the lack of a priming effect in the O+P+ condition occurred because competition between the orthographic representations of the prime and target eliminated the benefits of similar phonology. They suggested further that phonological priming effects may be more readily observed when the language pairs of a bilingual are very different orthographically, and therefore unlikely to compete with one another.
Several studies have investigated cross-script phonological priming using pairs of languages in which one language is not alphabetic. Lee, Nam and Katz (Reference Lee, Nam and Katz2005) tested Korean–English bilinguals. Korean script represents spoken syllables instead of phonemes. Participants were quicker to name English target words when they were preceded by a Korean pseudoword that sounded similar than when preceded by a pseudoword that sounded different. However, their prime durations were relatively long (140 ms and 250 ms), so participants would have been able to see that the experiment involved two languages. Nonetheless, Kim and Davis (Reference Kim and Davis2003) also tested Korean–English bilinguals using a 50 ms prime duration, and found similar results. Target naming latencies were faster when Korean prime words were homophonic to English target word than when they were unrelated. Similarly, using Chinese, which has a logographic script, Zhou, Chen, Yang and Dunlap (Reference Zhou, Chen, Yang and Dunlap2010) found that Chinese–English bilinguals had faster naming latencies on English target words when they were preceded by phonologically related Chinese prime words than unrelated Chinese words. These studies suggest that cross-script phonological priming is found when explicit phonological activation is required by the task. Both Kim and Davis (Reference Kim and Davis2003) and Zhou et al. (Reference Zhou, Chen, Yang and Dunlap2010) also conducted lexical decision versions of their experiments. Kim and Davis found an 18 ms phonological priming effect that was not statistically significant, whereas Zhou et al. found a 21 ms phonological priming effect that was significant. Zhou et al. argued that their cross-language phonological priming effect originated from lexical level phonological similarity because the pronunciation of Chinese characters cannot be obtained using spelling–sound correspondences.
The locus of phonological priming effects in the BIA+ model
If indeed Zhou et al.'s (2010) facilitatory cross-script phonological priming effect arises at the lexical phonological level, then it would be problematic for the BIA+ model because word nodes are presumed to inhibit one another, even across languages. Indeed, in a simulation of masked priming using only the orthographic part of the BIA+ model, Dijkstra, Hilberink-Schulpen and Van Heuven (Reference Dijkstra, Hilberink-Schulpen and Van Heuven2010) showed that the model produced an inhibitory priming effect when primes were English words and targets were Dutch orthographic neighbor words (see their Figure 7, presented in Supplementary Materials Online accompanying the electronic version of their article, journals.cambridge.org/bil). Similarly, if a prime activates its corresponding node in the lexical phonological store, that node would then inhibit the activation of nodes for other words, including the node for the target word in the other language. If that was the case, then an inhibitory phonological priming effect should be observed. All of the cross-script phonological priming effects reported above were facilitatory. One would have to assume that lexical phonological representations send excitatory activation to the nodes of similar sounding words if cross-script phonological priming effect were due just to activation at the lexical phonological level, according to the BIA+ model.
Another source of the phonological priming effect in the BIA+ model is the activation of common sublexical phonological representations (see Figure 1 above). In alphabetic and syllabic languages, the prime would activate sublexical orthographic nodes, and these would send activation to sublexical phonological nodes that were consistent with the activated letters or syllables. If the subsequently presented target word activated the same sublexical phonological nodes, then facilitation would be expected if responding is based on sublexical phonological activation. In Chinese, and in other languages, the sublexical phonological representations corresponding to the prime could also be activated by feedback from lexical phonological representations to sublexical phonological representations. It is quite plausible that naming responses are based on sublexical activation, and therefore the BIA+ model appears to be able to account for the facilitatory cross-script phonological priming effect in the three naming studies described above (Kim & Davis, Reference Kim and Davis2003; Lee et al., Reference Lee, Nam and Katz2005; Zhou et al., Reference Zhou, Chen, Yang and Dunlap2010). It is less obvious that lexical decision responses, which were the dependent measure in the remaining studies discussed above, are based on sublexical phonological activation. If lexical decisions to targets are based on activation of either the phonological or the orthographic lexical nodes that is received from sublexical phonological nodes, facilitation would arise only if lexical nodes for targets received little inhibition from lexical nodes for primes. Dijkstra et al. (Reference Dijkstra, Hilberink-Schulpen and Van Heuven2010) did show that the orthographic neighbor priming effect changed from inhibitory to facilitatory in later blocks of trials in which targets were repeated. Their explanation for this finding was that the resting levels of the lexical nodes for targets were increased by repetition, making the target words less vulnerable to competition from other lexical orthographic nodes. The facilitation came from sublexical orthographic overlap between primes and targets. This finding demonstrates that lexical competition is responsible for inhibitory priming effects in the BIA+ model. A sublexical phonology account of the facilitatory phonological priming effect in lexical decision would have to explain why there is little or no competition between lexical nodes for the prime and target even when target words are not repeated.
Evidence concerning the locus of cross-script phonological priming effects
A finding by Zhou et al. (Reference Zhou, Chen, Yang and Dunlap2010) provides a hint that their phonological priming effect may indeed have arisen from sublexical phonological activation. Zhou et al. showed that the priming effect did not interact with English proficiency in either the naming or lexical decision versions of their experiment. One might expect that more and less proficient participants would differ in the ease with which English lexical nodes were activated. Furthermore, in the Dimitropoulou et al. (Reference Dimitropoulou, Duñabeitia and Carreiras2011) study mentioned previously, masked phonological priming effects were of similar magnitude with L2 primes and L1 targets as with L1 primes and L2 targets, even though their bilinguals were not equally proficient in the two languages. They concluded that the finding that the priming effect was independent of relative frequency of use of L1 and L2 words suggests that it is “exclusively dependent on the baseline level of activation of the individual phonemes at the sublexical level” (Dimitropoulou et al., Reference Dimitropoulou, Duñabeitia and Carreiras2011, p. 196). However, Gollan et al. (Reference Gollan, Forster and Frost1997) found a cross-language phonological priming effect only in the L1 to L2 direction, and not the reverse, for both Hebrew–English and English–Hebrew participants. They suggested that the lack of a phonological priming effect for L1 targets may have occurred because participants relied less on phonological assembly when reading in their L1 than in their L2. Because both the absence and the presence of an interaction of phonological priming with proficiency are consistent with a sublexical explanation of the locus of the phonological priming effect, converging evidence from another marker of lexical vs. sublexical processing is needed.
Further evidence that the cross-script priming effect may arise from the activation of sublexical phonological representations common to both the prime and the target comes from a recent study by Nakayama, Sears, Hino and Lupker (Reference Nakayama, Sears, Hino and Lupker2012). They conducted a masked phonological priming study with Japanese–English bilinguals. Japanese and English are a particularly interesting pair of languages to study when addressing the issue of integrated vs. separate representations. One reason is that the writing systems are very different. The second reason is that they are quite different phonologically. English has been characterized as having a stress timed rhythmical pattern whereas Japanese has a mora timed pattern. Research with newborn infants has shown that they can discriminate between English and Japanese (Nazzi, Bertoncini & Mehler, Reference Nazzi, Bertoncini and Mehler1998). Therefore, it is quite possible that Japanese–English bilinguals use rhythmical differences between the two languages to create separate phonological stores. Despite these differences between English and Japanese, Nakayama et al. found that participants’ lexical decisions to English target words were 30 ms faster when they were preceded by a phonologically related Katakana prime than when they were preceded by an unrelated Katakana prime, a difference that was statistically significant. They concluded that Japanese–English bilinguals have a shared phonological store, or if they have separate phonological stores, there are strong links between them. Furthermore, the cross-script phonological priming effect was unaffected either by the English fluency of the participants or by the frequency of the target words. The authors argued that these findings provided evidence that the phonological priming effect was sublexical. However, because these interaction results are null effects statistically, further evidence is needed.
The present study
The goal of the current study was to investigate the time course of cross-script phonological activation using ERPs and distributional analyses of lexical decision responses, and to determine whether this information could provide further evidence as to whether cross-script phonological priming effects arise at lexical or sublexical phonological levels. We used Katakana primes and English target words from the Nakayama et al. (Reference Nakayama, Sears, Hino and Lupker2012) study in a masked priming paradigm with an English lexical decision task, and collected ERP data as Japanese–English bilinguals did the task. The frequency effect was used as a marker of lexical processing. If the phonological priming effect arises earlier than the frequency effect in Japanese–English bilinguals, such a finding would imply that sublexical phonological activation is responsible for the phonological priming effect.
Grainger and Holcomb (Reference Grainger and Holcomb2009; see also Massol, Grainger, Dufau & Holcomb, Reference Massol, Grainger, Dufau and Holcomb2010) made a proposal concerning how various word recognition processes in their model mapped on to ERP components. They suggested that the N250 reflects pre-lexical form level processing, including mapping sublexical orthographic representations onto sublexical phonological representations, whereas processing within the lexical system was assumed to be reflected in the P325 component. If this proposal is correct, and if the phonological priming effect reflects sublexical phonological activation, we would expect to see cross-language phonological priming effects in our study in the N250 and frequency effects in the P325 component.
A few studies have collected ERP responses in a masked phonological priming paradigm. Consistent with their theoretical proposal, Grainger, Kiyonaga and Holcomb (Reference Grainger, Kiyonaga and Holcomb2006) observed that a difference between English target words that were preceded by pseudohomophone primes compared to pseudoword primes first arose in a 250–300 ms window after the target onset in anterior electrodes. In a similar Spanish study, Carreiras, Perea, Vergara and Pollatsek (Reference Carreiras, Perea, Vergara and Pollatsek2009) found a phonological priming effect starting in a 350–500 ms time window. In a masked onset priming study in which participants named target words, Timmer and Schiller (Reference Timmer and Schiller2012) found a phonological priming effect in a 180–280 time window in central and posterior electrodes, but even earlier, in a 120–180 ms window in frontal electrodes, for L2 English speakers.
Estimates of the timing of word frequency effects in single word ERP studies with a concurrent lexical decision task vary considerably from study to study. In Spanish studies, Barber, Vergara and Carreiras (Reference Barber, Vergara and Carreiras2004) and Carreiras, Vergara and Barber (Reference Carreiras, Vergara and Barber2005) found frequency effects first appeared in a 350–500 ms time window. However, Hauk and Pulvermüller (Reference Hauk and Pulvermüller2004) reported a frequency effect as early as 150–190 ms after stimulus onset and then again in a 320–360 time window (for frequency effects before 200 ms see also Braun, Hutzler, Ziegler, Dambacher & Jacobs, Reference Braun, Hutzler, Ziegler, Dambacher and Jacobs2008; Sereno, Rayner & Posner, Reference Sereno, Rayner and Posner1998). None of these studies used a masked priming procedure, as was used here. It was unclear, then, whether phonological priming effects would be observed before frequency effects when both effects were examined in the same masked priming experiment.
The second way in which we investigated the relative timing of phonological priming and frequency effects was by conducting distributional analyses of the lexical decision response latencies. Reingold, Reichle, Glaholt and Sheridan (Reference Reingold, Reichle, Glaholt and Sheridan2012) developed a survival analysis technique that reveals the earliest point in time at which latencies for two conditions diverge significantly (see also Sheridan, Rayner & Reingold, 2013; Sheridan & Reingold, 2012a, b). That is, the divergence point for two conditions of an independent variable corresponds to the time at which the independent variable begins to have a significant impact. They applied the technique to frequency effects in eye fixation data, and observed that first fixation latencies for high and low frequency words diverged significantly at 145 ms under normal reading conditions (i.e., when there was a valid parafoveal preview of the target word), and at 256 ms in an invalid preview condition. Here we compared the divergence point for phonologically similar vs. dissimilar primes with the divergence point for high vs. low frequency words. This is the first time that this survival analysis technique has been applied to lexical decision responses. If responses in a lexical decision task are based on activation in a lexical store, then we would expect that frequency would have a significant impact on all or almost all responses; in other words the divergence point between high frequency words and low frequency words should be very early. In contrast, if responses are based primarily on sublexical activity, then the divergence point for high and low frequency words might be quite a bit later, affecting fewer responses in the distribution. Critical here is whether the response distributions for targets preceded by phonologically similar and dissimilar primes diverge before, at the same time, or after the divergence point for frequency. If responses are based on sublexical phonological activation, we would expect the distributions for phonological similarity to diverge well before those for frequency. If responses are based on lexical phonological activation, then we would expect the response distributions for frequency and phonological similarity to diverge at approximately the same time. Alternatively, responses might not be based directly on the activation level in one of the phonological stores. Instead, responses could be based primarily on activity in the orthographic lexical nodes. If these orthographic lexical nodes receive feedback from sublexical phonological nodes via sublexical orthographic nodes, then we would expect the divergence point for frequency to occur earlier than the divergence point for phonological similarity.
Method
Participants
Forty Japanese–English bilinguals (33 female; mean age = 29.1 years, SD = 8.57) residing in London, Canada, participated in the experiment. All of them reported that their first and dominant language was Japanese, and that they used English as their second language. They were all right-handed and had normal or corrected to normal vision. Participants were paid $20 CAD for their time.
Stimuli
All word and nonword stimuli were taken from Nakayama et al. (Reference Nakayama, Sears, Hino and Lupker2012). There were 120 English word targets and 120 nonword targets. Half of the words were low frequency words (M = 14.9 occurrences per million, SD = 9.6; Kučera & Francis, Reference Kučera and Francis1967) and half were high frequency words (M = 204.3 occurrences per million, SD = 149.7). The high and low frequency words were matched with respect to mean word length (4.6 vs. 4.7 letters, respectively) and mean number of orthographic neighbors (6.4 and 6.4, respectively). Each target (e.g., guide) was paired with two types of Japanese Katakana word primes: (i) a phonologically similar prime (サイド /saido/, borrowed from the English word side), and (ii) a phonologically dissimilar prime (コール /coru/, borrowed from the English word call). The phonologically similar primes had a mean of 43.8% of phonemes (SD = 17.6) in common with their targets, assuming that the English targets are pronounced as they would be by a native speaker of English (e.g., /saido/ vs. /gaid/). However, this figure underestimates the actual overlap for individuals who have a Japanese accent in their English pronunciations. For example, the English target word guide is likely to be pronounced as /gaido/ by a Japanese speaker, making the overlap with /saido/ three phonemes instead of two.
The filler nonword targets were selected from the English Lexicon Project database (Balota, Yap, Cortese, Hutchison, Kessler, Loftis, Neely, Nelson, Simpson & Treiman, Reference Balota, Yap, Cortese, Hutchison, Kessler, Loftis, Neely, Nelson, Simpson and Treiman2007) and were matched to the word targets with respect to length and number of neighbors (M = 4.8 and 6.2 respectively). Nonwords each had a Katakana word prime. There were two experimental lists and each participant received only one of them during the experiment. A target word that was preceded by a phonologically related prime on one list was preceded by an unrelated prime on the other list. Half of the unrelated prime–target pairs and half of the related pairs appeared on each list.
Procedure
Each participant was tested individually. The experiment was programmed using E-Prime (Version 2.0; Schneider, Eschman & Zuccolotto, Reference Schneider, Eschman and Zuccollotto2002). Stimuli were presented on a 17-inch CRT monitor. At the beginning of each trial, a fixation sign (- -) was presented for 500 ms. Subsequently, a forward mask made of scrambled letters (see Hoshino, Midgley, Holcomb & Grainger, Reference Hoshino, Midgley, Holcomb and Grainger2010) was presented for 500 ms. Then a prime was presented in the Katakana script (which does not have upper and lower case characters) in 36 pt MS Mincho font for 50 ms. Finally, the English target was presented in 48 pt MS Mincho font in lower-case letters. It remained on the display until the participant made a response or for a maximum of 1500 ms. The inter-trial interval was 1500 ms.
The task was to make an English lexical decision on the target. Participants were instructed to make their decisions as quickly and accurately as possible by pressing the word or nonword button on a response box placed in front of them. Participants completed 16 practice trials to familiarize themselves with the task prior to the data collection. The session was divided into two parts and each part took approximately 10 minutes. The order of stimuli within a block was randomized for each participant. The participants took a short break between blocks. The decision latencies, accuracy, and electroencephalogram (EEG) were recorded.
EEG data were recorded at 512 Hz through the Active-Two Biosemi system with a 32-channel cap (Electro-cap, Inc, Eaton, OH). Electro-oculogram (EOG) activity was recorded from active electrodes placed above, beside, and beneath the left eye, and beside the right eye. An additional active electrode (CMS – common mode sense) and a passive electrode (DRL – driven right leg) were used to comprise a feedback loop for amplifier reference. Two additional electrodes were placed at the left and right mastoids for offline re-reference. The trials were epoched into 1000 ms trial intervals that ranged from 200 ms prior to the onset of the target word to 800 ms after the onset of the target word. The epochs were baseline corrected to the 200 ms pre-stimulus onset. Response latencies were recorded online along with the EEG data.
ERPs were pre-processed offline using the EMSE Software (Source Signal Imaging, San Diego, CA). The 32 channels were referenced to the left and right mastoids and EEG activity were band-pass filtered (0.1–30 Hz). Trials containing blinks and other nonocular artifacts (EEG activity exceeding ±75 μV at any electrode) were discarded.
Results
The data from eight participants were excluded from all analyses. One participant had a very high error rate (>50%) on the lexical decision task. The remaining seven participants were excluded because of excessive noise in the ERP data (more than 30% of their trials exceeded ±75 μV at least one electrode). The analyses were therefore based on data from 32 participants (27 females, mean age = 29.4 years, SD = 8.24).
Behavioral analyses
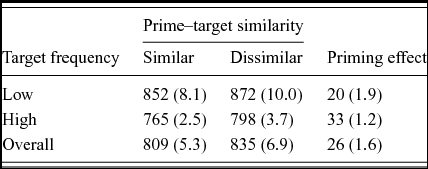
Two low frequency targets (i.e., radar, veil) were excluded from all analyses due to high error rates (>50%). Response latencies shorter than 300 ms or longer than 1700 ms were considered as outliers and excluded from the analysis (1.9% of all trials). Lexical decision latencies for correct responses on the English targets and error rates were analyzed using 2 (Phonological Similarity: similar, dissimilar) × 2 (Frequency: high, low) repeated measures ANOVAs. Analyses using both subject (F1 ) and item (F2 ) means were carried out. In the subject analyses, Phonological Similarity and Frequency were within subject factors. In the item analyses, Phonological Similarity was a within item factor and Frequency was a between item factor. A list (or item group) factor was included. Table 1 shows the summary of mean response latencies and error rates from the subject analyses.
Mean lexical decision latencies in milliseconds (and percentage errors).
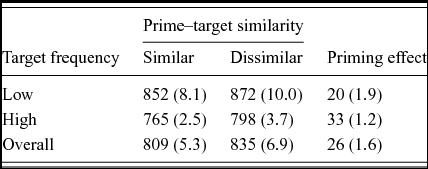
In the decision latency data, there was a main effect of phonological similarity, F1 (1,30) = 14.83, MSE = 1534.9, p < .001, η2 = .33; F2 (1,114) = 18.68, MSE = 2604.0, p < .001, η2 = .14. Participants responded significantly faster to the target words when the prime words were phonologically similar (809 ms) compared to when they were phonologically dissimilar (835 ms). Furthermore, there was a main effect of frequency, F1 (1,30) = 269.84, MSE = 772.2, p < .001, η2 = .90; F2 (1,114) = 18.68, MSE = 2604.0, p < .001, η2 = .17. High frequency targets were responded to faster (781 ms) than low frequency targets (862 ms). There was no interaction between phonological similarity and frequency, F1 (1,30) = 1.46, MSE = 1076.9, ns, η2 = .05; F2 < 1.
In the error data, the main effect of phonological similarity approached significance by subjects, F1 (1,30) = 4.02, MSE = .002, p < .055, η2 = .11, and was significant by items, F2 (1,114) = 4.54, MSE = .003, p < .05, η2 = .04. The error rates were slightly lower in the similar condition (5.3%) than in the dissimilar condition (6.9%). There was a main effect of frequency, F1 (1,30) = 23.22, MSE = .005, p < .001, η2 = .44; F2 (1,114) = 22.41, MSE = .009, p < .001, η2 = .16. Low frequency targets were more error prone (9.1%) than high frequency targets (3.1%). Finally, there was no interaction effect between similarity and frequency, Fs < 1.
Analyses by proficiency
Analyses were conducted to determine whether the size of the phonological priming effect depended on participants’ fluency in English. In one analysis, participants’ self-ratings of English proficiency were used. Their ratings from 1 to 10 on the four English skills (speaking, listening, reading, and writing) were averaged, and then a median split was used to create a high proficiency group (M = 7.2) and a low proficiency group (M = 4.5). ANOVAs were the same as above except a between subject variable of Proficiency was added. The interaction of phonological similarity and proficiency was not significant either in the decision latency data or in the error data, Fs < 1. In the second analysis, two proficiency groups were created by first calculating overall mean decision latencies on the English target words for each participant, and then performing a median split to obtain a group of fast responders (M = 734 ms) and a group of slow responders (M = 910 ms). Again, the interaction of phonological similarity and proficiency was not significant either in the decision latency data, F < 1, or in the error data, F(1,30) = 1.57, MSE = .002, ns, η2 = .05.
Response distribution analyses
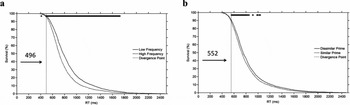
To examine the relative time course of the phonological priming effect and the frequency effect, we employed the survival analysis technique that was introduced by Reingold et al. (Reference Reingold, Reichle, Glaholt and Sheridan2012). Similarly to the above analyses of mean response latencies, the survival analysis was based on the correct responses only. However, the survival analysis employed the full temporal range of response latencies (i.e., no outliers were rejected). Specifically, for each 1 ms time bin t (t was varied from 0 to 2500 ms), the percentage of response latencies with a duration greater than t constituted the percent survival at time t. The survival curves were computed separately for the high vs. low frequency conditions and for the phonologically similar vs. dissimilar prime conditions. For each of these conditions, the survival curves were computed separately for each participant and then averaged across participants.
As can be seen from Figure 2, the survival curves appear to diverge for both the word frequency manipulation (see Panel a) and the phonological priming manipulation (see Panel b). As previously argued by Reingold et al. (Reference Reingold, Reichle, Glaholt and Sheridan2012), these divergence points correspond by definition to the shortest time point at which the experimental manipulations had a significant impact. Following Reingold et al. (Reference Reingold, Reichle, Glaholt and Sheridan2012), we estimated these divergence points using a bootstrap re-sampling procedure (Efron & Tibshirani, Reference Efron and Tibshirani1994). Specifically, on each iteration of this procedure, the set of observations (lexical decision response latencies) for each participant in each condition was randomly re-sampled with replacement. For each iteration of the bootstrap procedure, an individual participant's survival curves were then computed and averaged. Next, we calculated the differences across conditions for each 1 ms bin, by subtracting the high frequency survival curve from the corresponding value in the low frequency survival curve, and by subtracting the similar prime survival curve from the corresponding value in the dissimilar prime survival curve. This procedure was repeated 10,000 times, and the obtained differences for each bin were then sorted in order of magnitude. The range between the 5th and the 9,995th value was then defined as the confidence interval of the difference for each bin (given the multiple comparisons we performed, we used this conservative confidence interval in order to protect against making a Type I error). To compute the divergence points, we identified the time bins for which the low frequency survival rate was significantly greater than the high frequency survival rate (i.e., for which the lower bound of the confidence interval of the difference between the low and high frequency curves was greater than zero), and the time bins for which the dissimilar prime survival rate was greater than the similar prime survival rate (i.e., for which the lower bound of the confidence interval of the difference between the dissimilar and similar prime curves was greater than zero). The divergence points were then defined as the earliest significant difference point that was part of a run of five consecutive significant difference points (significant differences between the curves are shown in Figure 2 as a row of asterisks above the survival curves).
Survival curve distributions of lexical decision response latencies for the bilingual participants in the high and low frequency conditions (Panel a) and in the phonologically similar and dissimilar prime conditions (Panel b). The row of asterisks at the top of each panel indicates the time bins with a significant difference between the survival curves. See text for further details.

As shown in Figure 2, the divergence point was 56 ms earlier for the word frequency effect (Panel a) than for the phonological priming effect (Panel b). Specifically, the high and the low frequency survival curves significantly diverged at a duration of 496 ms, and the similar and dissimilar prime survival curves significantly diverged at a duration of 552 ms. Furthermore, the divergence point defines the percentage of response latencies that were too short to exhibit an influence of the experimental manipulation. The percentage of response latencies that were shorter than the divergence point was 4% for the word frequency effect, and 10% for the phonological priming effect. These percentages indicate that the vast majority of response latencies were affected by both the word frequency manipulation and the phonological similarity manipulation.
ERP analyses
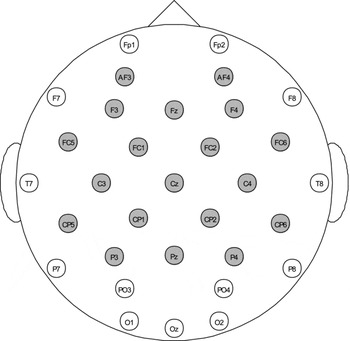
The data from the most central 19 electrodes were included in the analyses (see Figure 3). Sixteen participants had seen each experimental list. The data loss due to signal noise for these 32 participants was 15.6% of trials.
Electrode montage. Dark circles indicate electrodes included in the analyses.

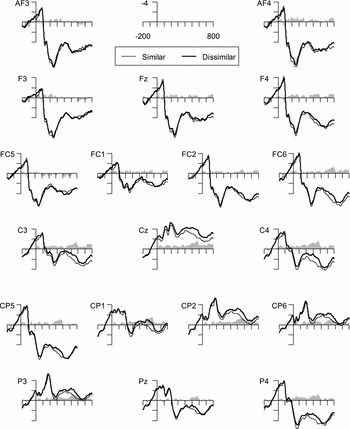
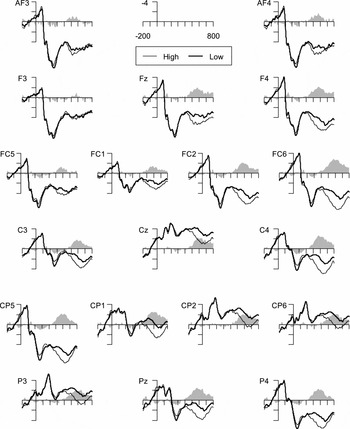
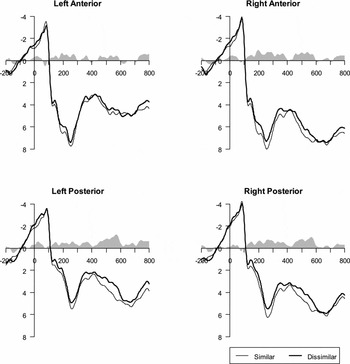
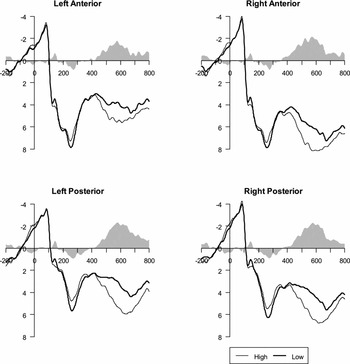
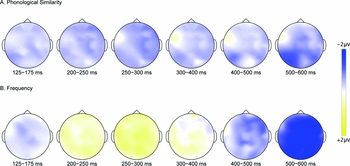
Figure 4 shows the grand average waveforms for each electrode for phonologically similar vs. dissimilar conditions, and Figure 5 shows the grand average waveforms for each electrode for high vs. low frequency words. Mean amplitudes in six time windows (125–175 ms, 200–250 ms, 250–300 ms, 300–400 ms, 400–500 ms, and 500–600 ms after the target onset) were analyzed. Separate repeated measures ANOVAs for each time window were conducted with factors of Phonological Similarity (similar, dissimilar), Frequency (high, low), and Electrode. A list (or item group) factor was included. Analyses were first conducted with all 19 electrodes, and then were performed separately for four groups of electrodes, in the anterior left (AF3, F3, FC5, FC1), anterior right (AF4, Fz, F4, FC2, FC6), posterior left (C3, CP5, CP1, P3, Pz), and posterior right (Cz, C4, CP2, CP6, P4). Average waveforms for each of these electrode groups are shown in Figure 6 for phonologically similar vs. dissimilar conditions and Figure 7 for high vs. low frequency words. Figure 8 displays voltage maps showing the spatial distributions of these effects over the scalp.
Grand average waveforms in the phonologically similar vs. dissimilar conditions by electrode.

Grand average waveforms in the high frequency vs. low frequency conditions by electrode.

Grand average waveforms in the phonologically similar vs. dissimilar conditions by region.

Grand average waveforms in the high frequency vs. low frequency conditions by region.

Voltage maps for bilingual participants showing the spatial distributions of (A) the effect of phonological similarity and (B) the effect of frequency.

125–175 ms
There were no significant effects in this time window, either across all 19 electrodes or in any of the four regions.
200–250 ms
In the analysis with all 19 electrodes, the main effect of phonological similarity approached significance, F(1,30) = 3.71, MSE = 44.6, p < .07, η2 = .11. The main effect of frequency was not significant, F(1,30) = 1.83, MSE = 50.5, ns, η2 = .06, nor was the interaction of similarity and frequency, F < 1. In the analyses by regions, the effect of phonological similarity was significant in the anterior right electrodes, F(1,30) = 5.80, MSE = 11.4, p < .05, η2 = .16, and approached significance in the posterior right electrodes, F(1,30) = 3.75, MSE = 13.0, p = .06, η2 = .11. There was no effect of phonological similarity in the other two regions, nor was there a significant effect of frequency in any of the four regions.
250–300 ms
In the analysis with all 19 electrodes, the main effect of phonological similarity was significant, F(1,30) = 5.37, MSE = 38.5, p < .05, η2 = .15, as was the main effect of frequency, F(1,30) = 5.05, MSE = 56.9, p < .05, η2 = .14. The interaction of similarity and frequency was not significant, F < 1. In the analyses by regions, the effect of phonological similarity was significant in anterior right electrodes, F(1,30) = 6.28, MSE = 13.4, p < .02, η2 = .17, and in posterior right electrodes, F(1,30) = 7.71, MSE = 10.7, p < .01, η2 = .20. The effect of frequency was significant in posterior left electrodes, F(1,30) = 6.87, MSE = 14.4, p < .02, η2 = .19, and in posterior right electrodes, F(1,30) = 5.21, MSE = 17.7, p < .05, η2=.15.
300–400 ms
There were no significant effects in this time window, either across all 19 electrodes or in any of the four regions, although the phonological similarity effect approached significance in anterior right electrodes, F(1,30) = 3.22, MSE = 12.0, p < .09, η2 = .10, and in posterior right electrodes, F(1,30) = 3.47, MSE = 12.0, p < .08, η2=.10.
400–500 ms
In the analysis with all 19 electrodes, the main effect of phonological similarity was not significant, F(1,30) = 2.17, MSE = 51.1, ns, η2 = .07, but the main effect of frequency approached significance, F(1,30) = 3.47, MSE = 64.6, p < .08, η2 = .10. The interaction of similarity and frequency was not significant, F < 1. In the analyses by regions, the effect of phonological similarity was not significant in any of the analyses. The effect of frequency was significant in the anterior right electrodes, F(1,30) = 6.88, MSE = 19.5, p < .02, η2 = .19, and approached significance in the posterior right electrodes, F(1,30) = 3.49, MSE = 19.1, p = .07, η2=.10.
500–600 ms
In the analysis with all 19 electrodes, the main effect of phonological similarity was significant, F(1,30) = 6.78, MSE = 47.0, p < .02, η2 = .18, as was the main effect of frequency, F(1,30) = 28.40, MSE = 66.6, p < .001, η2 = .49. The interaction of similarity and frequency was not significant, F < 1. In the analyses by regions, the effect of phonological similarity was significant in all regions except the anterior left, and the frequency effect was significant in all regions.
Monolingual English controls
Monolingual English-speaking participants were also tested. They did not show a phonological priming effect, either in the behavioral or in the ERP data, but they did show a significant effect of word frequency in both measures (for details, see Supplementary Materials Online accompanying the electronic version of this article, journals.cambridge.org/bil). These results allow us to be more confident in concluding that the phonological priming effect in bilinguals was due to their knowledge of Japanese and not to some other unknown property of the materials.
Discussion
The goal of the current study was to investigate cross-script phonological activation in Japanese–English bilinguals. In particular, the novel aspect of the study was our use of ERPs and distributional analyses of lexical decision responses to examine the time course of cross-script phonological activation relative to the frequency effect. The aim was to obtain evidence as to whether cross-script phonological priming effects arise from lexical or sublexical phonological activation.
Katakana primes did indeed facilitate lexical decisions for phonologically similar English target words in Japanese–English bilinguals. Their decision latencies were 26 ms faster on English words preceded by phonologically similar Katakana primes than on English words that were preceded by dissimilar primes. This finding provides evidence of a link between Japanese and English phonological representations despite the fact that the two languages are quite different phonologically (mora timed vs. stress timed, respectively). Furthermore, in the lexical decision latency data there was no interaction between the priming effect and either word frequency or English proficiency. These findings are consistent with Nakayama et al. (Reference Nakayama, Sears, Hino and Lupker2012) and provide evidence for the view that the phonological priming effect involved sublexical phonology. However, because the interaction results are null effects, we sought further evidence regarding the locus of phonological priming effects by examining the relative time course of phonological priming and frequency effects.
One way that the relative time course of phonological priming and frequency effects was investigated was through the use of ERPs. In the ERP data, a significant phonological priming effect was observed in the 200–250 ms time window, whereas the first window in which a frequency effect was observed was the subsequent time window, 250–300 ms. Furthermore, the phonological priming effect in the 200–250 ms time window was unaffected by word frequency. The finding of a phonological priming effect before a frequency effect is consistent with idea that the phonological priming effect involves sublexical phonological activation, as is the observation that this early cross-language phonological priming effect did not interact with frequency in the ERP data.
The second way in which the time course of phonological priming and frequency effects was examined was through the application of Reingold et al.'s (2012) survival analysis of latency distributions, which they used on eye fixation latencies, to our lexical decision latency data. Survival analyses indicated that the divergence point for the frequency effect was early (496 ms), affecting 96% of responses. Such a finding suggests that lexical decision responses were based on activity in a lexical store. Furthermore, the divergence point for the frequency effect was 56 ms earlier than the divergence point for the phonological priming effect (552 ms). These results can be explained by assuming that lexical decisions were based on activity in the orthographic lexicon, and that the orthographic lexicon received feedback from sublexical phonological nodes via sublexical orthographic nodes. The fastest 10% of responses were too quick to be influenced by this feedback, but the other 90% of responses were affected by the feedback. If responses had been based on activity in the phonological lexicon, we would have expected the divergence points for frequency and phonological similarity to be about the same. The idea that the lexical decision results reflect relatively later processing is consistent with the ERP data from the 400–600 ms time window. A frequency effect, but no phonological priming effect was observed in the 400–500 ms time window, and a phonological priming effect emerged again in the 500–600 ms time window.
Relation to previous cross-script phonological priming studies
The finding of a cross-script phonological priming effect in a lexical decision task is consistent with other studies that have used a variety of language pairs (Dimitropoulou et al., Reference Dimitropoulou, Duñabeitia and Carreiras2011; Gollan et al., Reference Gollan, Forster and Frost1997; Kim & Davis, Reference Kim and Davis2003; Nakayama et al., Reference Nakayama, Sears, Hino and Lupker2012; Voga & Grainger, Reference Voga and Grainger2007; Zhou et al., Reference Zhou, Chen, Yang and Dunlap2010). Furthermore, the finding that the effect does not interact with language proficiency is in agreement with three previous lexical decision studies (Dimitropoulou et al., Reference Dimitropoulou, Duñabeitia and Carreiras2011; Nakayama et al., 2011; Zhou et al., Reference Zhou, Chen, Yang and Dunlap2010; but see Gollan et al., Reference Gollan, Forster and Frost1997), and the finding that the effect does not interact with word frequency replicates Nakayama et al.'s (2012) study. Dimitropoulou et al. (Reference Dimitropoulou, Duñabeitia and Carreiras2011), Gollan et al. (Reference Gollan, Forster and Frost1997), and Nakayama et al. (Reference Nakayama, Sears, Hino and Lupker2012) all suggested that the locus of the cross-script phonological priming effect is sublexical (but see Zhou et al., Reference Zhou, Chen, Yang and Dunlap2010). Our findings provide further support for this hypothesis.
Relation to previous ERP studies
Our findings are broadly consistent with ERP studies in which primes and targets were in the same language. The emergence of a significant phonological priming effect first in anterior electrodes is consistent with the results of Grainger et al.'s (2006) pseudohomophone priming study with monolingual participants and Timmer and Schiller's (2012) participants, who were reading in their second language. The time window in which the phonological priming effect first appeared varied in these studies, but is similar to the 200–250 ms window where it first appeared here. In Timmer and Schiller's (2012) study, the phonological priming effect was first significant for L2 readers in the 120–180 time window and for L1 readers in the 180–280 time window, and in Grainer et al.'s (2006) study it was first significant in the 250–300 ms time window. In the Timmer and Schiller (Reference Timmer and Schiller2012) study, targets preceded by related phonological primes produced greater positive deflections than targets preceded by unrelated primes, as was found here, whereas in Grainger at al.'s (2006) study, targets preceded by unrelated primes produced greater negative deflections in the N250 than targets preceded by related primes. In Carreiras et al.'s (2009) study, there was a hint of an anterior phonological priming effect in the 250–350 ms time window but the priming effect was not significant until the 350–550 ms time window. A phonological priming effect was also found in the N400 here and in the Grainger et al. (Reference Grainger, Kiyonaga and Holcomb2006) study, and in all three studies it was characterized by greater negative deflections for targets preceded by unrelated primes than targets preceded by phonologically related primes. The Carreiras et al. (Reference Carreiras, Perea, Vergara and Pollatsek2009) study was the only one of these studies to use a concurrent lexical decision task. Their phonological priming effect at 350–550 ms time window was similar in topography and timing to that found in the 500–600 ms time window here, and may also reflect feedback activation from phonology to orthographic representations.
The frequency effect first emerged here in the 250–300 ms time window with low frequency words showing greater positivity than high frequency words, and then it was significant again in the 400–500 ms time window, this time with low frequency words showing greater negativity than high frequency words. A similar frequency effect in the N400 has been shown in several other ERP studies that used a lexical decision task (e.g., Barber et al., Reference Barber, Vergara and Carreiras2004; Carreiras et al., Reference Carreiras, Vergara and Barber2005), and has been interpreted as indicating greater difficulty in lexical selection for low compared to high frequency words. However, there have been mixed results regarding an earlier frequency effect. Neither Barber et al. (Reference Barber, Vergara and Carreiras2004) nor Carreiras et al. (Reference Carreiras, Vergara and Barber2005) found an early frequency effect, but other researchers have (e.g., Hauk & Pulvermüller, Reference Hauk and Pulvermüller2004; Sereno et al., Reference Sereno, Rayner and Posner1998). Both Hauk and Pulvermüller (Reference Hauk and Pulvermüller2004) and Sereno et al. (Reference Sereno, Rayner and Posner1998) observed that waveforms for low frequency words were more negative than for high frequency words prior to 200 ms, and then were more positive just after 300 ms. The frequency effect first observed here in the 250–300 ms time window corresponds most closely to the latter finding. Furthermore, at approximately this time (150–300 ms), Midgley, Holcomb and Grainger (Reference Midgley, Holcomb and Grainger2009) observed a greater positive deflection for bilinguals reading L2 than L1 words. Grainger et al. (Reference Grainger, Kiyonaga and Holcomb2006) have suggested that the P325 component reflects processing at the level of whole word orthographic and phonological representations. The finding that this early frequency effect in our bilinguals was significant just at posterior electrodes suggests that it may reflect orthographic lexical processing.
Although our results are broadly consistent with previous ERP studies, it is somewhat puzzling that from 200–300 ms, low frequency words and targets preceded by phonologically related primes both produced larger positive deflections than high frequency words and targets preceded by unrelated primes. If larger deflections reflect greater effort, then that would imply that it was the target words that were preceded by the similar primes that were harder to process. However, the relationship between ERP waveforms and cognitive processes are not currently well worked out. It might be the case that the phonological priming effect and the frequency effect are of a different nature and not directly comparable in the early part of the waveform. Priming effects reflect the degree of overlap between the processing of the prime and the processing of the target (see Grainger & Holcomb, Reference Grainger and Holcomb2009). A larger positive deflection around 250 ms for related than unrelated primes has also been found, for example, in two other studies involving cross-script priming with Japanese participants (Hoshino et al., Reference Hoshino, Midgley, Holcomb and Grainger2010; Okano, Grainger & Holcomb, Reference Okano, Grainger and Holcomb2013). In contrast, the frequency effect reflects processing of the target itself. According to Hauk and Pulvermüller (Reference Hauk and Pulvermüller2004), ERP amplitudes typically increase with decreasing frequency. A further consideration of how ERP waveforms relate to the ease or difficulty of processing is beyond the scope of this paper and clearly requires further research. Instead, we focus on differences in waveforms between conditions, and the relative timing of phonological priming and frequency effects.
BIA+ model account
Performing a lexical decision task involves consulting either lexical orthographic nodes or lexical phonological nodes, or both. However, in the BIA+ model, lexical nodes are mutually inhibitory. As noted in the introduction, in a simulation of masked priming using only the orthographic part of the BIA+ model, Dijkstra et al. (Reference Dijkstra, Hilberink-Schulpen and Van Heuven2010) showed that the model produced an inhibitory priming effect when primes were English words and targets were Dutch orthographic neighbor words. To account for the results of the current study, the BIA+ model needs to explain why lexical competition did not cancel out sublexical phonological facilitation.
Two findings suggest that it is unlikely that bilingual participants made their lexical decisions based on lexical phonological activation. One is that phonological priming effects did not interact with frequency, and the second is that in the survival analyses, frequency effects arose 56 ms before phonological priming effects. We will assume then that lexical decisions are based on activation in the orthographic lexicon (as have, for example, Pexman, Lupker & Jared, Reference Pexman, Lupker and Jared2001). Because the script for Katakana differs from English, the prime would activate lexical orthographic nodes for Katakana words only (see Dijkstra & Van Heuven, Reference Dijkstra and Van Heuven2002, p. 183), and these would inhibit other lexical orthographic nodes. It is unclear whether lexical orthographic nodes for English words would receive inhibition. Dijkstra and Van Heuven (Reference Dijkstra and Van Heuven2002, p. 176) say that “at the word level, all words inhibit each other, irrespective of the language to which they belong”, which would seem to imply that activated Katakana lexical nodes would send inhibition to English lexical nodes. In later work, Dijkstra et al. (Reference Dijkstra, Hilberink-Schulpen and Van Heuven2010, p. 342) noted a modeling principle from Grainger and Jacobs (Reference Grainger and Jacobs1999), in which activated words “send inhibition to all other activated words”, which would imply that only Katakana word nodes would be inhibited. Concurrently, Katakana primes would activate corresponding sublexical phonological representations. When English target words were presented, they too would activate lexical orthographic nodes for words sharing any of the same letters. In addition, English target words with overlapping sublexical phonology with the prime would activate sublexical phonological representations more strongly and quickly than those whose phonology differed from the prime. Activation from sublexical phonological nodes would send activation back to corresponding sublexical orthographic nodes in either script, which would in turn pass activation to lexical orthographic nodes. The feedback would be stronger in the case of phonologically related than unrelated pairs, and there would be greater activation of Katakana lexical orthographic nodes, particularly that of the prime, from targets that shared phonology with the prime than those that did not. To predict the behavior of the model, it is critical to know the extent to which the lexical orthographic nodes for Katakana and English words would inhibit one another. If the inhibition is weak, a facilitatory phonological priming effect could be produced. In this view, the finding that the phonological priming effect arose earlier in the ERP data than the frequency effect and the observation that phonological priming did not interact with frequency at that time reflect initial sublexical phonological activation. The later phonological priming effect in the ERP data and the phonological priming effect in the lexical decision data would reflect the feedback from sublexical phonological nodes to orthographic nodes. In the monolingual literature, evidence for such a feedback mechanism has come from studies of homophone effects (Pexman et al., Reference Pexman, Lupker and Jared2001) and sound–spelling consistency effects (Stone, Vanhoy & Van Orden, Reference Stone, Vanhoy and Van Orden1997) in lexical decision.
Haigh and Jared (Reference Haigh and Jared2007) noted that the assumption of inhibitory lexical connections means that it is also a challenge for the BIA+ model to account for facilitatory interlingual homophone effects in lexical decision with same-script bilinguals (Haigh & Jared, Reference Haigh and Jared2007; Lemhöfer & Dijkstra, Reference Lemhöfer and Dijkstra2004). Ultimately, whether or not the BIA+ model can account for these facilitatory interlingual homophone and cross-language phonological priming effects will be known only when a full computational version of the model accurately simulates the results. Diependaele, Ziegler and Grainger (Reference Diependaele, Ziegler and Grainger2010) and Rastle and Brysbaert (Reference Rastle and Brysbaert2006) have argued that simulating fast phonological priming is a particularly challenging test for computational models of monolingual word recognition. In simulations of pseudohomophone priming of English target words using the Dual-Route Cascaded Model (Coltheart, Rastle, Perry, Langdon & Ziegler, Reference Coltheart, Rastle, Perry, Langdon and Ziegler2001), Rastle and Brysbaert (Reference Rastle and Brysbaert2006) found that the model was only successful if it was assumed that lexical decisions are always based on activation in the phonological lexicon rather than orthographic lexicon. Diependaele et al. (Reference Diependaele, Ziegler and Grainger2010) showed that the Bimodal Interactive Activation Model (on which the BIA+ model is based) could produce pseudohomophone priming effects on orthographic lexical activation. However, simulating pseudohomophone priming is not as strong a test of these models as is simulating phonological priming with word primes. That is because word primes have a node in the orthographic lexicon, unlike pseudowords, and word primes would also have their own node in the phonological lexicon, whereas pseudohomophones would be likely to activate the lexical phonological node for their related target. Lexical activation by the prime poses a challenge in obtaining facilitation for targets in models in which there is inhibition between lexical nodes. A solution that could help the BIA+ model to account for the current results is to assume, as do Davis and Lupker (Reference Davis and Lupker2006), that the amount of inhibition between two nodes in the orthographic lexicon depends on the degree of orthographic overlap, with more inhibition the greater the overlap. Nodes for Katakana words would not, therefore inhibit nodes for English words because there is no overlap between the scripts. This assumption would also account for Dimitropoulou et al.'s (Reference Dimitropoulou, Duñabeitia and Carreiras2011) finding of a cross-language phonological priming effect only when primes and targets were orthographically dissimilar. Although a similar assumption could be made for the phonological lexicon – that the amount of inhibition between two nodes depends on the degree of phonological overlap – such an assumption would not help account for facilitatory phonological priming effect observed here because lexical inhibition between the two languages would still be prevalent.
Conclusion and future direction
The current study provides evidence that even two languages that are as different orthographically and phonologically as Japanese and English are highly interconnected in bilinguals. We obtained evidence of cross-language phonological priming from Katakana to English as early as the 200–250 ms time window in the ERP data, and suggested that the effect was due to the activation of sublexical phonological representations in a store shared by both Japanese and English. A question that remains is whether similar results would also be found with Japanese Kanji primes. Since Katakana is primarily used to represent loan words, it is possible that the phonological representations associated with these words might have stronger connections to phonological representations of English words relative to words that are specific to Japanese, which are typically written in the Kanji script. Furthermore, Katakana is a transparent syllabary script, and so sublexical phonological representations may be activated particularly quickly for Katakana words compared to Kanji words. For example, Feldman and Turvey (Reference Feldman and Turvey1980) found that words that are typically printed in Kanji were named faster when they appeared in Katakana than in their usual Kanji form. In addition, there is evidence that the phonology of Kanji words is computed at the word level (Wydell, Butterworth & Patterson, Reference Wydell, Butterworth and Patterson1995), and many Kanji words have multiple pronunciations (a Kun reading and one or more On readings). These factors may contribute to weak or delayed activation of phonology by Kanji primes. A cross-script phonological priming effect from Kanji to English is likely, therefore, to be more difficult to find. Regardless of whether or not such a priming effect is found, the result will be informative regarding the extent to which Japanese–English bilinguals’ phonological representations for their two languages are in a single store.
There is some evidence that Kanji primes can activate representations that are used in the reading of English. Hoshino et al. (Reference Hoshino, Midgley, Holcomb and Grainger2010) have observed a masked translation priming effect with Kanji primes and English targets in the early ERP waveform of Japanese–English bilinguals, which they interpreted as reflecting feedback from semantic representations activated by the prime to form representations of the target. This study, along with Nakayama et al. (Reference Nakayama, Sears, Hino and Lupker2012) and the current study, have begun to reveal the processing dynamics involved in the truly remarkable ability of Japanese–English bilinguals to read fluently in alphabetic English in addition to reading the three Japanese scripts, two of which are syllabaries (Katakana, Hiragana) and one which is logographic (Kanji).