Introduction
In vertebrate photoreceptors, the visual pigment, rhodopsin, consists of the G protein-coupled receptor (GPCR), opsin, with an inverse agonist 11-cis retinal chromophore, covalently bound. Light isomerizes the 11-cis retinal chromophore to the all-trans form, which induces a conformational change in the opsin rendering it catalytically active. Activated visual pigment promotes the replacement of GDP bound to the G protein, transducin, with cytosolic GTP. Activated transducin stimulates cGMP phosphodiesterase (PDE) to hydrolyze cGMP. As the cGMP concentration decreases, cyclic nucleotide-gated (CNG) cation channels close and an inward Na+ current is blocked. This decrease in the “dark” or circulating current hyperpolarizes the photoreceptor and reduces the release of the neurotransmitter glutamate at the synapse (reviewed in Pugh & Lamb, Reference Pugh, Lamb, Stavenga, DeGrip and Pugh2000). All-trans retinal is eventually released from opsin, whereupon it is enzymatically reduced to vitamin A and transported out of the photoreceptor to the retinal pigment epithelium (RPE) to be reconverted to 11-cis retinal (reviewed in Lamb & Pugh, Reference Lamb and Pugh2004). “Free” apo-opsin possesses a low constitutive activity that decreases photoreceptor sensitivity to light (reviewed in Fain et al., Reference Fain, Matthews, Cornwall and Koutalos2001). During dark adaptation, rods and cones recover sensitivity after 11-cis retinal from the RPE enters their outer segments and regenerates their visual pigment. In a second pathway, Müller cells provide cones with 11-cis retinol, which they can oxidize to 11-cis retinal for visual pigment regeneration (reviewed in Fleisch & Neuhauss, Reference Fleisch and Neuhauss2010; Wang & Kefalov, Reference Wang and Kefalov2010).
The activity of opsin can be enhanced by retinoids such as all-trans retinal, vitamin A, 11-cis retinol, and a truncated analog, β-ionone (Yoshizawa & Fukada, Reference Yoshizawa and Fukada1983; Isayama et al., Reference Isayama, Chen, Kono, Degrip, Ma, Crouch and Makino2006; Kono et al., Reference Kono, Goletz and Crouch2008; Ala-Laurila et al., Reference Ala-Laurila, Cornwall, Crouch and Kono2009). Since β-ionone also slows, by direct competition, pigment regeneration, in which opsin binds 11-cis retinal (Matsumoto & Yoshizawa, Reference Matsumoto and Yoshizawa1975; Daemen, Reference Daemen1978), all changes in opsin activity were presumed to target the empty chromophore binding pocket. On the other hand, all-trans retinal does not slow pigment regeneration (Daemen, Reference Daemen1978; Jäger et al., Reference Jäger, Palczewski and Hofmann1996; Sachs et al., Reference Sachs, Maretzki, Meyer and Hofmann2000) raising the hypothesis for another binding site distinct from the chromophore binding pocket. In support of the hypothesis, it was recently reported that β-ionone activates cone visual pigments, in which the chromophore binding pocket is occupied by 11-cis retinal (Isayama et al., Reference Isayama, McCabe England, Crouch, Zimmerman and Makino2009). β-Ionone is not normally found in the retina, so to explore the possibility that a physiologically relevant retinoid might affect the course of dark adaptation, we investigated the interaction between vitamin A and rhodopsin using suction electrode recording and microspectrophotometry (MSP) of single rods from salamander and in vitro assays with purified bovine rod rhodopsin.
Materials and methods
Animals
Larval tiger salamanders (Ambystoma tigrinum; Charles D. Sullivan, Inc., Nashville, TN) were maintained in Holtfretter’s solution with salinity raised twofold on a 14-h light/10-h dark cycle at 16–20°C. Care and use of the salamanders conformed to the Association for Research in Vision and Ophthalmology Statement for the Use of Animals in Ophthalmic and Vision Research and to institutional guidelines.
Single-cell recording
Salamanders were dark adapted for a minimum of 15 h, to ensure complete regeneration of rhodopsin in green-sensitive (GS) rods (Kefalov et al., Reference Kefalov, Estevez, Kono, Goletz, Crouch, Cornwall and Yau2005). Retinal tissue was isolated under infrared illumination, whereupon a small sample was mechanically dissociated and perfused continuously in the recording chamber with Ringer’s solution consisting of: 108 mM NaCl, 2.5 mM KCl, 1.0 mM MgCl2, 1.5 mM CaCl2, 0.02 mM EDTA, 10 mM glucose, 0.8 μM bovine serum albumin (BSA, essentially fatty acid free; Sigma, Saint Louis, MO), 10 mM HEPES; pH 7.6, that was bubbled with 95% O2/5% CO2 at room temperature (20–22°C). Photocurrents were recorded from the inner segment of a single rod or cone with a suction electrode using a current-to-voltage converter (Axopatch 200A; Axon Instruments, Foster City, CA), low-pass filtered at 30 Hz with an eight-pole Bessel filter (−3 dB; Frequency Devices, Haverhill, MA), and digitized at 400 Hz. No corrections were made for the delay introduced by filtering. Cells were stimulated with light from a 75 W xenon arc lamp that passed through a six-cavity interference filter (10-nm bandwidth at half-maximal transmission; Omega Optical, Brattleboro, VT), quartz neutral density filters (Omega Optical), and an electronic shutter. A nominal duration of 22 ms was used for test flashes. The rod or cone spectral type was determined by inspection of cell shape and by responses to flashes at 434, 500, and 626 nm. The light was calibrated with a photometer (UDT 350; Graseby, Orlando, FL) through a 200-μm–diameter pinhole (Melles Griot, Carlsbad, CA) placed at the level of the recording chamber. To compare spectral sensitivity by single-cell recording and absorption spectrum by MSP, intensity was measured through a linear polarizer that separated two components whose electric vectors were orthogonal and parallel to the long axis of the recorded rod outer segment.
Vitamin A (all-trans retinol) and vitamin E ((+)-α-tocopherol) were purchased from Sigma. Stocks were made in absolute ethanol, protected from light, and stored at −80°C until use. Prior to an experiment, the purities and concentrations were checked from absorption spectra measured with a Beckman DU-640 ultraviolet (UV)-visible spectrophotometer using extinction coefficients: ε vitA = 52,800/M/cm at 325 nm for vitamin A and ε vitE = 3260/M/cm at 292 nm for vitamin E (Robeson et al., Reference Robeson, Cawley, Weisler, Stern, Eddinger and Chechak1955; Podda et al., Reference Podda, Weber, Traber and Packer1996). The vitamin A stock was diluted first with ethanol and then with Ringer’s solution containing BSA to obtain the desired concentration. In preliminary experiments, instability of vitamin A (Fig. S1A) was problematic because the time course of degradation was variable and because the degradation product proved to be more potent than vitamin A (Fig. S2). Addition of vitamin E effectively stabilized the vitamin A for many hours (Fig. S1B) as previously reported (Crouch et al., Reference Crouch, Hazard, Lind, Wiggert, Chader and Corson1992). The final concentrations of vitamin E and BSA were 10 times lower than that of vitamin A and the final concentration of ethanol was ≤0.1%. In control experiments, perfusion with 0.1% ethanol, 6 μM BSA, or vitamin E at concentrations up to 10 μM had no effect on the flash responses of rods. Vitamin A was introduced to the cell through one channel of a theta tube and Ringer’s containing 6 μM BSA and 0.1% ethanol ran through the other channel to wash out vitamin A. A waste port positioned across from the theta tube established laminar flow from the two channels with little interfacial mixing. The theta tube was gravity fed through delivery tubes from two glass syringe reservoirs chilled with freezer packs. The delivery tubes were not chilled so the solutions warmed to room temperature before entering the experimental chamber. Because vitamin A was hydrophobic and adsorbed to the walls of the syringe and the delivery tube, the actual concentration in the solution exiting the theta tube was determined spectrophotometrically at the end of each experiment.
The stimulus-response relation was fit with the Hill equation:

where r is the response amplitude, r max is the saturating response amplitude, i is flash strength, H is the Hill coefficient, and i 0.5 is the flash strength required for a response of half-maximal amplitude.
Spectral sensitivities were determined (Naka & Rushton, Reference Naka and Rushton1966; Baylor & Hodgkin, Reference Baylor and Hodgkin1973) before and during treatment and after washout. Relative sensitivity was found by comparing the flash strength required for a criterion, dim flash response at each test wavelength to that at the reference wavelength, 500 nm.
Single-cell MSP
Under infrared illumination, cells were dissociated mechanically on a quartz coverslip that had been coated with poly-l-lysine to make the cells adhere. Double-sided tape was placed lengthwise on opposite edges of the coverslip and a shorter coverslip was placed on top. About 50 μl of Ringer’s solution containing small pieces of retina and single cells could be stabilized between the coverslips. This chamber was placed on the stage of the Williams–Webbers microspectrophotometer (Makino et al., Reference Makino, Howard and Williams1990).
A suitable rod was located with a closed-circuit infrared television system. Baseline measurements were taken with the probe beam passing through a cell-free area. The rod was then positioned in the path of the probe beam. The probe beam was polarized with a Nicol prism. An OD measurement will be referred to as “perpendicular” (⊥) when the electric vector was oriented orthogonal to the long axis of the outer segment and “parallel” (‖) when the rod was rotated 90 degrees. Measurements were made at room temperature (21–23°C) at 2-nm intervals over the range 250–700 nm and absorbance was calculated online.
Vitamin A in Ringer’s was delivered to the cells by placing a drop on one open side of the chamber. The fluid was drawn through the chamber by touching absorbent paper to the opposite side. The chamber was perfused one to three times in rapid succession after periods ranging from 10 to 102 min. The frequency of perfusions did not appear to affect the rate of uptake. To account for adsorption losses associated with vitamin A delivery, the concentration passing through the chamber was measured spectrophotometrically in control experiments. Absorption spectra were measured from the same cells before and during treatment with vitamin A whenever possible. In addition, absorbance was measured after washing rods with Ringer’s containing 6 μM BSA, to simulate conditions used in electrophysiological experiments.
The molar ratio of vitamin A to rhodopsin was determined for individual rods in order to chart the time course of uptake. The average OD‖ spectrum of untreated rods was scaled to match the OD‖ spectrum of a given rod being treated with vitamin A between 480 and 600 nm. The difference spectrum was taken as the absorbance due to vitamin A and fitted with a Gaussian. The range of the fit was typically 300–400 nm, although the short wavelength limit was sometimes varied to avoid intrusion from imperfect subtraction of the protein absorption band. The OD⊥ spectrum of a treated rod was used to determine rhodopsin content. If an OD⊥ spectrum was not available, the dichroic ratio was found for untreated rods as OD⊥/OD‖ at the absorbance maximum near 500 nm. The OD‖ spectrum for the treated rod was then multiplied by this dichroic ratio, and the spectrum fit over the range 460–650 nm with the sum of two template functions for 11-cis retinal (A1) and 11-cis dehydroretinal (A2) components of visual pigment (Govardovskii et al., Reference Govardovskii, Fyhrquist, Reuter, Kuzmin and Donner2000) with maxima at 501 and 519 nm, respectively. The vitamin A to rhodopsin ratio was then calculated as:

where OD refers to the optical density of vitamin A, A1 visual pigment or A2 visual pigment, and ε is the corresponding molar extinction coefficient: 52,800/M/cm for vitamin A, 42,000/M/cm for A1 visual pigment (Matthews et al., Reference Matthews, Hubbard, Brown and Wald1963), and 30,000/M/cm for A2 visual pigment (Brown et al., Reference Brown, Gibbons and Wald1963).
Vitamin A binding assay
Rod outer segments were isolated from frozen bovine retinas (W.L. Lawson, Lincoln, NE) under infrared illumination using a stepwise sucrose density gradient (McDowell, Reference McDowell and Hargrave1993). Rhodopsin was purified according to Litman (Reference Litman1982) with slight modifications. The outer segments were suspended in solubilizing buffer consisting of: 0.1% (w/v) sucrose monolaurate (SM) (Fluka, Neu-Ulm, Germany), 0.5 mM MgCl2, 140 mM NaCl, 1 mM dithiothreitol, 10 mM HEPES; pH 7.5, and were stirred at 4°C for 1 h. The supernatant containing solubilized rhodopsin was loaded onto a concanavalin A sepharose 4B (Sigma) column equilibrated with the same buffer. The column was washed with the same buffer until unbound protein was no longer present in the collected fractions. The concentration of SM in the column was decreased gradually by first rinsing with the solubilizing buffer containing 0.05% SM and then with enough solubilizing buffer containing 0.02% SM to exchange the bed volume of the column 15 times. Bound rhodopsin was eluted with solubilizing buffer containing 0.5 m methyl α-d-mannopyranoside (Sigma) and 0.02% SM. Rhodopsin concentration was determined from the difference in absorbance at 500 nm before and after complete bleaching in the presence of 10 mM hydroxylamine. Rhodopsin purity was confirmed by an absorbance at 280 nm that was less than two times that at 500 nm (Irreverre et al., Reference Shichi, Lewis, Irreverre and Stone1969).
For binding assays, samples contained 1 μM rhodopsin in solubilizing buffer containing 0.5 m methyl α-d-mannopyranoside and 0.02% SM. The requisite amounts of vitamin A in 1.5 μl of ethanol were added to 150 μl of sample to yield final concentrations varying from 0.23 to 120 μM. After incubating the sample at room temperature (21–23°C) for 10 min, the concentration of vitamin A dissolved in the solution was determined from its absorbance at 325 nm. For high concentrations of vitamin A, samples were diluted in order to measure absorbance. Control experiments were carried out with 1-μM recombinant human vascular cell adhesion molecule (VCAM-1) (R&D Systems, Minneapolis, MN) in the same buffer or with the buffer alone. An extinction coefficient of 52,800/M/cm for vitamin A was assumed to be applicable for all conditions.
Fluorescence measurements of vitamin A with rhodopsin in solution
Four hundred micromolar vitamin A in 10 μl ethanol was added to 1 ml of 1 μM rhodopsin in solubilizing buffer containing 0.02% SM for a predicted [vitamin A] = 4 μM. The actual [vitamin A] was determined as described for the binding assay above. Excitation and emission spectra were measured with a Perkin-Elmer MPF-44A fluorescence spectrometer (Perkin-Elmer Corp., Norwalk, CT). For the former determination, emission was monitored at 480 nm, while for the latter, the sample was excited with 330 nm light. Baseline measurements were performed with vitamin A alone. Control samples of rhodopsin alone showed negligible fluorescence.
Results
Effects of vitamin A on flash responses of GS rods
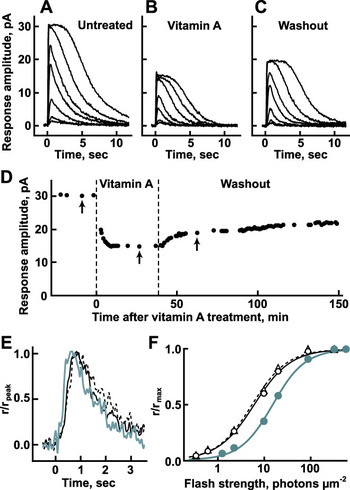
Perfusion of the outer segment of a dark-adapted GS rod with 8–10 μM vitamin A reduced the amplitude of the saturating flash response by as much as 50%, indicating that up to half of the circulating current had been suppressed (Fig. 1A, 1B, and 1D). Onset of the suppression was rapid and a new steady state was reached within the first 15 min of continuous exposure (Fig. 1D). Additionally, the kinetics of flash responses became slightly faster (Fig. 1E) and sensitivity declined by more than twofold; for the rod in Fig. 1F, the flash strength giving rise to a half-maximal response, i 0.5, increased from 6.2 to 15 photons/μm2 at 500 nm. Since background light also suppresses circulating current, accelerates flash response kinetics, and decreases sensitivity to flashes (reviewed in Pugh & Lamb, Reference Pugh, Lamb, Stavenga, DeGrip and Pugh2000; Fain et al., Reference Fain, Matthews, Cornwall and Koutalos2001), vitamin A likely exerts its effect by activating the “phototransduction” cascade. After washing the cell with Ringer’s containing BSA for 25 min, flash response kinetics and sensitivity recovered completely (Fig. 1E and 1F) but circulating current was only partially restored (Fig. 1C). Circulating current continued to recover over the next several hours, albeit at a slower rate (Fig. 1D). Eight to ten micromolar vitamin A also affected circulating current, response kinetics, and relative sensitivity in two blue-sensitive (BS) rods, one red-sensitive (RS) cone, and two BS cones. The changes were largest in BS rods and may have been larger in cones than in GS rods, although an effect of vitamin A on unregenerated pigment in these “dark-adapted” cells (cf. Kefalov et al., Reference Kefalov, Estevez, Kono, Goletz, Crouch, Cornwall and Yau2005) was probably included. Averaged results are summarized in Fig. S3.
Impact of vitamin A on the flash responses of a representative GS rod. Families of averaged responses to 500 nm flashes before treatment (A), during perfusion with 10 μM vitamin A + 1 μM vitamin E (B), and after washing with Ringer’s containing 6 μM BSA (C). Flashes were given at time = 0 s. Flash strengths were 0.35, 0.63, 2.3, 10, 20, 88, and 320 photons/μm2 for the untreated and washed families and 1.3, 2.3, 10, 20, 88, 320, and 570 photons/μm2 for the treated family. Each trace is an average of 6–11 trials. (D) Time course of the change in maximal response amplitude under the three different conditions. Response families shown in (A–C) were recorded at the times indicated by arrows, respectively. (E) Faster dim flash response kinetics in the presence of vitamin A (gray trace) than before treatment (black trace) or after washing (dashed black trace). Flashes eliciting responses that were <15% of the maximal response under each condition were considered to be dim. Responses were normalized by their peak amplitudes. (F) Loss in sensitivity to flashes induced by vitamin A. The stimulus–response relation during perfusion with vitamin A (gray circles, from B) shifted to the right compared to that before perfusion (open circles, from A). Sensitivity recovered after washing (open triangles, from C). Lines show the fits with eqn. (1): prior to treatment with vitamin A, i 0.5 = 6.2 photons/μm2, H = 1.1; during treatment, i 0.5 = 15 photons/μm2, H = 1.3; and after washing, i 0.5 = 5.6 photons/μm2, H = 1.1.

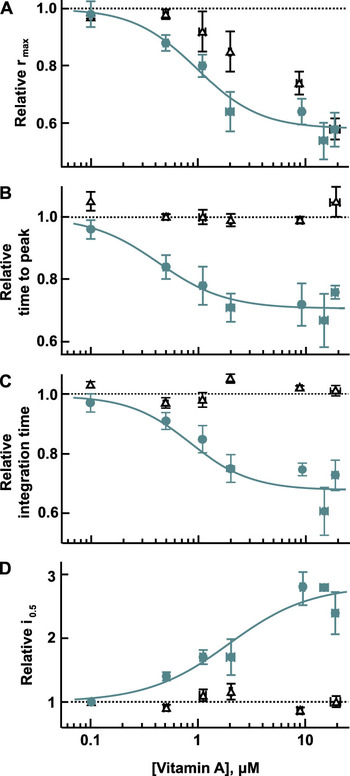
With 17–23 μM vitamin A, the highest concentrations we were able to attain in a 0.1% ethanolic solution, maximal response amplitude in GS rods fell to 0.6 of that before treatment (from 27 ± 4 to 17 ± 4 pA, mean ± s.e.m., n = 4), time to peak was 1.3 times faster (from 0.86 ± 0.12 to 0.68 ± 0.09 s), integration time was 1.3 times briefer (from 2.9 ± 0.3 to 2.2 ± 0.1 s), and relative sensitivity was 2.4 times lower (i 0.5 increased from 3.9 ± 0.3 to 9.4 ± 0.9 photons/μm2). The magnitudes of these effects were not significantly different from those at 10 μM vitamin A and appeared to approach saturation so dose–response relations were fit with the Hill equation (Fig. 2, gray circles and lines). Each data point for a given parameter necessarily came from a different rod; it was not possible to test the same rod with more than one applied concentration of vitamin A because rods were reluctant to relinquish their vitamin A upon washing, as will be shown below. The applied concentration of vitamin A that suppressed half of the circulating current (k 1/2) was 1.0 μM with a Hill coefficient of 1.5. The k 1/2 was 0.4 μM for time to peak, 0.9 μM for integration time, and 1.9 μM for sensitivity to 500 nm flashes, respectively. The four parameters appeared to covary with applied vitamin A concentration, and k 1/2 values and Hill coefficients were in reasonable correspondence, given the considerable individual variability in each parameter between cells. After washing with albumin to remove vitamin A, flash response kinetics and sensitivity recovered completely but circulating current did not (Fig. 2, open triangles). The residual suppression of circulating current after washing was likely to have resulted from a direct effect on the CNG channel, for which vitamin A is a known inhibitor (Dean et al., Reference Dean, Nguitragool, Miri, McCabe and Zimmerman2002; Horrigan et al., Reference Horrigan, Tetreault, Tsomaia, Vasileiou, Borhan, Mierke, Crouch and Zimmerman2005).
Dose-dependent effects of vitamin A on flash response properties. GS rods were treated with vitamin A for 40–90 min prior to assessment (gray circles, n = 2–7) and then washed with BSA for a minimum of 20 min prior to reassessment (open triangles, n = 2–4). Lines in (A–C) show the fits with a Hill function:  , where p is the parameter of interest, p′ is the pretreated value, p min is the minimum, p max is the maximum, [vitamin A] is the applied concentration of vitamin A, k 1/2 is the vitamin A concentration required for a half-maximal change in p, and H is the Hill coefficient. Error bars mark s.e.m. Although mean values are shown for clarity, the fits were to data points from individual cells because the numbers of observations at each [vitamin A] were unequal. (A) Decline in circulating current expressed as maximal response amplitude during treatment divided by that prior to treatment. For a fixed maximum of 1.0, the fit returned k 1/2 = 1.0 μM, minimum = 0.6, and H = 1.5. (B) Shortening of the time to peak of the dim flash response with vitamin A. For a maximum set to 1.0, the fit returned k 1/2 = 0.4 μM, minimum = 0.7, and H = 1.4. (C) Decrease in the integration time of the dim flash response with vitamin A. For a maximum set to 1.0, the fit returned k 1/2 = 0.9 μM, minimum = 0.7, and H = 1.5. (D) Dependence of the sensitivity to flashes at 500 nm on [vitamin A] as gauged by the flash strength required for a half-maximal response amplitude, i 0.5. For a minimum set to 1.0, the fit to
 returned k 1/2 = 1.9 μM, maximum = 2.8, and H = 1.1.

Sensitization of rods to UV light by vitamin A
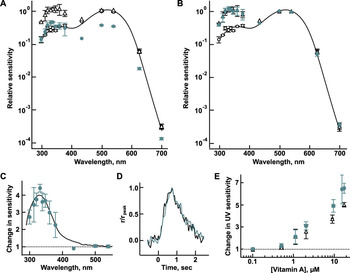
Some effects of vitamin A were wavelength dependent; during perfusion with 8–10 μM vitamin A, sensitivity to flashes declined at all visible wavelengths but there was little or no change at UV wavelengths (Fig. 3A, gray circles). After normalizing to match relative sensitivity between pretreatment and treatment conditions at the two longest wavelengths, vitamin A was found to increase relative sensitivity to UV light by 3.9-fold (Fig. 3B and 3C). Hence, some “GS” rods became maximally sensitive to ∼330 nm. The change in relative sensitivity during treatment matched well to the relative absorption spectrum of vitamin A (Fig. 3C). Flash response kinetics were similar between UV and long wavelengths (Fig. 3D), consistent with the principle of univariance; once absorbed, UV and visible photons induced the same active state of rhodopsin. Vitamin A also enhanced the relative sensitivity to UV light in two BS rods and two RS cones (data not shown). It was suggested that in some insect photoreceptors, vitamin A absorbs UV light and then donates the energy to the retinal chromophore of rhodopsin by Förster resonance energy transfer (FRET) to make the photoreceptors more sensitive to UV light (reviewed in Vogt, Reference Vogt, Stavenga and Hardie1989). Thus, our results suggested that vitamin A was also an accessory chromophore for FRET with vertebrate rod and cone visual pigments.
Enhanced relative sensitivity of GS rods to UV wavelengths after being perfused with vitamin A. (A) Averaged spectral sensitivities before treatment (open circles), during treatment with 8–10 μM vitamin A (gray circles), and after washing with Ringer’s containing 6 μM BSA (open triangles). Mean spectral sensitivities (n = 1–3) were normalized to the sensitivity at 500 nm before treatment. Error bars show s.e.m. (B) Normalization of the spectral sensitivity during treatment to bring into correspondence the values at the two longest wavelengths to those prior to treatment. The spectral sensitivity prior to treatment was fit with a template (Govardovskii et al., Reference Govardovskii, Fyhrquist, Reuter, Kuzmin and Donner2000), shown as a continuous line in (A) and (B). (C) Difference in relative sensitivity before and during treatment with vitamin A replotted on a linear scale. Black line shows the scaled relative absorption spectrum of vitamin A in Ringer’s containing BSA; λ max was 329 nm. Ringer’s + BSA was used to make the baseline measurement for the absorption spectrum. (D) Similarity in the form of the dim flash responses to 331 nm (gray trace) and to 500 nm (black trace) in the presence of vitamin A. Responses were normalized by their peak amplitudes. (E) Dependence of relative sensitivity to 331 nm flashes during treatment (gray circles) and after washing (open triangles) on applied concentration of vitamin A. The change in sensitivity was expressed as the value during treatment relative to that of the untreated rod (n = 1–7).

The concentration dependence of sensitization to UV light, determined after exposure to vitamin A for 30–60 min, is shown in Fig. 3E. But in three GS rods, there was a further increase in relative sensitivity to UV wavelengths after washing, indicating that the additional exposure to vitamin A between the initial measurement of UV sensitivity and washing allowed for a greater enhancement. Therefore, this dose–response relation represented a snapshot in time rather than an equilibrium condition because a maximal effect was not necessarily obtained for each applied concentration of vitamin A. As will be described below, uptake continued throughout the exposure to vitamin A. A notable point was that the effect of vitamin A on sensitivity saturated with 500 nm light but did not with UV light (compare Figs. 2D and 3E). Subsequent washing of GS rods with Ringer’s containing BSA for 20–30 min increased uniformly the absolute sensitivity to all wavelengths (Fig. 3A, open triangles). Thus, the relative sensitivity to UV wavelengths remained elevated. In no case did UV sensitivity return to pretreatment values after washing for at least 30 min even though the sensitivity to other wavelengths returned completely (Figs. 2D and 3E). The marked difference in the dose–response relations for sensitivity to UV and visible wavelengths and their reversibility of the effect on UV sensitivity implied that vitamin A affected sensitivity to the two wavelength domains by acting at different sites.
Uptake of vitamin A into the outer segments of rods
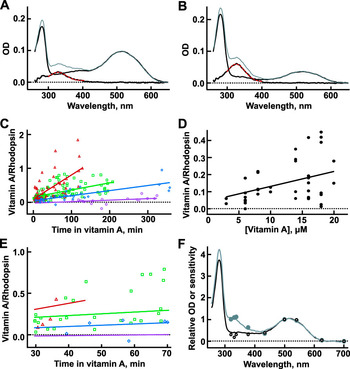
In order to quantify the amount of vitamin A in the outer segment and the time course of uptake, the absorbance of single GS rods was measured by MSP. In the outer segments of untreated rods, there was a prominent absorbance peak near 280 nm due to the tryptophans and tyrosines in protein, as well as a peak near 515 ± 2 nm (n = 9 salamanders, where the value for each salamander derived from measurements of 13–31 rods) arising from rhodopsin (e.g., Fig. 4A, thin black line). The alignment of rhodopsin molecules within the disk membranes of the outer segment caused absorbance at long wavelengths to be strongest when the long axis of the outer segment was perpendicular to the electric vector of the probe beam with a dichroic ratio,  (n = 9 salamanders). The protein band was not dichroic, D = 0.94 ± 0.06 (n = 9 salamanders). These observations are in general agreement with absorbance measurements by others (Liebman, Reference Liebman and Dartnall1972; Hárosi, Reference Hárosi1975; Cornwall et al., Reference Cornwall, MacNichol and Fein1984).
Uptake of vitamin A into the outer segments of GS rods. (A) Average OD⊥ spectra before (thin black line) and during treatment with 6 μM vitamin A for 60–90 min (gray line, n = 13 rods). The wavelength maximum of the difference spectrum (thick black line) was 329 nm by fitting with a Gaussian (dashed red line). (B) Corresponding OD‖ measurements for the same cells in (A). The vitamin A to rhodopsin ratio was 0.32, determined from eqn. (2). (C) Time course of vitamin A uptake. Fits by linear regression yielded slopes of 0.000442, 0.00151, 0.00210, 0.00704/min and y-intercepts of −0.0311, 0.0377, 0.146, and 0.101 for bathing concentrations of 1 μM (purple circles and line, n = 19 rods), 3 μM (blue diamonds and line, n = 31 rods), 6–10 μM (green squares and line, n = 98 rods), and 16–20 μM (red triangles and line, n = 54 rods), respectively. T-tests based on the Pearson correlation coefficients for all [vitamin A] yielded P values < 0.02. (D) Increase in initial uptake (treatment time <15 min) with bathing concentration of vitamin A in 40 rods. The ratio of vitamin A to rhodopsin = 0.0419 + 0.00875[vitamin A], by linear regression, P < 0.005. (E) Time course of vitamin A uptake from 30 to 70 min (from C) during which measurements of sensitivity were made on different cells in physiological recordings. Physiological measurements with more than 17 μM vitamin A were carried out between 30 and 45 min of treatment (cf. red line for 16–20 μM vitamin A). Points and lines reproduce those shown over a longer time scale in (C). (F) Comparison of action spectra from three rods to absorption spectra from eight rods in the presence (gray circles and line) or absence of ∼8 μM vitamin A (open circles and black line). The absorption spectrum was adjusted to account for the polarization of the light in the suction electrode recording (see Results).

Vitamin A readily partitioned into the membranes of the rod. Perfusion with vitamin A increased UV absorbance in the inner segments of rods (data not shown) as well as in their outer segments with a maximal change near 330 nm (Fig. 4A and 4B, gray and thick black lines). Since baseline measurements were taken in a cell-free area through the bathing solution containing vitamin A, the change in UV absorbance represented an accumulation of vitamin A on or within the cell. In contrast to rhodopsin, vitamin A absorbed light best when the electric vector of the measuring beam was parallel to the long axis of the outer segment, consistent with an alignment of the molecule perpendicular to the interior disk membrane surfaces. The dichroic ratio for vitamin A was approximately 0.50 ± 0.03 (n = 20 rods) after long treatments extending from 30 to 193 min. Endogenously formed vitamin A assumes a similar orientation within the outer segment after the bleaching of rhodopsin (Denton, Reference Denton1959; Liebman, Reference Liebman and Dartnall1972). Although the behavior of individual rods was variable, the overall trend was for uptake to exhibit an initial rapid component, followed by a slower component that did not equilibrate even after perfusion for several hours (Fig. 4C and 4D). Both the initial level of uptake and the rate of uptake of the slow component increased with higher bathing concentrations of vitamin A. The initial uptake ranged from 0.05 to 0.2 vitamin A per rhodopsin (Fig. 4D, regression line). For applied vitamin A concentrations less than 10 μM, the slower rate of uptake did not increase greatly the vitamin A content in the outer segment over the treatment period during which measurements of flash response sensitivity and kinetics were made in the single-cell recordings (Fig. 4E). For higher applied concentrations of vitamin A, the rate of uptake was more rapid so measurements in single-cell recordings were limited to a 30- to 45-min treatment period (Fig. 4E, red line). Uptake seemed anomalously high in some rods treated with 6–10 μM or with 16–20 μM vitamin A, perhaps because the cell integrity was compromised during dissociation. Attempts to remove vitamin A from the outer segments of rods by perfusion with 6 μM BSA were unsuccessful when such high vitamin A concentrations were used (data not shown), which could explain the persistence of enhanced UV sensitivity after washing in single-cell recordings (Fig. 3).
Absorbance measurements by MSP were compared to spectral sensitivity measurements with suction electrode recording (Fig. 4F). For that purpose, the polarization of light stimulating the rod in single-cell recording was determined in order to generate a weighted mean between OD⊥ and OD‖ spectra. The spectral sensitivity matched this resultant absorption spectrum before and during perfusion with vitamin A, signifying that photic energy transfer from vitamin A to the 11-cis retinal chromophore was as effective in photoisomerizing rhodopsin as direct absorption of light by rhodopsin.
Evidence for binding of vitamin A to rhodopsin from in vitro assays
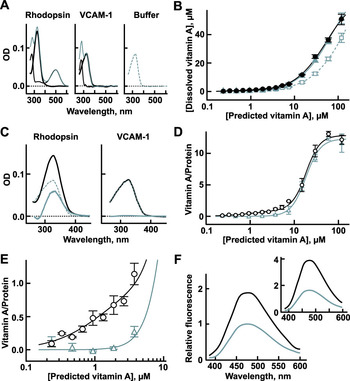
If vitamin A produced cascade activity by activating rhodopsin, then we expected it to do so upon binding. In seeking evidence of binding, we took advantage of the low solubility of vitamin A in aqueous solution (Szuts & Hárosi, Reference Szuts and Hárosi1991). If rhodopsin was capable of binding vitamin A, then the presence of rhodopsin should increase the concentration of vitamin A that could be solubilized. In vitro assays were carried out with bovine rhodopsin that has a high degree of homology to that of salamander. More vitamin A did indeed dissolve in buffer containing detergent in the presence of rhodopsin (Fig. 5A and 5B). By subtracting the amount of vitamin A dissolved in the buffer alone from that with rhodopsin, we estimated the amount of vitamin A that was induced to dissolve by the protein (Fig. 5C and 5D). With added amounts of vitamin A for predicted concentrations >5 μM, the actual concentrations were invariably less than predicted but rhodopsin increased the amount of vitamin A in solution. The cooperative binding with low affinity may have reflected nonspecific deposition of vitamin A on hydrophobic regions of the protein because control experiments on VCAM-1, a membrane protein not known to bind vitamin A, gave similar results. However, when lower amounts of vitamin A were added, rhodopsin but not VCAM-1 promoted solvation of all the vitamin A (Fig. 5E). The presence of rhodopsin increased the fluorescence of vitamin A by twofold (Fig. 5F), a feature shared with several other proteins that bind vitamin A (Futterman & Heller, Reference Futterman and Heller1972; Goodman & Leslie, Reference Goodman and Leslie1972; Bear et al., Reference Bear, Kittredge, Klinger, Briercheck, Braiman and Gonzalez-Fernandez1994). In addition, solutions of rhodopsin bearing vitamin A bleached at a faster rate with UV light (Fig. S4), indicating that the vitamin A supported energy transfer to the 11-cis retinal chromophore in rhodopsin. Therefore, all these results indicated binding of vitamin A to rhodopsin in vitro and raised the possibility of binding in intact cells.
Binding of vitamin A to rhodopsin. (A) Absorption spectra of solutions of vitamin A with 1 μM rhodopsin (left, thick black line), with 1 μM VCAM-1 (middle, thick black line), or in buffer alone (right, dashed gray line). Absorbance by the protein was removed by subtracting the absorption spectra of rhodopsin and VCAM-1 alone (thin black lines) from those of the samples with added vitamin A (thin gray lines). The amount of vitamin A added to each of the three samples was the same and was in fourfold molar excess over protein in the first two samples. The vitamin A failed to reach the predicted concentration of 4 μM but was greatest in the solution with rhodopsin. (B) The concentration of vitamin A in solution in the presence of rhodopsin (black circles and line) or VCAM-1 (gray triangles and line) or in buffer alone (open gray squares and dashed line) plotted as a function of the vitamin A concentration predicted if all the vitamin A that was added to each sample had dissolved (n = 3–4). (C) Method for determining the fraction of vitamin A bound to rhodopsin or VCAM-1 as illustrated for the results in (A) (thick gray lines). Subtraction of the absorbance of unbound vitamin A in solution (dashed lines, from the right panel in A) from the absorbance of vitamin A in solutions of rhodopsin or VCAM-1 (thick black lines, from left and middle panels in A) yielded the absorption spectra for the fraction of vitamin A bound to each protein (thick gray lines). (D) Ratio of vitamin A bound to rhodopsin (black circles and line) and VCAM-1 (gray triangles and line) plotted as a function of the vitamin A added. The bound fraction was determined by the method shown in (C). Continuous lines show fits. Results with rhodopsin at [vitamin A] >4 μM were fit with a Hill function: k 1/2 = 18 μM and Hill coefficient = 2.7. A second Hill function was added for [vitamin A] <4 μM: k 1/2 = 1.3 μM and Hill coefficient = 1.2. Results with VCAM-1 were fit with a Hill function: k 1/2 = 18 μM and Hill coefficient = 2.6. (E) Ratio of vitamin A to either rhodopsin or VCAM-1 at low predicted vitamin A concentrations (redrawn with expanded axes, from D). (F) Increase in vitamin A fluorescence upon binding to rhodopsin. Peak emission for vitamin A in detergent (gray line) was set to 1.0. The predicted [vitamin A] = 4 μM for both samples, but the actual vitamin A concentrations were spectrophotometrically estimated to be 2.8 and 1.6 μM in the samples with and without rhodopsin, respectively. Therefore, the concentration of bound vitamin A was 2.8−1.6 = 1.2 μM. The relative emission of the bound vitamin A (black line) was determined by subtracting the spectra shown in the Inset and then multiplying by 1.6/(2.8−1.6) = 1.3 to normalize for [vitamin A]. Inset: Measured emission spectra of vitamin A in solution with (black line) and without rhodopsin (gray line) upon excitation with 330 nm. These samples differed from those used in (A) and (C).

Discussion
Vitamin A activates rhodopsin
The continuous activation of rhodopsins within a rod by steady light sustains phototransduction cascade activity that suppresses a fraction of the circulating current, decreases sensitivity to flashes, and accelerates dim flash response kinetics. Vitamin A produced the same set of effects (Fig. 1), but in principle, it could have done so by activating rhodopsin, transducin, and/or PDE. Direct inhibition of the CNG channel by vitamin A (Dean et al., Reference Dean, Nguitragool, Miri, McCabe and Zimmerman2002; Horrigan et al., Reference Horrigan, Tetreault, Tsomaia, Vasileiou, Borhan, Mierke, Crouch and Zimmerman2005) contributed to the loss in circulating current, but that interaction could not have accounted for the decreased sensitivity or faster flash response kinetics (cf. He et al., Reference He, Alexeev, Estevez, McCabe, Calvert, Ong, Cornwall, Zimmerman and Makino2006). Retinoids fail to activate either transducin or PDE in biochemical assays (Keirns et al., Reference Keirns, Miki, Bitensky and Keirns1975; Yoshizawa & Fukada, Reference Yoshizawa and Fukada1983; Cohen et al., Reference Cohen, Yang, Robinson and Oprian1993; Jäger et al., Reference Jäger, Palczewski and Hofmann1996; Kono et al., Reference Kono, Goletz and Crouch2008). Although a weak interaction with transducin and/or PDE cannot be ruled out, the arguments that follow favor activation of rhodopsin by vitamin A.
Vitamin A and other retinoids such as all-trans retinal and a truncated analog, β-ionone, activate apo-opsin (Yoshizawa & Fukada, Reference Yoshizawa and Fukada1983; Jones et al., Reference Jones, Crouch, Wiggert, Cornwall and Chader1989; Isayama et al., Reference Isayama, Chen, Kono, Degrip, Ma, Crouch and Makino2006; Kono et al., Reference Kono, Goletz and Crouch2008; Ala-Laurila et al., Reference Ala-Laurila, Cornwall, Crouch and Kono2009). Even 11-cis retinal raises a burst of activity (Kefalov et al., Reference Kefalov, Crouch and Cornwall2001). The capacity for many retinoids to interfere with rhodopsin regeneration with 11-cis retinal by direct competition (Matsumoto & Yoshizawa, Reference Matsumoto and Yoshizawa1975; Daemen, Reference Daemen1978; Towner et al., Reference Towner, Gaertner, Walckhoff, Oesterhelt and Hopf1981) led to the idea that activation and regeneration share a common binding site (Kefalov et al., Reference Kefalov, Cornwall and Crouch1999). Thus, opsin activity gets boosted by the β-ionone ring of 11-cis retinal but is subsequently silenced by the slower formation of a covalent Schiff base linkage at the opposite end (Kefalov et al., Reference Kefalov, Cornwall and Crouch1999). However, observations that all-trans retinal weakly promotes the rate of rhodopsin regeneration (Sachs et al., Reference Sachs, Maretzki, Meyer and Hofmann2000), and that β-ionone activates some opsins even after regeneration (Isayama et al., Reference Isayama, McCabe England, Crouch, Zimmerman and Makino2009) point to an additional or perhaps an alternate mode of action. A bulk effect on the lipid membrane that renders rhodopsin unstable (Mitchell et al., Reference Mitchell, Niu and Litman2001; Niu et al., Reference Niu, Mitchell and Litman2001) was ruled out in the case of vitamin A because washing the rod with BSA fully restored sensitivity and kinetics of responses to flashes at long wavelengths (Fig. 1) yet failed to reverse UV sensitization in single-cell recordings or to remove vitamin A from the disk membranes of the outer segments in MSP experiments (Figs. 3 and 4). Instead, the physiological results, taken along with the results of in vitro assays (Fig. 5; Fig. S4), suggest that rhodopsin bound vitamin A and that binding produced activation.
Characterization of vitamin A binding
There was some uncertainty in calculating the stoichiometry of binding based on measurements of absorbance because the extinction coefficient for vitamin A is sensitive to environmental factors. Values range from 17,800/M/cm in water to 46,000/M/cm for vitamin A bound to retinol-binding protein and to 52,800/M/cm in ethanol (Robeson et al., Reference Robeson, Cawley, Weisler, Stern, Eddinger and Chechak1955; Horwitz & Heller, Reference Horwitz and Heller1973; Szuts & Hárosi, Reference Szuts and Hárosi1991). We used the last value to estimate [vitamin A] in our solutions as well as in cells; a lower value would yield higher ratios of vitamin A to rhodopsin.
Rods bathed for 40 min in [vitamin A] = 16–20 μM amassed approximately one vitamin A molecule per two rhodopsins (Fig. 4E) and consequently became 2.6-fold less sensitive to visible light (Fig. 2D). An equivalent loss in sensitivity is produced by steady light that isomerizes approximately 60 rhodopsins/s (cf. Pugh & Lamb, Reference Pugh, Lamb, Stavenga, DeGrip and Pugh2000). Assuming that there are a few billion rhodopsins in the rod (e.g., Pugh & Lamb, Reference Pugh, Lamb, Stavenga, DeGrip and Pugh2000), half of which have a vitamin A bound and are catalytically active, then the integrated activity of one of these rhodopsins would be approximately 10 million times lower than that of a light-activated rhodopsin. This level of activity is comparable to that of apo-opsin (Jones et al., Reference Jones, Cornwall and Fain1996). The saturation of sensitivity loss at [vitamin A] in which the vitamin A to rhodopsin ratio was less than one could be explained by a scenario, in which vitamin A only activated a certain subpopulation of rhodopsins: a certain conformation, a multimer, rhodopsins interacting with an accessory protein as is the case for some GPCRs (Christopoulos & Kenakin, Reference Christopoulos and Kenakin2002), or rhodopsins at a particular location. For example, allosteric binding of vitamin A on the extracellular surface of rhodopsins in the plasma membrane could explain why activation disappeared soon after washing despite a large content of vitamin A in the disk membranes and UV sensitization. Depending upon the relative size of the subpopulation, the specific activity of rhodopsin activated by vitamin A could be considerably higher.
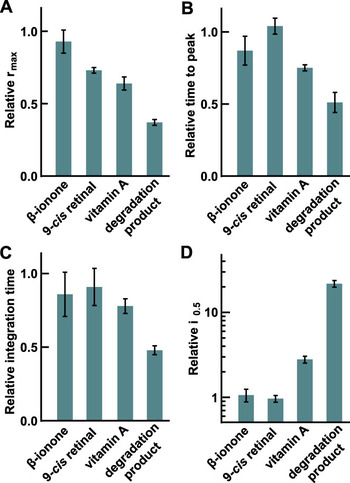
The effects of extracellularly applied vitamin A on GS rods may be compared to those of other retinoids. β-Ionone and 9-cis and 11-cis retinals, at concentrations ∼50 μM, inhibited the CNG channel but did not activate rhodopsin (Kefalov et al., Reference Kefalov, Estevez, Kono, Goletz, Crouch, Cornwall and Yau2005; He et al., Reference He, Alexeev, Estevez, McCabe, Calvert, Ong, Cornwall, Zimmerman and Makino2006; Isayama et al., Reference Isayama, McCabe England, Crouch, Zimmerman and Makino2009). Four micromolar 11-cis vitamin A in liposomes desensitized GS rods by 10-fold (Jones et al., Reference Jones, Crouch, Wiggert, Cornwall and Chader1989), suggesting that the cis isomer might be a more powerful agonist than the trans isomer. Unexpectedly, a degradation product(s) of vitamin A at a concentration <10 μM produced the greatest activation of rhodopsin (Fig. 6; Fig. S2). The most active ingredient was not identified, but the spectral shift to shorter wavelengths (Fig. S1) was consistent with a loss in conjugation. These results suggested that a retinoid whose separation of β-ionone ring to terminal aldehyde or alcohol group was longer than that of β-ionone but shorter than that of all-trans vitamin A, could activate GS rod pigment most effectively. Candidates for the binding site include several of the proposed sites on GS rod opsin for retinal (reviewed in Heck et al., Reference Heck, Schädel, Maretzki and Hofmann2003) and a recently identified site for β-ionone on GS rod rhodopsin (Makino et al., Reference Makino, Riley, Looney, Crouch and Okada2010). The mechanism for rhodopsin activation has yet to be identified. Taking a more global view, many other GPCRs are subject to allosteric regulation at various sites by compounds that contain ring structures (reviewed in May et al., Reference May, Leach, Sexton and Christopoulos2007; Yanamala & Klein-Seetharaman, Reference Yanamala and Klein-Seetharaman2010), so vitamin A might even be pharmacologically active in tissues that do not express opsins.
Comparison of the effects of various retinoids on the flash response parameters of GS rods. Maximal response amplitude, time to peak and integration time of the dim flash response, and i 0.5 are shown in (A–D), respectively. Values are mean ± s.e.m. of the parameter during treatment with retinoid normalized to that before treatment (β-ionone: ∼14 μM, n = 2; 9-cis retinal: ∼3 μM, n = 7; vitamin A: ∼10 μM, n = 7; vitamin A + degradation product: ∼10 μM, n = 3). Results for β-ionone (Isayama et al., Reference Isayama, McCabe England, Crouch, Zimmerman and Makino2009) and 9-cis retinal (He et al., Reference He, Alexeev, Estevez, McCabe, Calvert, Ong, Cornwall, Zimmerman and Makino2006) were obtained from modification of published data. 9-cis retinal inhibited the CNG channel to suppress the circulating current without activating rhodopsin, and the suppression was slow and similar between ∼3 and ∼7 μM of 9-cis retinal (He et al., Reference He, Alexeev, Estevez, McCabe, Calvert, Ong, Cornwall, Zimmerman and Makino2006).

Mechanism underlying sensitization of rhodopsin to UV light by vitamin A
The enhanced relative UV sensitivity of photoreceptors upon treatment with vitamin A (Fig. 3) indicated that vitamin A absorbed UV light and then transferred the energy to the chromophore of rhodopsin. The high efficiency of energy transfer (Fig. 4) ruled out the trivial mechanism, whereby rhodopsin simply absorbed vitamin A fluorescence because fluorescence would have spread in all directions and most of the energy would have been lost. Instead, there must have been radiationless transfer. Such a mechanism could occur in two ways. Dexter type requires contact between donor and acceptor and involves collisional exchange of energy. On the other hand, FRET can occur over greater distances if the donor and acceptor are aligned and if there is spectral overlap between the emission of the donor and absorption by the acceptor. The critical Förster distance at which half the energy is transferred is typically 20–90 Å (Lakowicz, Reference Lakowicz and Lakowicz2006). Rods contain huge amounts of rhodopsin with an average distance between centers of rhodopsin of 45 Å (Fotiadis et al., Reference Fotiadis, Liang, Filipek, Saperstein, Engel and Palczewski2004). Thus, a vitamin A inserted in the middle of a unit cell of a triangular matrix of rhodopsins would be 26 Å from each of three rhodopsins. The broad emission of vitamin A at 480 nm (Fig. 5F) falls well within the main absorption band of rhodopsin. Although the orientation of the vitamin A with respect to the chromophore of rhodopsin is not optimal for FRET (Fig. 4A and 4B), the lengthened radiative lifetime of vitamin A in phospholipid or bound to protein (Radda & Smith, Reference Radda and Smith1970) coupled with the large oscillator strength of rhodopsin and the extreme rapidity of its isomerization (Wang et al., Reference Wang, Schoenlein, Peteanu, Mathies and Shank1994) may allow energy transfer to occur with high efficiency. If so, then vitamin A may sensitize vertebrate rhodopsins by FRET as was suggested for insect rhodopsins (Vogt, Reference Vogt, Stavenga and Hardie1989).
Possible impact of vitamin A on photoreceptor physiology
Vitamin A activates apo-opsin (Kono et al., Reference Kono, Goletz and Crouch2008), and in the present study, we showed that it also activates rhodopsin. Bright light can release millimolar levels of all-trans retinal, which is enzymatically reduced to vitamin A in the photoreceptor outer segment. Vitamin A may accumulate in the retina to levels that transiently reach hundreds of micromolar (Dowling, Reference Dowling1960; Saari et al., Reference Saari, Nawrot, Kennedy, Garwin, Hurley, Huang, Possin and Crabb2001, Reference Saari, Nawrot, Garwin, Kennedy, Hurley, Ghyselinck and Chambon2002; Jin et al., Reference Jin, Li, Nusinowitz, Lloyd, Hu, Radu, Bok and Travis2009). Such concentrations of vitamin A are sufficiently high enough to activate apo-opsin and rhodopsin. It is unclear how such an activity would benefit vision after exposure to bright light. The activity, which is equivalent to that produced by a persistent background light, would desensitize the photoreceptors and could potentially delay dark adaptation, at least to visible wavelengths. Genetic mutations that disrupt the removal of vitamin A from photoreceptors could promote formation of a degradation product, not normally formed in the retina. Under certain conditions, vitamin A and its degradation product could contribute to overstimulation of photoreceptors and cell death. Thus, the ability of vitamin A to activate rhodopsin has important implications for the health of the retina. Why then should rods convert retinal to vitamin A? Vitamin A has a lower aqueous solubility than retinal, so movement of the former within rods and through the interplexiform matrix may be more easily controlled. Interestingly, a previous report found no evidence for channel inhibition after large bleaches of rhodopsin in isolated rods (He et al., Reference He, Alexeev, Estevez, McCabe, Calvert, Ong, Cornwall, Zimmerman and Makino2006) suggesting that intrinsically formed vitamin A may be handled differently from vitamin A applied exogenously. It may be that any risks imposed by vitamin A formation are outweighed by the benefits of removing retinal. Because in addition to its pharmacological effects on CNG channel (Dean et al., Reference Dean, Nguitragool, Miri, McCabe and Zimmerman2002), opsin (Yoshizawa & Fukada, Reference Yoshizawa and Fukada1983), and retinoic acid receptors upon conversion to retinoic acid, retinal has undesirable chemical reactivity with a propensity to form Schiff bases with lipids, proteins, and other substances (van Breugel et al., Reference van Breugel, Bovee-Geurts, Bonting and Daemen1979). The formation of one product, N-retinyl-N-retinylidene ethanolamine (A2E), has been implicated in age-related macular degeneration (Eldred & Lasky, Reference Eldred and Lasky1993). Indeed, all-trans retinal and A2E accumulate after exposure to light in the eyes of mice lacking interphotoreceptor retinoid-binding protein, the ATP-binding cassette transporter, retinol dehydrogenase or their combination, and eventually the photoreceptors degenerate (Weng et al., Reference Weng, Mata, Azarian, Tzekov, Birch and Travis1999; Maeda et al., Reference Maeda, Maeda, Imanishi, Sun, Jastrzebska, Hatala, Winkens, Hofmann, Janssen, Baehr, Driessen and Palczewski2006, Reference Maeda, Maeda, Golczak and Palczewski2008, Reference Maeda, Golczak, Maeda and Palczewski2009; Jin et al., Reference Jin, Li, Nusinowitz, Lloyd, Hu, Radu, Bok and Travis2009). In contrast, vitamin A but not retinal builds up in retinas of mice deficient in cellular retinol-binding protein or lecithin retinol acyltransferase and the photoreceptors are largely spared (Saari et al., Reference Saari, Nawrot, Garwin, Kennedy, Hurley, Ghyselinck and Chambon2002; Batten et al., Reference Batten, Imanishi, Maeda, Tu, Moise, Bronson, Possin, Van Gelder, Baehr and Palczewski2004).
The ability of vitamin A to act as an accessory chromophore would heighten the relative sensitivity of a photoreceptor to UV light after exposure to bright light. Thus, the photoreceptor would maintain sensitivity to light at these wavelengths despite the reduction in sensitivity to longer wavelengths due to the loss in quantal catch by bleaching, opsin activity, and desensitization caused by vitamin A-induced activation of rhodopsin. The effect would be transient, slowly subsiding as vitamin A is cleared from the photoreceptor. Vision in humans would not be impacted because their lens strongly absorbs those wavelengths, but there are members of every vertebrate class whose retinas contain UV-sensitive cones (reviewed in Bowmaker, Reference Bowmaker2008; Hunt et al., Reference Hunt, Carvalho, Cowing and Davies2009) so in all likelihood, their ocular media do transmit UV light. The physiological significance of enhanced UV sensitivity remains a subject for future research.
Fig. S1. Stabilization of vitamin A with vitamin E. Absorption spectra of 10 μM vitamin A in Ringer’s containing 1 μM of BSA without (A) or with 1 μM vitamin E (B) measured 1 min after preparation (black line) or 3 h later (gray line). Ringer’s containing BSA was used for baseline measurements. Solutions were kept at room temperature (20–22°C). Initially, the spectral maximum was 327–328 nm. In the absence of vitamin E, the maximum shifted to 289 nm.
Fig. S2. Greater effects of vitamin A + degradation product(s) on flash response properties of a GS rod. Averaged responses to 500 nm flashes before treatment (A), during perfusion with vitamin A + degradation product(s) (B), and after washing with Ringer’s containing 0.8 μM of BSA (C). Flashes were given at time = 0 s. Flash strengths were 0.17, 0.71, 2.6, and 41 photons/μm2 for the untreated and washed families and 11, 41, 98, 360, and 640 photons/μm2 for the treated family. The maximal responses were 21.5, 8.6, and 21.2 pA for the untreated rod, the treated rod, and the washed rod, respectively. Each trace is an average of 6–11 trials. (D) Dim flash response kinetics for the untreated rod (black trace), the treated rod (gray trace), and the washed rod (dashed black trace). (E) Stimulus–response relations before treatment (open circles), during treatment (gray circles), and after washing (open triangles) for the rod whose responses are shown in (A–C). Lines show the fits of the Hill equation [eqn. (1)]. For the untreated rod, i 0.5 = 2.6 photons/μm2, H = 1.2. For the treated rod, i 0.5 = 59 photons/μm2, H = 1.5. For the washed rod, i 0.5 = 2.7 photons/μm2, H = 1.2, indicating full recovery of sensitivity. (F) Difference spectra (black lines), estimated from measured spectra shown in Inset, were fit with Gaussian functions (dashed red lines). The average absorption maximum was 313 nm, reflecting the uptake of vitamin A and a degradation product absorbing at shorter wavelength. Inset: Absorption spectra from the outer segment of a GS rod before (black line) and during treatment for 12, 52, and 83 min with vitamin A whose concentration at the start of the experiment was 8 μM (gray lines). MSP and single-cell recording were carried out on different cells.
Fig. S3. Relative changes in flash response parameters of rods and cones caused by 8–10 μM vitamin A. Maximal response amplitude, time to peak, integration time, and i 0.5 are shown in (A–D), respectively. Each value is given as a mean ± s.e.m. for the ratio of the parameter during treatment to that prior to treatment (GS rod, n = 5; BS rod, n = 2; RS cone, n = 1; BS cone, n = 2). The time to peak and integration time refer to dim flash responses, whose kinetics match those of the single photon response. The i 0.5 values of GS rods, BS rods and cones, and RS cone are given for wavelengths near their spectral maxima: 500, 434, and 626 nm flashes, respectively.
Fig. S4. UV photosensitivity of bovine rhodopsin in solution was enhanced by vitamin A. The amount of rhodopsin was plotted on a logarithmic scale as a function of the duration of exposure to 331 nm light in the absence (open black circles) or presence of a predicted [vitamin A] = 4 μM (filled black circles) or to 500 nm light in the absence (open gray triangles) or presence of vitamin A (filled gray triangles). Equivalent exposure durations were calculated by multiplying the actual duration for 500 nm by the ratio of the light intensity at 500 nm to that at 331 nm. Error bars show s.e.m. (n = 4). Lines (continuous lines for presence of vitamin A, dashed lines for absence of vitamin A) show the fits with the single exponential equation: fraction of remaining pigment = exp(−t/τ), where t is light exposure duration and τ is the time constant. For 331-nm light bleaching, τ was 26 min without vitamin A and 6.3 min with vitamin A. For 500 nm, τ = 6.7 min without vitamin A and τ = 6.5 min with vitamin A.
Acknowledgments
We thank Dr. E.R. Makino for helpful advice regarding the in vitro assays, Drs. X.-H. Wen and T.R. Middendorf for insightful discussions, and Dr. A.L. Zimmerman for comments on the manuscript. This research was supported by Award Numbers EY011358 and EY014104 from the National Eye Institute and the Lions of Massachusetts. The content is solely the responsibility of the authors and does not necessarily represent the official views of the National Eye Institute or the National Institutes of Health.